
 ?Mathematical formulae have been encoded as MathML and are displayed in this HTML version using MathJax in order to improve their display. Uncheck the box to turn MathJax off. This feature requires Javascript. Click on a formula to zoom.
ABSTRACT
Stem cell-based cardiogenesis has become a powerful tool to enhance our understanding of cardiac development and test novel therapeutics for cardiovascular diseases. However, transcriptional and epigenetic regulation of multiple transitional stages from pluripotent cells to committed cardiomyocytes has not yet been fully characterized. To characterize how transcription factors, lincRNAs and DNA methylation change at temporal developmental stages, and identify potential novel regulators during cardiogenesis. We utilized a previously reported protocol that yields human cardiomyocytes (hCM) with more than 90% purity from human Embryonic Stem Cells (hESC). Leveraging the purity of cells resulting from this protocol, we systematically examined how gene expression and DNA methylation programs change at temporal developmental stages during cardiogenesis. Our results provide a comprehensive view of expression changes during cardiogenesis that extend previous studies, allowing us to identify key transcription factors as well as lincRNAs that are strongly associated with cardiac differentiation. Moreover, we incorporated a simple but powerful method to screen for novel regulators of cardiogenesis solely based on expression changes and found four novel cardiac-related transcription factors, i.e., SORBS2, MITF, DPF3, and ZNF436, which have no or few prior literature reports and we were able to validate using siRNA. Our strategy of identifying novel regulators of cardiogenesis can also be easily implemented in other stem cell-based systems. Our results provide a valuable resource for understanding cardiogenesis that extends previous findings by leveraging the purity of our cell lines, which allowed us to identify four novel cardiac-related regulators.
Introduction
The formation of the mature mammalian heart is governed by intricate gene regulatory networks, and precise temporal and spatial gene expression dictates the formation of cardiomyocytes. Transcription factors (TFs) regulate both activation and repression of the genes in cardiomyocyte specification and differentiation [Citation1]. For example, zinc finger transcription factor GATA4 is one of the major TFs that determines cardiac cell fate and its mutation results in congenital heart disease [Citation2].
Recent advances in the method of directed differentiation using human pluripotent stem cells (hPSCs) to generate enriched cardiomyocytes in a dish have provided a powerful platform for studying not only human development but also disease mechanism and translational research [Citation2–Citation5]. However, these methods do not usually lead to pure populations of differentiated cardiomyocytes, but rather to heterogeneous populations that also include other cell types. This limitation complicates the ability to define cardiomyocyte-specific regulatory programs, as they are diluted by effects from other cell types. As a result, transcriptional and epigenetic regulation of multiple transitional stages from pluripotent cells to committed cardiomyocytes have not yet been fully characterized with hPSC-CMs differentiated in a chemically defined manner, despite the fact that these in vitro systems are to date the most suitable models because of their scalability and effectiveness.
To extend previous studies of cardiomyocyte developmental regulators, we utilized chemically defined directed differentiation of cardiomyocytes from hESCs, which reproducibly yields over 90% of cardiomyocytes [Citation6–Citation8]. We performed a systematic analysis of the transcriptome and methylome of crucial stages of directed cardiac differentiation of human embryonic stem cells (hESCs). This data enabled us to profile the stage-specific changes in the global transcriptome and epigenetic changes during cardiac differentiation without the need for further purification steps of differentiated cell populations. The direct comparison of our data to previous reports [Citation3,Citation9] validated the highly efficient cardiac differentiation system by demonstrating higher enrichment of cardiac gene expressions in our system. By identifying induced transcription factors, we discovered previously understudied cardiomyocyte regulators: MITF, SORBS2, DPF3, and ZNF436. The regulatory function of these cardiac genes was further validated by RNAi gene knockdown. This work provides an extension of previous studies and a comprehensive view of gene expression and epigenetic modifications during cardiac differentiation and proposes a simple but powerful screening method of novel gene regulators, which is readily transferable to other studies of differentiating cells.
Results
Differentiation of high purity cardiomyocytes from human embryonic stem cells
To characterize the differentiation stages, we performed mRNA expression profiling with RNA-Seq from H9 to human embryonic stem cell-derived cardiomyocytes (hESC-CMs) at five distinct stages: undifferentiated stage (hESC, day 0); mesodermal precursor stage (hMP, day 2); cardiac progenitor stage (hCP, day 5); immature cardiomyocyte (hCM15, day 15); and hESC-CM differentiated for 15 additional days (hCM30, day 30) [Citation6]. The statistics of total sequenced reads, mapped reads, reads falling into exons and sequence coverages were put in Supplementary Table 1. Two biological replicates for each stage were highly correlated (Pearson correlation coefficient: 0.995) with each other, and we thus merged them for downstream analyzes (except for differentially expressed genes analyzed). Representative immunostaining for alpha-actinin (Supp Figure 1) and flow cytometry quantification for cardiac marker gene of Tnnt2 (Supp Figure 2) was performed to confirm the high purity of our differentiated cells. We further compared fold enrichments between cardiac signature gene expression and total gene expression at the same stage of differentiation of day 15 in our data and that obtained from Paige et al and Liu et al. [Citation3,Citation9]. We found that for all key signature genes we tested, our system showed higher expression enrichments, suggesting that our cell lines have higher cardiomyocyte percentages than those found in previous studies or our differentiation protocol promoted cardiac differentiation more than theirs (). This legitimized the further transcriptional analysis of the cardiomyocytes derived with our directed cardiac differentiation method for the quest of novel regulators of cardiac development.
Patterns of gene expression changes from hESCs to cardiomyocytes
We next investigated the temporal pattern of genome-wide gene expression changes during cardiomyocyte differentiation. We first computed the normalized read counts for each gene across each time point to determine the gene expression values (see Methods for more details). To characterize the expression changes, we subtracted expression values by their means across the five stages. shows the heatmap of the average mean subtracted expression values of the k-means clusters. Genes in cluster 1 (with 1,755 genes) show a clear pattern of decreasing gene expression, while genes in cluster 3 (with 1,005 genes) show the opposite trend.
Figure 1. Patterns of gene expression changes during cardiogenesis.(a). Comparison of signature gene expression enrichments for cardiomyocytes between our study and Paige et al./Liu et al. The y-axis represents the log 2 fold change between expression values of signature genes and average expression values of all genes. (b). K-means clustering of normalized gene expression values for samples among the five developmental stages. The color in the heatmap represents the log 2 fold change of expression values. The red color represents a higher expression value than average expression across samples, while the blue color represents the opposite. Text on the left of heatmap indicates the enriched gene ontology terms for each cluster of genes. (c). Genome browser view of RNA-Seq data for POU5F1 gene and MYL7 gene. Each track shows the expression profile for a different stage. (d). MA-plot of differential expressed genes for neighboring stage comparisons (A VS B). The number N shows the number of up and down-regulated genes. The number above the red line represents the number of DEGs that is up-regulated in A.
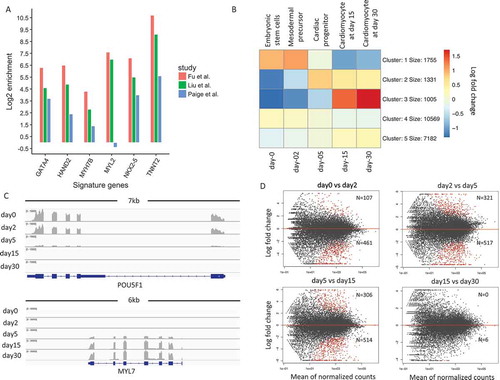
Gene Ontology (GO) enrichment analysis was applied to each cluster using an online tool of DAVID [Citation10]. It then showed that cluster 1 genes were significantly enriched in GO terms related to cell proliferation and stem cell population maintenance (Supp Figure 3). By contrast, cluster 3 genes were significantly enriched in GO terms associated with cardiac muscle contraction and heart development (Supp Figure 4). We found that the genes in cluster 2 (with 1,331 genes) also showed an increasing pattern but remained largely unchanged from day 5 to day 30. These genes were significantly enriched in GO terms of anterior/posterior pattern and heart development (Supp Figure 5). The remaining genes in cluster 4 and cluster 5, which represented 81 percent of all genes, showed limited or no changes during cardiomyocytes differentiation. An example of a cluster 1 gene is POU5F1 (also known as OCT4), which is a key regulator of pluripotency [Citation11]. The expression of POU5F1 dramatically decreased by day 5 as the cells developed into the cardiac progenitor stage (). By contrast, MYL7 in cluster 3, a signature gene for cardiac muscle cells [Citation12], was first expressed on day 5 and further induced at later stages ().
Besides the clustering of genes, we also performed differential gene expression analysis between subsequent temporal stages () (see Methods). Most differentially expressed genes were identified during the transition from mesodermal precursors to cardiac progenitors (day2-day5) and cardiac progenitors to early-stage cardiomyocytes (day5-day15). Gene ontology enrichment analysis confirmed that there was an increase in the expression of cardiac-related genes and a decrease of stem cell genes. Notably, gene expression changes found between the day15-day30 comparison were much smaller than the other three comparisons, indicating the limited degree of expression changes in cells from day 15 to day 30. Interestingly, the most dynamic change in differential gene expression was between day 5 (hCP; cardiac progenitor stage) and day 15 (hCM15; early cardiomyocyte stage) among all other transitions.
Transcription factors mediating transitions from hESC to cardiomyocytes
Having shown the global pattern of gene expression changes, we next sought to identify upstream regulators that bound to gene promoter regions of genes associated with the different clusters. We used Ingenuity Pathway Analysis [Citation13], which collects empirical information of upstream regulators for a large set of genes, to search for significantly enriched regulators. As the identified regulators shown in Figure 2(a), among the cluster 1 genes with a decrease in expression over time as in , POU5F1, SOX2, IFNG, and CREB1 are significantly enriched in the upstream regulatory networks of 1,755 genes. Among cluster 2 genes (1,331 genes), TGFB1 and WNT3A were identified. For genes in cluster 3 (1,005 genes), we found TBX5, MEF2C, HNF1A, MYOCD, and DNMT3B. Thus, our analyzes not only confirmed our established knowledge but also further identified a potential regulator (DNMT3B) of cardiogenesis.
To systematically evaluate the induction of transcription factors during cardiogenesis, we next investigated the change in the expression of 1,835 human TFs from a comprehensive curated list [Citation14], shows the top 50 TFs with the largest variances relative to the normalized expression values of the five stages. Among those top 50 TFs with the largest variances, canonical pluripotency TFs, such as POU5F1, SOX2, NANOG, were repressed with time, while canonical cardiac TFs, such as HAND2, TBXs, NK2s, and MEF2C, were gradually induced. Mesodermal TFs including T, MIXL1, MESP1, and EOMES peaked on day 2. This analysis provides a set of the most dynamic TFs with potentially important regulatory functions throughout all the stages of cardiac differentiation analyzed here.
Figure 2. Identification of upstream regulators, most varied and stage-specific transcription factors (TFs) during cardiogenesis. (a). Ingenuity pathway software analysis identifies statistical significant upstream regulators for the cluster of genes showed in . (b). Heatmap for top 50 TFs showing the largest expression variations from ESCs to cardiomyocytes. Each column represents a different sample, and each row represents a different gene. The color in the heatmap again represents the log 2 fold change of normalized expression values. (c). Heatmap for stage-specific TFs from ESCs to cardiomyocytes. The color in the heatmap represents the proportion of expression value for that sample to the sum of all samples.
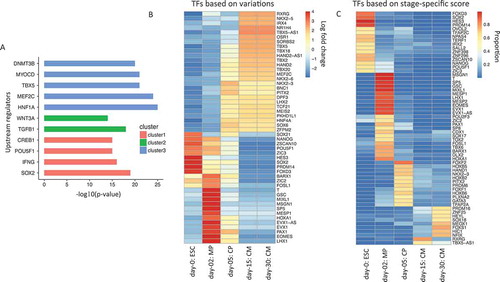
Moreover, we sought to identify stage-specific TFs of each stage (see Methods). As a result, we identified 16 ESC-specific, 23 MP-specific, 12 CP-specific, 2 CM15-specific and 8 CM30-specific TFs (). The gene sets of ESC- and MP-specific genes are similar to the ones identified in . However, this analysis revealed a set of genes that were not identified in , such as HOXB on day 5 and PRDM16 and NFIX on day 30. The role of these regulators in cardiogenesis is relatively less characterized. The regulated activity of the transcription factor HOXB is essential for heart formation as well as other mesodermal and endodermal cell type development [Citation15]. PRDM16 is a gene regulatory protein implicated in human cardiomyopathy [Citation16,Citation17]. NFIX also regulates myogenesis although its role in cardiogenesis is poorly understood [Citation18,Citation19]. Thus this approach identified a number of cell type specific TFs associated with distinct developmental stages from ESCs to cardiomyocytes.
The expression induction score accurately captures known cardiac regulators
We hypothesized that TFs regulating cardiogenesis should show significant induction of gene expression during early cardiac development. We thus used a scoring system based on induction rates between day 30 and day 0 to sort the 1,835 curated genes with TF functions (see Methods). shows the factors with the top 25 induction scores. For example, HAND2 is the top TF based on our ranking and plays an essential role in cardiac morphogenesis. A genome browser view of this gene revealed high expression at the CM30 stage while limited expression at the ESC stage (). This pattern corresponded to an induction rate of 139. We also put a full list of TFs and their induction scores in Supplementary Table 2.
Figure 3. Expression-based induction score captures a large fraction of well-known cardiac regulators. (a). Bar-plot of the top 25 regulators (y-axis) ranked by their induction scores (x-axis). (b). Genome browser view of RNA-Seq data for HAND2. (c). The proportion of known cardiac regulators in the top 25 hits based on the ranking score by our study and by Paige et al. (d). Venn-diagram of the top 25 regulators identified by our ranking approach and by Paige et al.
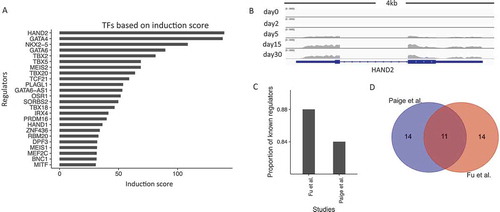
Surprisingly, among the top 25 factors in , 21 or 84% are already known to be cardiac-related TFs with extensive associated literature reports. Two previous studies also examined a time course of human cardiogenesis by generating genome-wide profiles. In Paige et al., the authors used a combinatorial model of histone modifications and gene expression changes to predict cardiac regulatory transcription factors [Citation3]. From the ranked list based on their scoring model, 20 of the top 25 (80%) factors were supported by previous studies (). We find that the two ranked lists, Paige et al. and ours, had an overlap of 11 factors among the top 25 hits (), which is highly significant considering the total number of TFs (hypergeometric test, P value = 9.3X10⁻¹⁶). However, in our approach, we only considered RNA-Seq expression profiling of undifferentiated and fully differentiated cells. By contrast, Paige et al. collected a time course of several histone modifications using ChIP-seq, as well as RNA-Seq data to arrive at their list. Thus, even though our approach for the identification of regulators is simple, it can identify known factors with similar efficiency as Paige et. al. We recognize that this efficiency is likely in part due to the purer cardiomyocyte populations in our derived cells compared to those of other studies.
Identification of lincRNAs associated with cardiogenesis
Long intergenic non-coding RNAs (lincRNAs) play important regulatory roles in various cell differentiation processes by activating or repressing their neighboring genes. LincRNAs are regulated by enhancer/promoter sequences, subject to splicing, and are often expressed in a tissue- and stage-specific manner. Accumulating evidence suggests that lincRNAs contribute to the regulation of cardiogenesis [Citation20–Citation22]. We, therefore, extended our analysis from protein coding genes to lincRNAs (see Methods).
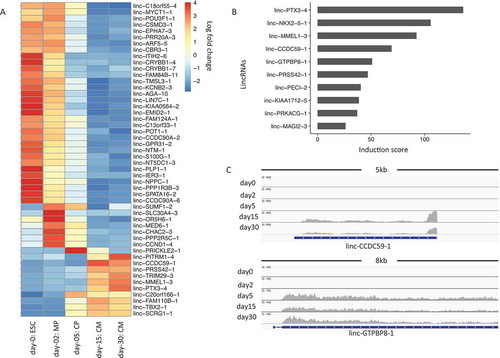
shows the top 50 lincRNAs that have the most extensive variance within a lincRNA list we examined. Moreover, we also calculated an induction rate for each lincRNA between CM30 and ESC. shows the ones with an induction score of 10 or higher. Those include linc-PTX3-4 and linc-NKX2-5-1, whose neighboring genes PTX3 and NKX2-5 are known cardiac regulators. We also found additional lincRNAs, e.g., linc-CCDC59-1 and linc-GTPBP8-1, whose neighboring genes do not have literature support in cardiac regulation. Genome browser views of those lincRNAs revealed dramatic expression activation in late developmental stages during cardiogenesis (), indicating their potential regulatory roles. These results thus provided a valuable resource for the community to further validate the functions of these lincRNAs associated with cardiogenesis.
Figure 4. LincRNA expression changes during cardiogenesis. (a). Heatmap for top 50 lincRNAs showing the largest variations from ESCs to cardiomyocytes. The color in the heatmap represents the log 2 fold change of normalized lincRNA expressions. Each row represents a lincRNA name. (b). Bar plot of lincRNAs that show an induction score of 10 or higher. (c). Genome browser view of RNA-Seq data for lincRNAs of linc-CCDC59-1 and linc-GTPBP8-1 during cardiogenesis.
Genome-wide methylation changes during cardiogenesis
To measure epigenetic changes during cardiogenesis, we performed reduced representation bisulfite sequencing (RRBS) of four stages of hESC, hMP, hCP, and hCM15 (see Methods). Data statistics of the resulted RRBS samples can be found in Supplementary Table 1. We first sought to compare the methylome between hESC and hCM15 by calculating the differentially methylated sites (DMSs) (see Methods). As a result, 2,423 hypomethylated DMSs (high in ESC) and 730 hypermethylated (high in CM15) DMSs were identified. Besides, 97% of DMSs were CpG sites, not CHG or CHH sites. We next asked what genes were close to the differentially methylated sites by assigning each site to its nearest transcription start sites (TSSs). Gene ontology analysis revealed that hypomethylated DMSs were enriched for heart morphogenesis, while hypermethylated DMSs were enriched in stem cell-related terms. Notably, many of these differentially methylated sites tend to occur in regions distal to TSSs (between 50 kb to 500 kb), instead of proximal TSS regions, indicating that many of these may correspond to enhancer regions.
We also asked whether there were enriched TF binding sites near the two groups of differentially methylated sites. By performing motif discovery in these sites and their neighboring 200 bp regions, we identified a total of 10 enriched TFs and their motif sequences () (see Methods). Those factors were then deduced by motif discovery. Among them, we were able to observe well-characterized TFs, such as GATA4 and TBX20 near hypomethylated DMSs, and OCT4 near hypermethylated DMSs. We also found additional four factors, i.e., ELK4, MYF5, ATOH1, and TFAP4, have no or weak literature evidence for their cardiac regulatory roles, suggesting that the binding of these factors may also be associated with changes in DNA methylation. Moreover, 5 of all 10 TFs ( with stars) also showed a significant change in expression during ESCs to cardiomyocytes, highlighting their regulatory roles in the development of early cardiac cells. Those results indicate RRBS can be a complementary method to RNA-Seq for the identification of cardiac regulators.
Figure 5. RRBS-based DNA methylation changes during cardiogenesis. (a). Enriched transcription factors and their motif sequences found in DMSs’ neighboring 200 bp regions. The number in the bracket shows the – log10 P value of the statistical significance for motif discovery. (b). Hierarchical clustering of RRBS fragments that show at least 0.2 delta methylation changes compared to average methylation levels across samples. The color in the heatmap represents the delta methylation value. The red color represents hyper methylation while blue color represents hypo methylation.
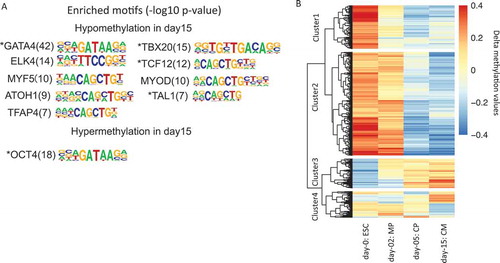
Besides methylated sites, we further performed hierarchical clustering on RRBS fragments that show changes during cardiogenesis (see Methods) (). The RRBS fragments were sequences between two consecutive restriction sites (C/CGG) cut by Mspl enzyme used in our protocol. In , 1,988 fragments in cluster 1 and 835 fragments in cluster 2 show a clear decrease of methylation levels from ESC to CM, while 561 fragments in cluster 3 show an opposite trend. The fragments in those clusters then represent the most dynamically changed regions of methylation during early cardiac development. Motif discovery analysis in those regions also identified both known and candidate factors to be further validated (Supp Figure 6).
siRNA-mediated gene knockdown validates four novel regulators of cardiac development
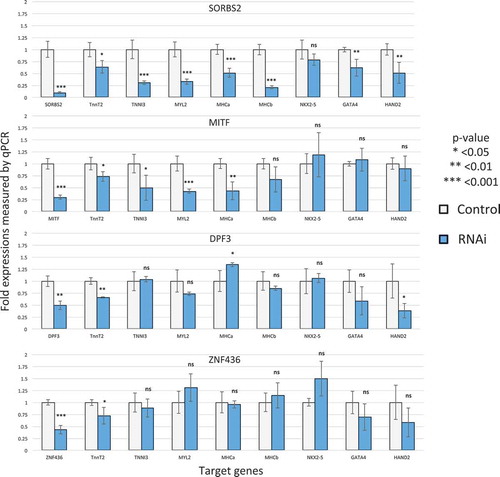
Four factors from our list of the top 25 in , i.e., SORBS2, ZNF436, DPF3, and MITF, had no or limited literature support indicating they were cardiac regulators. SORBS2 is an adaptor protein that coordinates multiple signaling complexes to regulate the actin cytoskeleton [Citation23–Citation25]. The role of SORBS2 in the heart is not known, but it is linked to congenital heart disease in humans [Citation26], and its mutant mice are under-represented at weaning [Citation27]. Therefore, it is possible that SORBS2 is a critical regulator of heart development. DPF3 is a histone reader component of BAF chromatin remodeling complex [Citation28,Citation29]. Although the BAF complex is known to regulate heart development, little is known about the role of DPF3 in cardiogenesis [Citation30]. There are only a few publications about the role of ZNF436 and MITF on cardiomyocyte differentiation [Citation31–Citation33].
We thus experimentally validated the role of these factors in cardiogenesis by knocking them down with siRNAs in hESC-CMs on day 18 and measured whether the expression of cardiac marker gene was affected on day 28. Knockdown efficiency measured by qPCR was 70% for MITF, 90% for SORBS2, 50% for DPF3, and 56% for ZNF436. Many cardiac genes were significantly down-regulated by these knockdowns (). A majority of the cardiac sarcomeric genes were down-regulated by MITF and SORBS2, suggesting their role as cardiac regulators. The known cardiac transcription factors were also down-regulated, but to a lesser extent than sarcomeric genes. Moreover, the specific down-regulation patterns suggest that each factor that is knocked down has specific regulatory roles. For example, HAND2 was significantly down-regulated by DPF3 knockdown but not by MITF, even though the knockdown efficiency of MITF is higher than that of DPF3.
Figure 6. siRNA gene expression knockdown identifies four novel cardiac regulators. The y-axis represents the relative expression level (control is 1). The gray bar represents the control while the blue bar represents the RNAi result of that factor.
Discussion
Heterogeneity is a common bottleneck for research using stem cell-derived cell lines. Recent progress in single-cell sequencing technologies addresses this problem by profiling of omics for each cell. However, due to the limited amount of DNA or RNA in a single cell, current technologies usually generate sparse and low coverage sequencing data, impeding their power to comprehensive profiling of molecular changes. To overcome this problem in the in vitro modeling of cardiogenesis, we utilized a chemically defined differentiation protocol, which reproducibly yields ~ 90% cardiomyocytes [Citation6–Citation8]. The purity of cardiomyocytes generated with our protocol is higher than that of previously published studies. We thus profiled this highly efficient ESC-based cardiomyocyte differentiation protocol to study the development of cardiac cells. Our analysis focused on the identification of transcription factors and lincRNAs that are strongly associated with the temporal development of cardiogenesis. We were able to capture both well-characterized regulatory factors as well as identify novel ones. Our results provide a comprehensive view of expression changes for important cardiac regulators that extend previous studies.
It is worth noting that in the upstream regulator analysis, we found several well-known factors as well as HOXB3. Among them, TBX5 is known to play a key role during the maturation of cardiomyocytes and the patterning of the conduction system [Citation34]. MEF2 transcription factors are central to the regulation of muscle cell differentiation, and MEF2C regulates cardiogenesis through its interactions with other key transcription factors [Citation35]. MYOCD is enriched in and essential for cardiac and smooth muscle cells [Citation36]. DNMT3B is a ubiquitously expressed de novo DNA methyltransferase. Its role in cardiogenesis is not established, but the mutant mouse develops a cardiac ventricular septal defect [Citation37]. Thus, it is likely that HOXB3 also regulates cardiac differentiation.
There are two major factors influencing the study of hPSC-derived systems. One is which assay, e.g., RNA-Seq, ATAC-Seq, BS-Seq, ChIP-Seq, is used to study the biological mechanisms of the differentiation process. Another is the efficiency of the differentiation protocol. Our chemically-defined differentiation regimen minimizes the experiment-to-experiment variability and consistently yields high purity cardiomyocytes. In this study, we showed that by profiling high purity differentiated cells using RNA-Seq, we were able to identify many known, and a few novel regulatory factors. We expect that this differentiation protocol will be a valuable approach to further investigate the early development of cardiac cells. In addition, our analysis suggests that RRBS can be a complementary method to RNA-Seq for the identification of cardiac regulators. Our differentiation and profiling strategy is effective to screen for novel regulators, although genome-wide profiling of chromatin marks could provide a deeper understanding of epigenetic regulation during cardiogenesis.
Our approach has led to the identification of four novel gene regulators. Although additional in vivo experiments will be needed to further address their functions, we performed siRNA knockdown experiment to examine their effects in vitro on key cardiac signature genes. The determination of how transcription factors, epigenetic enzymes, non-coding RNAs interact with each other in a regulatory network is the logical next step to expand our knowledge of cardiogenesis using system biology. The understanding of cardiogenesis could ultimately lead to novel therapeutic and drug target development in the diagnosis and treatment of heart-related diseases.
Materials and methods
Cell cultures from embryonic stems cells to cardiomyocytes
H9 (WA09) hESC lines were maintained as described before [Citation38]. Oct-4, SSEA4, TRA-1-60, and TRA-1-80 were tested by immunocytochemistry to confirm the pluripotency state of hESC before starting differentiation. hESCs were routinely verified as mycoplasma-free using a luminometer. hESCs were grown and differentiated in a chemically defined condition [Citation6–Citation8]. Briefly, hESCs were detached and held in suspension culture using cardiac differentiation medium (DCDM) containing IMDM and DMEM (ThermoFisher) supplemented with 1% MEM nonessential amino acid solution, 2 mM L-glutamine, 1% penicillin-streptomycin (ThermoFisher). The medium was additionally supplemented with chemical compounds: 1 uM CHIR (Abcam) for first two days and switched to KY021111 (a gift from Dr. Minami Itsunari, Osaka University) and XAV939 (Santa Cruz) on day 3 and day 5 of differentiation. DCDM was changed every ten days after differentiation day 10. Usage of all the human embryonic stem cell lines is approved by the UCLA Embryonic Stem Cell Research Oversight (ESCRO) Committee and the Institutional Review Boards (IRB) (approval #2009-006-04).
Library preparations and sequencing for RNA-Seq
RNA was extracted from the cells of five stages; namely, hESC, hMP, hCP, hCM15, and hCM30, using TRIZOL (TheroFisher) and RNeasy kit (QIAGEN) according to manufacturer’s protocol. DNaseI-treated RNA (500 ng) was used as input material for library preparation using the Illumina TruSeq mRNA kit (Illumina, RS-122–2001), according to manufacturer’s instructions. Final libraries were sequenced as Sequencing was performed on an Illumina HiSeq 3000 for either single-end 50 bp or paired-end 2 × 50 bp run.
Library preparations and sequencing for RRBS
Reduced-Representation Bisulfite Sequencing was performed as described in Lam L. et al., with some modifications [Citation39]. For each sample, 100 ng of purified genomic DNA was digested with 20 U of MspI (NEB, cat # R0106L) at 37°C o/n in the presence of RNase Cocktail Mix (Ambion, cat # AM2286). End-repair and dA-tailing were performed by the addition of Klenow Fragment 3ʹ-> 5ʹ exo- (NEB, cat # M0212L) in the presence of dATP, dGTP, and d5mCTP (Fermentas). Adapter Ligation was performed by the addition of 0.3 µl of Illumina TruSeq methylated Adapters (Illumina, TruSeq Nano cat# FC-121–4001) and 1 µl of Quick DNA Ligase (NEB cat# M2200L). Samples were pooled and purified using an equal volume of SPRI beads (Beckman Coulter, cat # B23318). Size-selection was performed using SPRI beads to enrich for fragments from 200 to 400 bp. Bisulfite treatment was performed using Epitect Bisulfite kit (QIAGEN, cat # 59104) according to manufacturer’s protocol, except that two consecutive rounds of conversion are performed, for a total of 10 hr of incubation. Purified converted DNA was PCR amplified using MyTaq HS Mix (Bioline, cat# BIO-25045) and TruSeq PCR Primer Cocktail (Illumina, TruSeq Nano cat# FC-121–4001) according to the following protocol: initial denaturation at 98°C for 30 s; 12 cycles of 98°C for 15 s, 60°C for 30 s, 72°C for 30 s; final extension at 72°C for 5 min. Amplified libraries were purified twice with an equal amount of SPRI beads to remove primer and adapter dimers. Libraries were sequenced on an Illumina HiSeq 3000 for single-end 100 bp run.
RNA-Seq analysis
We first used the FastQC program to assess the quality of our sequenced reads. All the samples passed this step of quality control. We then used Tophat software to map the RNA-Seq reads back to the human genome (hg19) [Citation40] under default parameters. The number of total sequenced reads, number of mapped reads, number of reads falling into exons and read coverages were put in the supplementary Table 1. After that, we utilized HTseq software to calculate the number of reads falling in each gene [Citation41]. With the RNA-Seq read counts matrix, we then used the DESeq2 package of R to perform data normalization (rlog function) and differentially expressed genes (DEG) analysis [Citation42]. For DEG analysis, we set a cutoff of FDR ≤ 0.01 and fold change ≥ 2. The two replicate samples of each stage were highly correlated. We thus merged them for downstream analysis, including most varied transcription factors, stage-specific transcription factors, most induced transcription factors and lincRNA analyzes.
Identification of stage-specific transcription factors
We calculated the ratios between normalized expression values of that stage over the sum of values of all stages for each TF. A TF was considered to be stage-specific only if it showed a proportion of at least 0.6, which is 3 times higher than that of the average proportion, 0.2, across the five stages.
Induction score calculation
To search for the most changed genes from ESCs to CMs, we introduced the calculation of induction score. An induction score (IS) was calculated as the ratio of Reads Per Million between day 30 (yi) and day 0 (xi) for each gene i. We also added a small pseudo read count to day 0, resulting:
We then ranked all the transcription factors and lincRNAs based on their induction scores, enabling us to recapture both known cardiac factors and screening for novel ones.
LincRNA analysis
We used a curated list of human lincRNAs and mapped RNA-Seq reads to each lincRNA [Citation43]. As with protein-coding genes, the sum of normalized read counts mapped to each lincRNA region was then used to represent its expression value. We then computed the variance of lincRNA normalized expression values among the five developmental stages. The induction score was also calculated in lincRNAs based on the expression values between day0 and day30.
siRNA knockdown and functional validation of novel regulators
hESC-derived CMs were transfected with siRNA Negative Control (Qiagen) or human MITF, SORBS2, DPF3, and ZNF436 targeting siRNA 40 nM (MITF and SORBS2; Qiagen, DPF3 and ZNF436; ThermoFisher) using Lipofectamine RNAi MAX reagent (ThermoFisher) according to the manufacturer’s instructions. The medium was changed 48 hours after transfection, and cells were then incubated for an additional seven days.
Reduced representation bisulfite sequencing (RRBS) analysis
The FastQC program was used to assess the quality of the sequenced reads. All the samples passed this step of quality control. The number of total sequenced reads, number of mapped reads, and read coverages were put in the supplementary Table 1. We then used BS-Seeker2 software to mapping the RRBS data back to the human genome (hg19) and calculating methylation levels for each CpG [Citation44]. We then used CGmaptools to perform the differentially methylated sites (DMS) analyzes [Citation45]. The identified DMSs were based on chi-square test that corrects for different read coverage between the two samples (P value cutoff: 10−3). To determine the RRBS fragments show changes during cardiogenesis, we carried out the following steps. First, to estimate the methylation level for each CpG, we filtered the CpG sites by requiring they be covered by at least 10 reads. Secondly, for each RRBS fragment, we then calculated the average methylation levels of CpG within this fragment. The average value was thus assigned to this fragment to represent the fragment methylation level. Thirdly, we further filtered the fragments that had less than 3 CpG sites, allowing us to identify 133,912 RRBS fragments covering at least 3 CpG sites across samples. Lastly, we selected RRBS fragments that showed methylation changes of 0.2 or higher relative to their average methylation levels. This led to the identification of 3,890 differentially methylated RRBS fragments in the clustering analyzes.
Motif discoveries of differential methylated sites/regions
We performed motif discovery analysis using HOMER software to both DMSs and DMRs. HOMER calculated the statistical significance of motif occurrences for observed regions to a large set of known TF motif usages [Citation46]. Only statistically significant ones matching a known TF motif were reported.
Data availability
Datasets generated in this study can be found at the following accesion number: GSE84814 (RNA-Seq) and GSE120547 (RRBS-Seq).
Author contribution
Conception and design by AN and MP, Financial Support by AN and MP, Collection and assembly of data by KF, HN, MM, TC and HP, Data analysis and interpretation by KF, HN, AN, and MP, Manuscript writing by KF, HN, AN, and MP
Supplemental Material
Download Zip (847.7 KB)Acknowledgments
We would like to thank all the members involved in this project. We would also like to thank Jinghua Tang and BSCRC stem cell core for technical support.
Disclosure statement
No potential conflict of interest was reported by the authors.
Supplementary material
Supplementary data for this article can be accessed here.
Additional information
Funding
Related Research Data
References
- Luna-Zurita L, Stirnimann CU, Glatt S, et al. Complex interdependence regulates heterotypic transcription factor distribution and coordinates cardiogenesis. Cell. 2016;164:999–1014.
- Ang Y-S, Rivas RN, Ribeiro AJS, et al. Disease model of GATA4 mutation reveals transcription factor cooperativity in human cardiogenesis. Cell. 2016;167:1734–1749.e22.
- Paige SL, Thomas S, Stoick-Cooper CL, et al. A temporal chromatin signature in human embryonic stem cells identifies regulators of cardiac development. Cell. 2012;151:221–232.
- Lan F, Lee AS, Liang P, et al. Abnormal calcium handling properties underlie familial hypertrophic cardiomyopathy pathology in patient-specific induced pluripotent stem cells. Cell Stem Cell. 2013;12:101–113.
- Wamstad JA, Alexander JM, Truty RM, et al. Dynamic and coordinated epigenetic regulation of developmental transitions in the cardiac lineage. Cell. 2012;151:206–220.
- Nakano H, Minami I, Braas D, et al. Glucose inhibits cardiac muscle maturation through nucleotide biosynthesis. Elife. 2017;6:025003.
- Zhu H, Scharnhorst KS, Stieg AZ, et al. Two dimensional electrophysiological characterization of human pluripotent stem cell-derived cardiomyocyte system. Sci Rep. 2017;7:43210.
- Minami I, Yamada K, Otsuji TG, et al. A small molecule that promotes cardiac differentiation of human pluripotent stem cells under defined, cytokine- and xeno-free conditions. Cell Rep. 2012;2:1448–1460.
- Liu Q, Jiang C, Xu J, et al. Genome-wide temporal profiling of transcriptome and open chromatin of early cardiomyocyte differentiation derived from hiPSCs and hESCs. Circ Res. 2017;121:376–391.
- Huang DW, Sherman BT, Lempicki RA. Systematic and integrative analysis of large gene lists using DAVID bioinformatics resources. Nat Protoc. 2009;4:44–57.
- Nichols J, Zevnik B, Anastassiadis K, et al. Formation of pluripotent stem cells in the mammalian embryo depends on the POU transcription factor Oct4. Cell. 1998;95:379–391.
- Kubalak SW, Miller-Hance WC, O’Brien TX, et al. Chamber specification of atrial myosin light chain-2 expression precedes septation during murine cardiogenesis. J Biol Chem. 1994;269:16961–16970.
- Krämer A, Green J, Pollard J, et al. Causal analysis approaches in ingenuity pathway analysis. Bioinformatics. 2014;30:523–530.
- Vaquerizas JM, Kummerfeld SK, Teichmann SA, et al. A census of human transcription factors: function, expression and evolution. Nat Rev Genet. 2009;10:252–263.
- Deng C, Li Y, Zhou L, et al. HoxBlinc RNA recruits Set1/MLL complexes to activate hox gene expression patterns and mesoderm lineage development. Cell Rep. 2016;14:103–114.
- Arndt A-K, Schafer S, Drenckhahn J-D, et al. Fine mapping of the 1p36 deletion syndrome identifies mutation of PRDM16 as a cause of cardiomyopathy. Am J Hum Genet. 2013;93:67–77.
- Zaveri HP, Beck TF, Hernández-García A, et al. Identification of critical regions and candidate genes for cardiovascular malformations and cardiomyopathy associated with deletions of chromosome 1p36. PLoS One. 2014;9:e85600.
- Rossi G, Antonini S, Bonfanti C, et al. Nfix regulates temporal progression of muscle regeneration through modulation of myostatin expression. Cell Rep. 2016;14:2238–2249.
- Taglietti V, Maroli G, Cermenati S, et al. Nfix induces a switch in Sox6 transcriptional activity to regulate MyHC-I Expression in fetal muscle. Cell Rep. 2016;17:2354–2366.
- Han P, Li W, Lin C-H, et al. A long noncoding RNA protects the heart from pathological hypertrophy. Nature. 2014;514:102–106.
- Wang L, Ma X, Xu X, et al. Systematic identification and characterization of cardiac long intergenic noncoding RNAs in zebrafish. Sci Rep. 2017;7:1250.
- Pang L, Hu J, Zhang G, et al. Dysregulated long intergenic non-coding RNA modules contribute to heart failure. Oncotarget. 2016;7:59676–59690.
- Kioka N, Ueda K, Amachi T. Vinexin, CAP/ponsin, ArgBP2: a novel adaptor protein family regulating cytoskeletal organization and signal transduction. Cell Struct Funct. 2002;27:1–7.
- Roignot J, Soubeyran P. ArgBP2 and the SoHo family of adapter proteins in oncogenic diseases. Cell Adh Migr. 2009;3:167–170.
- Anekal PV, Yong J, Manser E. Arg kinase-binding protein 2 (ArgBP2) interaction with α-actinin and actin stress fibers inhibits cell migration. J Biol Chem. 2015;290:2112–2125.
- Geng J, Picker J, Zheng Z, et al. Chromosome microarray testing for patients with congenital heart defects reveals novel disease causing loci and high diagnostic yield. BMC Genomics. 2014;15:1127.
- Zhang Q, Gao X, Li C, et al. Impaired dendritic development and memory in Sorbs2 knock-out mice. J Neurosci. 2016;36:2247–2260.
- Lange M, Kaynak B, Forster UB, et al. Regulation of muscle development by DPF3, a novel histone acetylation and methylation reader of the BAF chromatin remodeling complex. Genes Dev. 2008;22:2370–2384.
- Zeng L, Zhang Q, Li S, et al. Mechanism and regulation of acetylated histone binding by the tandem PHD finger of DPF3b. Nature. 2010;466:258–262.
- Cui H, Schlesinger J, Schoenhals S, et al. Phosphorylation of the chromatin remodeling factor DPF3a induces cardiac hypertrophy through releasing HEY repressors from DNA. Nucleic Acids Res. 2016;44:2538–2553.
- Li Y, Du X, Li F, et al. A novel zinc-finger protein ZNF436 suppresses transcriptional activities of AP-1 and SRE. Mol Biol Rep. 2006;33:287–294.
- Mehta G, Kumarasamy S, Wu J, et al. MITF interacts with the SWI/SNF subunit, BRG1, to promote GATA4 expression in cardiac hypertrophy. J Mol Cell Cardiol. 2015;88:101–110.
- Tshori S, Gilon D, Beeri R, et al. Transcription factor MITF regulates cardiac growth and hypertrophy. J Clin Invest. 2006;116:2673–2681.
- Steimle JD, Moskowitz IP. TBX5: a key regulator of heart development. Curr Top Dev Biol. 2017;122:195–221.
- Potthoff MJ, Olson EN. MEF2: a central regulator of diverse developmental programs. Development. 2007;134:4131–4140.
- Du KL, Ip HS, Li J, et al. Myocardin is a critical serum response factor cofactor in the transcriptional program regulating smooth muscle cell differentiation. Mol Cell Biol. 2003;23:2425–2437.
- Okano M, Bell DW, Haber DA, et al. DNA methyltransferases Dnmt3a and Dnmt3b are essential for de novo methylation and mammalian development. Cell. 1999;99:247–257.
- Arshi A, Nakashima Y, Nakano H, et al. Rigid microenvironments promote cardiac differentiation of mouse and human embryonic stem cells. Sci Technol Adv Mater. 2013;14:025003.
- Lam L, Chin L, Halder RC, et al. Epigenetic changes in T-cell and monocyte signatures and production of neurotoxic cytokines in ALS patients. FASEB J. 2016;30:3461–3473.
- Trapnell C, Pachter L, Salzberg SL. TopHat: discovering splice junctions with RNA-Seq. Bioinformatics. 2009;25:1105–1111.
- Anders S, Pyl PT, Huber W. HTSeq–a Python framework to work with high-throughput sequencing data. Bioinformatics. 2015;31:166–169.
- Love MI, Huber W, Anders S. Moderated estimation of fold change and dispersion for RNA-seq data with DESeq2. Genome Biol. 2014;15:550.
- Cabili MN, Trapnell C, Goff L, et al. Integrative annotation of human large intergenic noncoding RNAs reveals global properties and specific subclasses. Genes Dev. 2011;25:1915–1927.
- Guo W, Fiziev P, Yan W, et al. BS-Seeker2: a versatile aligning pipeline for bisulfite sequencing data. BMC Genomics. 2013;14:774.
- Guo W, Zhu P, Pellegrini M, et al. CGmapTools improves the precision of heterozygous SNV calls and supports allele-specific methylation detection and visualization in bisulfite-sequencing data. Bioinformatics. 2018;34:381–387.
- Heinz S, Benner C, Spann N, et al. Simple combinations of lineage-determining transcription factors prime cis-regulatory elements required for macrophage and B cell identities. Mol Cell. 2010;38:576–589.