
ABSTRACT
The integration of genomic and environmental influences into methylation patterns to bring about a phenotype is of central interest in developmental epigenetics, but many details are still unclear. The sex ratios of the species used here, the European sea bass, are determined by genetic and temperature influences. We created four families from parents known to produce offspring with different sex ratios, exposed larvae to masculinizing temperatures and examined, in juvenile gonads, the DNA methylation of seven genes related to sexual development by a targeted sequencing approach. The genes most affected by both genetics and environment were cyp19a1a and dmrt1, with contrasting sex-specific methylation and temperature responses. The relationship between cyp19a1a methylation and expression is relevant to the epigenetic regulation of vertebrate sex, and we report the evidence of such relationship only below a methylation threshold, ~ 80%, and that it was sex-specific: negatively correlated in females but positively correlated in males. From parents to offspring, the methylation in gonads was midway between oocytes and sperm, with bias towards oocytes for amh-r2, er-β2, fsh-r and cyp19a1a. In contrast, dmrt1 levels resembled those of sperm. The methylation of individual CpGs from foxl2, er-β2 and nr3c1 were conserved from parents to offspring, whereas those of cyp19a1a, dmrt1 and amh-r2 were affected by temperature. Utilizing a machine-learning procedure based on the methylation levels of a selected set of CpGs, we present the first, to our knowledge, system based on epigenetic marks capable of predicting sex in an animal with ~ 90% accuracy and discuss possible applications.
Background
The integration of genomic and environmental information to bring about a given phenotype is a central area of current research on developmental epigenetics [Citation1,Citation2]. Species where sex determination is dependent on both genetic and environmental influences provide excellent systems to address important questions such as how the environment shapes the epigenome during critical stages of early development with lifelong lasting consequences, and what is the contribution of epigenetic regulatory mechanisms into these processes [Citation3]. Thus, many poikilothermic vertebrates, i.e., species whose body temperature varies depending on the environment, exhibit environmental sex determination (ESD) [Citation4,Citation5]. This occurs in contrast to homoeothermic vertebrates, where sex is determined by a chromosomal system of genetic sex determination (GSD), either with male (XX/XY) or female (ZW/ZZ) heterogamety, as in mammals and birds, respectively. In species with ESD, sex is determined according to the magnitude of an environmental variable, of which temperature is the most relevant [Citation6]. ESD is present in many reptiles [Citation7] and in some fish [Citation8]. Fish, in particular, are known for having a remarkably plastic sex, and this applies not only to sequential hermaphrodites, which naturally undergo sex change as adults in response to external stimuli [Citation9] but, importantly, also to gonochoristic species, i.e., species where sex is separated in different individuals, exposed to abnormal conditions [Citation10] or to pollution [Citation11]. In fish, GSD includes species with sex chromosomes, where sex depends on the action of a ‘master’ gene, not conserved even in closely related species [Citation12,Citation13], species with a major sex locus plus secondary loci [Citation14,Citation15], and species with polygenic sex determination (PSD), where many autosomal loci contribute with minor additive effects to sex determination [Citation16,Citation17]. Even ‘pure’ GSD species may contain populations where sex is also environmentally influenced if the function of a lability trait, for example, a transcription factor or an enzyme, becomes under the influence of temperature. Consequently, GSD and ESD, rather than two mutually exclusive types of sex determination, are nowadays regarded as the two ends of a continuum, where the sex of an individual can also be the result of both genetic and environmental influences, with transitions from one system to another occurring frequently [Citation18,Citation19]. This is the case of Nile tilapia (Oreochromis niloticus), with a XX/XY system but where quantitative trait loci (QTL) have been identified between families that respond differently, indicating a genetic basis to the response to temperature [Citation20]. It is also the case of the pejerrey, Odontesthes bonariensis [Citation21]. However, the underlying molecular mechanism linking temperature to sex ratios in poikilothermic vertebrates, including fish, but also reptiles, has been the subject of much debate [Citation22]. In this regard, PSD species offer a particularly attractive situation because, in a given batch of fertilized eggs, sex ratio is naturally dependent on both maternal and paternal influences (i.e. the ‘sex tendency’ of each progenitor) and thus there will be variations in sex ratios across different families, although successive batches of the same parents will tend to exhibit similar sex ratios [Citation23,Citation24]. Hence, inter-family variation in offspring sex ratios facilitates the quantification of the genetic contribution. As PSD is midway between the two extremes, GSD and ESD, it also facilitates the quantification of the environmental contribution [Citation25].
The European sea bass, Dicentrarchus labrax, is one of those gonochoristic teleosts with PSD [Citation17]. At least three QTLs associated with sex determination have been identified in this species [Citation26]. Temperatures 13–16°C constitute the common range for spawning and early development. Variations in offspring sex ratios among families are observed [Citation17,Citation27]. However, temperatures > 17ºC masculinize fish that under lower temperatures would develop as females [Citation28,Citation29]. The thermosensitive period is 0–60 days post-fertilization (dpf) [Citation28]. Like in other species, masculinization by elevated temperature involves downregulation of aromatase (cyp19a1) expression levels [Citation30]. Aromatase is the steroidogenic enzyme that irreversibly catalyzes the conversion of androgens to estrogens [Citation31]. cyp19a1 expression and Cyp19a1 enzymatic activity are necessary to produce adequate amounts of estrogen, which are required for ovarian development in all vertebrates, except therian mammals. Thus, cyp19a1 is a key gene for sexual development in vertebrates [Citation31–Citation33]. It was in the European sea bass where evidence of an epigenetic mechanism linking environmental temperature during early development and sex ratio was first described [Citation34]. Using bisulfite sequencing and a single gene approach targeting cyp19a1a, the gonadal isoform of aromatase, an inverse relationship between methylation of the cyp19a1a promoter and gene expression in females was found. Males have constitutively higher levels of cyp19a1a methylation than females. Masculinization results from high temperature-induced hypermethylation of cyp19a1a in females during early development, which prevents the binding of the transcription factor forkhead box L2 (foxl2) necessary for its transcriptional activation [Citation34]. This leads to a decrease of aromatase expression and the effect is carried out throughout adulthood [Citation34]. Similar results using a targeted single gene approach concerning the hypermethylation of the cyp19a1 promoter in male-producing temperatures were later reported in other sensitive vertebrates, including turtles [Citation35], alligators [Citation36] and other fish, e.g., the olive flounder [Citation37,Citation38], so the role of aromatase as key actor in sexual development is well established. However, DNA methylation may also be positively correlated with gene expression under some situations [Citation39]. Thus, whether the relationship between cyp19a1 promoter methylation and gene expression holds across a wide range of methylation levels and is similar for both sexes is not clear. Furthermore, the methylation of other genes involved in sexual development might as well be affected by temperature. In this regard, in the European sea bass, even small temperature increases during early development are able to affect the DNA methylation of many genomic loci [Citation40], as assessed by methylation-sensitive AFLP, a technique that does not allow single nucleotide resolution. Further, recent studies using whole genome bisulfite sequencing (WGBS) have shown that temperature can indeed affect many loci, as evidenced in Nile tilapia [Citation41]. In the half-smooth tongue sole, Cynoglossus semilaevis, a species with a ZW/ZZ chromosomal system with dmrt1 as the sex determining gene [Citation42], WGBS revealed that the effects of elevated temperature on DNA methylation involved several genes related to sexual development such as dmrt1, amh-r2 and foxl2 [Citation43]. In this species, fish with a ZW genotype (females) were sex-reversed into phenotypic males and their offspring even when reared at normal temperature still exhibited altered patterns of DNA methylation in the Z chromosome, suggesting an epigenetic transmission of altered DNA methylation patterns [Citation43]. These studies, however, did not consider possible differences between families (genetic variation) nor did they attempt to determine the relative contribution of genetic vs. environmental influences.
Taking advantage of the European sea bass PSD system with mixed genetic and environmental influences, the objective of this study was to further investigate the role of cyp19a1a promoter methylation on the regulation of cyp19a1a expression and sex determination. We also aimed to determine the parental vs. the environmental influences on the DNA methylation. To this end, four sires known to produce progeny with different proportions of females were crossed with two dams and the resulting offspring from each cross was subjected to either control or masculinizing temperatures. About one year later, when the gonads were fully differentiated, we sampled ~ 800 fish, genotyped them, calculated the resulting sex ratios and took individual gonadal samples in a subsample of 200 randomly selected fish. WGBS, apart from being beyond our possibilities for so many samples, is also considered generally inefficient, with ~ 80% of reads being uninformative [Citation44]. We, thus, specifically developed a cost-efficient multiplex bisulfite sequencing (MBS) approach for many samples, easily customizable for any species and any genomic region of interest and applicable to any model or non-model species. We used targeted MBS to determine not only the methylation levels of cyp19a1a but also of six additional genes (foxl2, dmrt1, amh-r2, er-β2, fsh-r and nr3c1) at single nucleotide resolution and high coverage. We also measured cyp19a1a1 expression levels by qPCR. Most important of all, this study allowed the identification of CpGs spread in key sex-related genes the methylation of which is faithfully transmitted from parents to offspring, as well as the identification of CpGs most affected by temperature. Finally, we were able to develop the first, to our knowledge, system capable of predicting sex in a vertebrate based on the analysis of a carefully selected set of epigenetic marks.
Results
Genotyping and sex ratios
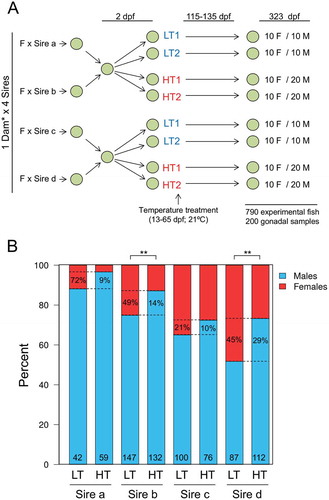
Four European sea bass sires (sires a-d) with different sex tendencies, known from previous experiments to produce more or less females in the offspring, were individually crossed with two dams (). During the thermosensitive period, from 13 to 65 dpf, half of the offspring was reared at low (16.5ºC) and the other half at high temperature (21ºC) in replicate treatments. From the end of this period and onwards, all fish were kept at 20–22ºC until sampling. In total we had 790 European sea bass sampled at ~ 11 months available for genotyping and sex ratio analysis. Genotyping unambiguously assigned 764 fish to the parents but showed that most (99%) offspring came from dam b, meaning that the rate of fertilization of the eggs of dam a was low, that the viability of the offspring of dam a was low, or both, something that is frequent in fish [Citation45–Citation51]. Thus, the few offspring of dam a were no longer considered and we only report results related to the four families derived from dam b. Considering only the offspring of one dam and increasing sample size allowed us in fact to unambiguously disentangle the sire-specific effects. Sex ratio analysis showed that the offspring of dam b crossed with sires a, b, c or d had different percentages of females: 11.9, 25.2, 35.0 and 48.3%, respectively ()). Thus, the progeny of sires a and b, previously shown to give less female offspring, had a lower percent of females than the progeny of sires c and d, previously shown to give more female offspring (Fisher’s exact test for count data; p < 0.0001). The sex ratios were independent of the replicate tank in which fish were raised (Figure S1) and those of the progeny of sires a, b and c significantly departed from the Fisherian sex ratio (Table S1). High temperature masculinized a subset of the females ()). This masculinization was similar to that observed in the internal control group of albino European sea bass, which were added in each tank (see Materials and Methods) in order to check that the observed effects were indeed due to the temperature treatments and not to spurious tank effects (Figure S2). Masculinization by high temperature was sire-dependent: 72, 49, 21 and 45% of the females were masculinized in the offspring of sires a–d, respectively (percent between the dotted lines inside the LT offspring; )) and the effect was significant in the progeny of sires b and d, but not in the progeny of sires a and c (Table S1). Therefore, these results clearly show sire-specific differences not only in sex ratios at control temperature but also in the degree of masculinization as a response to elevated temperature.
Figure 1. Experimental set-up and sex ratios of the offspring. (a) Experimental set-up of crossings and temperature treatments. Eggs were obtained from crossing sires known from previous trials to produce offspring with lower (sires a and b) or higher (sires c and d) percentage of females. The sires were crossed with two females, however the offspring of one dam only represented 0.9% of the total offspring and was thus excluded from further analysis. Two days post fertilization (dpf) eggs were mixed according to the male prone and female prone groups. On day 13, larvae from the two groups were divided into four with half of the fish being raised at low temperature (LT; 16.5ºC) and the other half at high temperature (HT; 21ºC) until 65 dpf, the end of the thermosensitive period. In each tank, an equal number of albino fish was added as a control for tank effects. Fish were sampled at one year of age (323 dpf) and gonad samples were taken from 10 females and 10 males for the LT groups and 10 females and 20 males from the HT groups from each tank. b) Paternal effects on European sea bass sex ratio and effects of elevated temperature. Percent of female (red) and male (blue) offspring of each sire (a, b, c and d) raised at low (LT) or high (HT) temperature. Absolute numbers of analyzed fish are shown in the bottom of each bar. The dotted lines indicate the differences of sex ratios between the LT and the HT offspring of each sire. The numbers between the dotted lines inside the LT bars indicate the percent of sex-reversed females among the LT females, while the numbers inside the HT bars indicate the percent of presumed neomales (sex-reversed females into males) among the HT males. The effects of temperature on sex ratios were assessed by Fisher’s exact test for count data and shown with the following equivalence: ** = p < 0.01.
As usual in European sea bass, females were bigger than males at the time of sampling, with small differences among the offspring of the different sires. Early exposure to temperature slightly increased growth in both sexes (Figure S3 and Table S2 for statistics).
DNA methylation levels of genes related to sexual development in the gametes of the parents and the gonads of the offspring
The overall DNA methylation profiles of the seven genes related to sexual development were gene-specific and showed a wide range of values (). The most extreme values were present in foxl2 (< 1%) and er-β2 (> 95%). Of the seven CpGs measured in the European sea bass cyp19a1a promoter, DNA methylation was essentially 100% in CpGs at positions −431 (Figure S4(a) and S5) and +60 (Figure S4(b) and S5) relative to the transcription start site (TSS) in all fish. Thus, these two CpGs were excluded from further analysis. Among the remaining five CpGs, CpG at position 9 showed a strong positive correlation with the rest of the CpGs at positions −56, −49, −33 and −13 (ρ = 0.77, p < 2.2e-16; Figure S4(c) and S5). Even stronger was the positive correlation of the CpGs at positions −56, −49, −33 and −13 (an example of the four possible combinations is shown in Figure S4(d) and all of them in Figure S5).
In the offspring gonads, and regardless of sire, sex and temperature significantly influenced DNA methylation of cyp19a1a (2-way ANOVA using robust M-estimators and 5000 bootstraps; sex: p = 0.027 and temperature: p = 0.025). Further, the interaction of both factors was also significant (Sex x Temperature: p = 0.018). DNA methylation of dmrt1 was also influenced by sex and temperature (2-way ANOVA; sex: p < 0.001 and temperature: p = 0.016). For cyp19a1a, higher DNA methylation levels were observed in females reared at high temperature, while in dmrt1, the inverse pattern was present, with lower DNA methylation in females reared at high temperature and even lower in males (). For the rest of the examined genes (foxl2, amh-r2, er-β2 and fsh-r), non-significant effects of sex and temperature were observed, except from a significant interaction of sex and temperature in nr3c1 (2-way ANOVA; p = 0.030; ). However, when individual sires were taken into account, with the exception of nr3c1, sire-specific tendencies of increase or decrease of DNA methylation according to sex and/or temperature were evident. For example, in cyp19a1a, in the offspring of sires b and c, there was higher DNA methylation in females reared at high temperature and in males, and the levels of DNA methylation were similar to the ones of the progeny of all sires combined. In the offspring of sire a, however, although the trends were the same, the actual DNA methylation levels were lower in the females reared at low temperature. On the contrary, in sire d, the opposite pattern was evident, with a tendency of lower DNA methylation in females reared at high temperature and in males. These results not only show that there are important differences in absolute methylation levels depending on the gene considered but also the existence of sex-specific differences in methylation levels for some genes, the existence of gene- and sex-specific responses to temperature and, finally, that there also are sire-specific differences. Together, they clearly illustrate that both the genetic and environmental contribution to DNA methylation of specific genes are important for sexual development in this fish.
Figure 2. DNA methylation levels of the genes examined in the parents and the offspring. In the left part of the figure, the DNA methylation in the oocytes of the dam (grey), the sperm of sire a (deep pink), b (violet), c (orange) and d (green blue) is shown. The central and right part of the figure illustrate the DNA methylation levels in the offspring, separately by each sire with the background color indicating the corresponding sire and also, in the offspring of the four sires combined. The offspring is divided in four groups according to sex and temperature experienced during early development and DNA methylation values are shown in the ovaries of low (yellow) and high (red) temperature females and in the testis of low (light blue) and high (blue) temperature males. The far-right data indicate p-values for the effects of sex (S), temperature (T) or their interaction (SxT). The absolute numbers of fish analyzed in each case are shown inside the bars. Data as mean ± SEM.
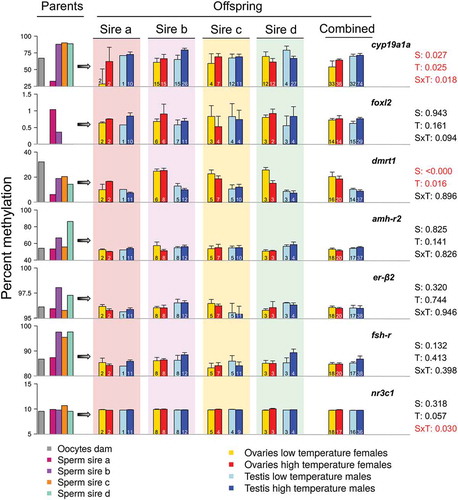
We also measured DNA methylation in the oocytes of dam b, the one from which all analyzed offspring were derived, as well as the sperm of the four sires. For five out of the seven analyzed genes (cyp19a1a, foxl2, amh-r2, er-β2 and fsh-r), DNA methylation in oocytes was lower than in sperm. In the case of dmrt1 it was the other way round: methylation in the oocytes was higher than in the sperm, whereas nr3c1 showed very stable methylation levels across parents, resembling the situation described above concerning the offspring. Focusing on the sperm, sire a departed from the rest in the sense that DNA methylation of some genes (cyp19a1a, dmrt1, fsh-r) was clearly lower when compared to values found in the other sires; for foxl2 sire a, in contrast, exhibited the highest DNA methylation levels. These results also show clear gene- and sire-specific differences in methylation but, in general, methylation in sperm was higher than in oocytes, although this should be taken with caution since only one dam was analyzed.
DNA methylation and gene expression relationships in cyp19a1a
Sufficient estrogen levels, resulting from aromatase enzyme activity, are essential for ovarian development in all egg-laying vertebrates. Thus, we examined the factors affecting cyp19a1a expression. The most influential factor on cyp19a1a expression was sex (F = 9.11, p = 0.003), with higher levels in females, followed by sire (F = 3.21, p = 0.025; and Figure S6) and with a significant interaction between them (F = 5.18, p = 0.002; ). However, the effect of temperature was not significant (F = 0.11, p = 0.741; ).
Table 1. Contribution of genetic (sire), epigenetic (promoter methylation), physiological (sex) and environmental (temperature) factors to the expression of cyp19a1a in the European sea bass.
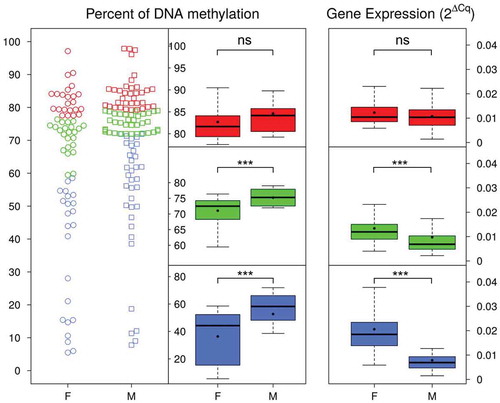
We also found a significant interaction between DNA methylation and sex on cypa19a1a expression (F = 10.34; p < 0.001; ). We further investigated this relationship and found that when the promoter of cypa19a1a was hypermethylated (~ 80% and above) in both sexes, there was no sex-dependent difference in neither mean methylation nor in expression of cypa19a1a (W = 286, p = 0.065 and W = 468, p = 0.304 respectively; , red data points). However, when there was intermediate methylation (, green data points) or hypomethylation (, blue data points) there was significantly more methylation in males than in females (W = 198, p = 0.00059 and W = 188, p = 0.00048 respectively), as well as significantly less expression in males than in females (W = 624, p = 0.00087 and W = 699, p = 4.717e−07 respectively). Thus, although in general the correlation between cypa19a1a promoter methylation and expression was weakly negative (Spearman’s rank correlation ρ = -0.023, p = 0.76) this inverse relationship holds well only below a certain methylation threshold. However, when we considered the sexes separately we found that this correlation was indeed negative for females but actually positive for males. Further, in both sexes correlation coefficients varied according to sire and temperature (), suggesting again the existence of genetic x environment interactions.
Figure 3. Expression of cyp19a1a in gonads of females and males with low, intermediate or high DNA methylation levels. In the left side, the distribution of DNA methylation values is shown by individual points for females (F) and males (M). Datapoints in blue (low), green (intermediate) and red (high) correspond to the first, second and third terciles of the distribution, respectively. The central boxplots represent low (blue), intermediate (green) and high (red) DNA methylation levels in females and males. The boxplots on the right side display the distribution of cyp19a1a expression depending on the level of DNA methylation in females and males. The boxes include the values distributed between the lower and upper quartiles, the upper whisker = min(max(x), Q3 + 1.5 * IQR), the lower whisker = max(min(x), Q1 – 1.5 * IQR), where IQR = third quartile (Q3) – first quartile (Q1). The black dots inside the boxplots indicate the mean and the line the median. Asterisks represent the level of significance of Wilcox rank sum test between females and males: ns = not significant; *** = p < 0.001. Notice the increase in inverse relationship between DNA methylation and gene expression with low methylation levels.
Stable and dynamic CpGs from parents to offspring
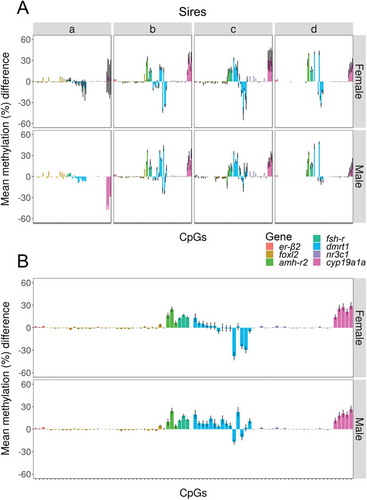
Next, to identify stable methylation patterns from parents to offspring, we calculated, for each gene, the methylation difference between levels in parents (specifically, the sperm of the different sires) minus levels in offspring for each analyzed CpG. To do this, we contemplated both sexes but we only used fish reared at low temperature to exclude possible environmental influences. Methylation differences close to zero were considered indicative of stable methylation levels, whereas differences above and below zero indicated hypomethylation and hypermethylation, respectively, in offspring vs. parents. Methylation differences depended on individual CpGs within a given gene, the sex and the sire (). However, regardless of sex and sire, the more stable levels of methylation were observed in the CpGs of er-β2, foxl2 and nr3c1 ()). These low differences were independent from the actual methylation levels in the sires, whether close to 0 or close to 100%, although there were no intermediate values to compare, suggesting that low difference values had not their origin in low or very low methylation levels. Thus, genes were grouped into two categories, stable (er-β2, foxl2 and nr3c1) or dynamic (cyp19a1a, dmrt1, fsh-r and amh-r2) independently of sex ().
Figure 4. Correlations of expression of cyp19a1a and mean DNA methylation of the five central CpGs of its promoter. Correlations between cypa19a1a expression and promoter DNA methylation are shown by Spearman’s rank correlation coefficient (ρ) in the gonads of female and male offspring of sires b, c and d reared at low (LT) or high temperature (HT). There was insufficient data for offspring of sire a. The direction of the long axis of the ellipses and the color indicate the type of correlation, with negative shown in shades of red and positive shown in blue. The short axis of the ellipse and the color intensity are proportional to the correlation coefficients.
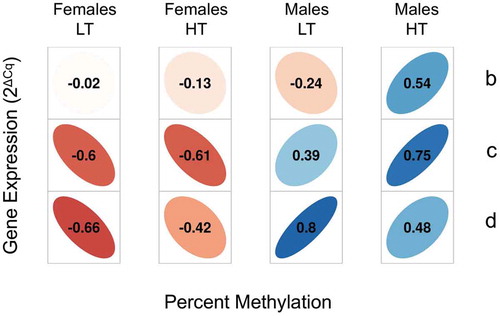
Figure 5. Methylation differences from sire to offspring in individual CpGs. Mean methylation difference in individual CpGs of the seven genes analyzed between the sperm and the gonads of their male and female offspring reared at low (control) temperature. Information is provided individually for sires a–d (a) and independently of sire (b). Data are shown as the mean of methylation differences of the corresponding sire to the individual fish in each group ± SEM.
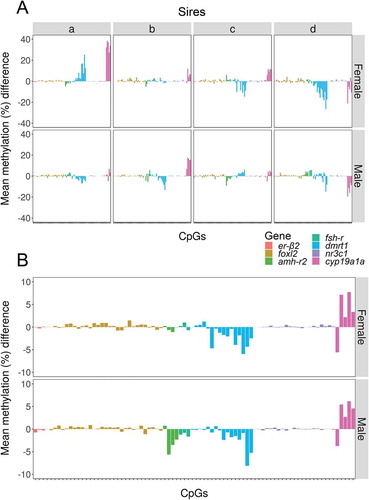
The same approach based on the analysis of differences was used to identify the CpGs most responsive to temperature. In this case, we searched for the CpGs with the highest methylation differences between fish exposed to HT vs LT. Again, changes were both gene- and sire-dependent (Figure 7(a)). Nevertheless, and regardless of sire and even sex, the methylation of CpGs of dmrt1 and cyp19a1a showed the biggest differences between offspring exposed to high and low temperature. Additionally, the CpGs of amh-r2 were responsive to temperature, but only in male offspring ()). As before, these temperature-dependent differences in methylation in specific CpGs were independent of the actual methylation levels (Figure S7).
Figure 6. Relationship of methylation in the sires and in the offspring. Scatterplot of the mean methylation differences per gene calculated as levels in the sires minus levels in their corresponding offspring reared at low temperature (female offspring: circles; male offspring: squares). Methylation differences close to zero indicate stable methylation levels, whereas differences above and below zero indicate hypomethylation and hypermethylation, respectively, in offspring vs. parents. The regression lines correspond to genes with low methylation differences between sires and offspring (foxl2, nr3c1 and er-β2) and genes with higher methylation differences between sires and offspring (cyp19a1a, dmrt1, fsh-r and amh-r2).
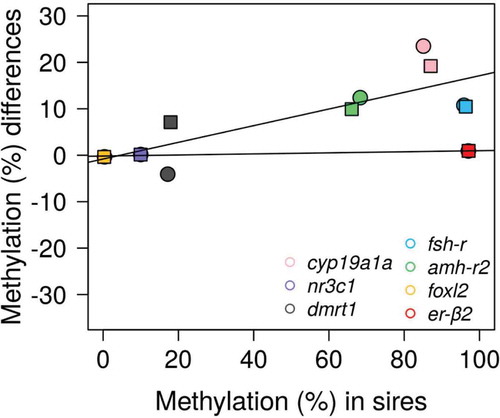
Figure 7. Methylation differences between high and low temperature in individual CpGs. Mean methylation difference in individual CpGs of the seven genes analyzed between the offspring reared at high vs. low temperature according to sex. Information is provided individually for sires a–d (a) and independently of sire (b). Data are shown as the difference of the mean methylation of individual fish reared at high temperature minus the mean methylation of individual fish reared at low temperature.
Prediction of phenotypic sex by analysis of epigenetic profiles: epigenetic biomarkers
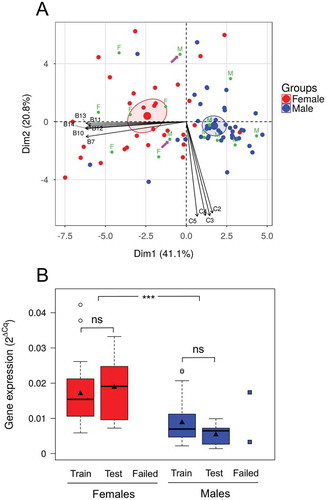
Based on the above, we hypothesized that the methylation of the CpGs of the genes most influenced by temperature in this species with mixed genetic and environmental sex determination might be indicative of the sex. Therefore, we performed Principal Component Analysis (PCA) with 5-fold cross validation with 87 fish which represented the offspring for which information on all these genes was available, using the CpGs (n = 23) of these genes as variables. The five independent validations gave similar results and one of them is shown as representative ()). The first two dimensions of the PCA explained 61.9% of the total variation and the 72 individuals of the training set were clearly separated according to their sex (blue and red dots, )). For the remaining 15 individuals (the test set), the sex was predicted using the information of the training set (green dots, )). Only for two male individuals (pink arrows, )) out of 15 in total, the sex was incorrectly predicted. The average success rate for this method of predicting sex, using 5-fold cross validation, based only on methylation information of the CpGs of these genes was 88.09%. To our knowledge, this constitutes the first prediction of phenotypic sex using methylation status in an animal. Confirmation of the prediction power of this method was evidenced by the lack of differences in cyp19a1a expression levels between fish of the test set vs. the training set in each sex. The levels of the two males wrongly classified coincided with the extremes of the distribution of cyp19a1a expression levels for males ()).
Figure 8. Prediction of offspring phenotypic sex using the methylation of selected CpGs as epigenetic biomarkers. (a) The DNA methylation levels of individual CpGs from the three genes that presented the highest differences between fish reared at low and at high temperature were the multiple variables used in the PCA. The individual fish are plotted as dots in the space of the two principal components. The percentage of variance explained by the two first components is shown in parenthesis. Of the total sample size available (n = 87), 83% (n = 72) were used as training set and are colored according to sex (female, red; male, blue) and 17% (n = 15) of the individual fish are colored in green for which the coordinates and hence the sex was predicted based on the training set (F, females; M, males). Confidence ellipses are drawn for the two groups and colored according to sex. The pink arrows point to the two predicted individuals for which prediction of sex failed. The names of the variables (Bn and Cn; n = 1, 2, …) correspond to the CpGs of informative genes. Of the total CpGs used for the PCA only the 10 with the highest contribution to the principal components are shown for clarity. (b) Distribution of the expression of cyp19a1a in females and males. Fish are divided in three groups based on the PCA analysis: training set, test set with success and test set with fail. The expression is shown by boxplots as 2ΔCq values for the first two groups and individual points for the third group. The boxes include the values distributed between the lower and upper quartiles, the upper whisker = min(max(x), Q3 + 1.5 * IQR), the lower whisker = max(min(x), Q1 – 1.5 * IQR), where IQR = third quartile (Q3) – first quartile (Q1), the black triangle indicates the mean, the tick line the median and the points outside the boxes represent values higher than the upper whisker. Statistical significance is shown as follows: ns = not significant; *** = p < 0.001.
Discussion
In this study, we show that the methylation levels of the promoters of one of the most important genes for male sexual development, dmrt1, and one of the most important genes for female sexual development, cyp19a1a, are affected by genetic background, sex and temperature in a fish with mixed genetic and environmental sex determination. As for cyp19a1a, understanding how its expression is regulated by DNA methylation is of relevance across vertebrates, and here we also show a negative association between cyp19a1a promoter methylation and expression levels in females, as expected, but, surprisingly, a positive association is seen in males. The individual CpGs of some of the studied gene promoters, namely er-β2, foxl2 and nr3c1, exhibit stable methylation levels between sperm and gonads at control temperature and regardless of sex, suggesting parent-to-offspring transmission of the methylation state. Lastly, we found that the methylation levels of the CpGs of the genes most responsive to temperature were sufficient to group the fish by sex and predict it with close to 90% accuracy.
For the specific needs of the study, we successfully developed and applied a low-cost version of targeted MBS to simultaneously interrogate the methylation status of several genes in a large sample size at single nucleotide resolution and with very high coverage. The objective was to study specific questions related to sexual development, therefore, a candidate gene approach was ideal. In addition, by targeting only 7 genes, we were able to identify CpGs sufficient for sex prediction; our approach was thus not only reasonable but also valid. In comparison with other similar approaches [Citation52,Citation53], we have considerably decreased the cost of the protocol by reducing to the minimum the use of proprietary kits at all steps and especially during size-selection and normalization by using the BeNUS protocol [Citation54] with home-made version of magnetic beads and 3D-printed magnetic stands. This renders our method an accessible approach to more researchers that aim to analyze a considerable amount of samples to address specific questions.
The sex ratio results of this study (), where European sea bass larvae were exposed to control or elevated temperature during early development, provide several insights worth mentioning. First, the eggs of the same dam, when separately fertilized with the sperm of four different sires produced offspring with different proportions of males. This disentangles the sire-specific effects on sex ratios and indicates inter-family variation [Citation30,Citation55]. Second, sires a and b, who produced more males in a previous cross with a different dam, also produced the highest proportion of males. Conversely, sires c and d previously gave the highest percent of females, and this was also the case in this study. Together, these results reflect the quantitative nature of the sex tendency in the European sea bass [Citation56]. Third, the response to high temperature was also family-dependent and with different proportions of sex-reversals, an observation that evidences the existence of genotype-environment interactions [Citation27]. In general 22–72% (average ~ 50%) of fish that would develop as females at low temperature, differentiated as males when exposed to elevated temperature, a standard figure for sea bass [Citation28]. Taken together, these observations confirm the polygenic nature of sex determination in the European sea bass [Citation17], where phenotypic sex emerges out of a combination of heritable and temperature influences [Citation29]. Within this framework, it is pertinent to ask how genetics and environment shape the methylation status of key genes related to sexual development. Here, to disentangle the genetic from the environmental effects on DNA methylation, we used 100–200 fish from the offspring of the 4 sires and the dam and bisulfite sequenced at 7 genes related to sex determination and differentiation, among them cyp19a1a for which gene expression was also measured.
Of the network of genes involved in vertebrate gonadal differentiation, cyp19a1a and dmrt1 exhibit a clear sex-dimorphic expression across a wide range of species including fish, with higher expression in ovaries and testis, respectively [Citation57–Citation60]. In accordance with this, when we compared the methylation of these genes in juvenile, sexually differentiated gonads, we found cyp19a1a hypomethylated in ovaries with respect to testis and dmrt1 hypomethylated in testis with respect to ovaries. These results are in accordance with results in other species where the methylation of these two genes has been measured [Citation34,Citation38,Citation43], and support the Conserved Sexual Development (CSD) model in fish, which is based on the assumption that there are 'pro-male' and 'pro-female' genes and that predicts that a given set of epigenetic marks and gene expression patterns are associated with the male or the female sexual phenotype [Citation37]. However, in contrast with past studies, ours is the first that takes into consideration genetic variation (), showing the clear existence of inter-family variation in methylation levels of some of the genes examined. It is known that genetic variation may influence epigenetic variation by the presence of single nucleotide polymorphisms (SNP), which may influence the methylation of CpG sites by acting in cis [Citation61,Citation62]. In this regard, the European sea bass cyp19a1a promoter exhibits three polymorphisms [Citation63], but we could not find any particular association with these polymorphisms and methylation levels in the present study. Apart from cyp19a1a and dmrt1, and, to a lesser extent, amh-r2, the rest of genes did not show clear sex-specific methylation levels and, further, did not either show a clear response to temperature.
Thus, there was variation in the methylation levels of cyp19a1a and dmrt1 dependent on the family and on the response to temperature. In particular, the female offspring of sire a had lower methylation levels for both genes than the female offspring derived from sires b-d. The overall methylation levels of cyp19a1a, i.e., lower in females than in males and increased, particularly in females, after exposure to elevated temperature confirm previous results in the European sea bass [Citation34]. However, with respect to our previous study, here we show that dmrt1 has exactly the opposite behavior of cyp19a1a, hence supporting the CSD model mentioned above [Citation37]. Besides, we show the importance of taking variation into account. Further, we show that other genes the expression of which may be dimorphic during sex differentiation – for example, foxl2 is more expressed in developing ovaries [Citation64] whereas amh-r2 is more expressed in developing testes [Citation65] – did not really show sex-specific differences in methylation. These findings suggest that either not all differences in expression are regulated via DNA methylation changes or that differences in expression regulated by the recruitment of transcription factors may precede the changes in DNA methylation, that in addition are very likely to occur in distal genomic elements, e.g., in enhancers [Citation66].
The relationship between cyp19a1a methylation and gene expression is of relevance to understand the epigenetic regulation of this important gene for vertebrate sexual development. In this study, we first found that such a relationship was seen only for methylation levels below ~ 80% (). This suggests the existence of an effective range of DNA methylation available for gene expression regulation that should be considered in future studies in this and probably also in other species. Second, whereas there was a clear inverse relationship between methylation and expression in females, surprisingly, this relationship was positive in males (). In juvenile testis, cyp19a1a is expressed at varying but in general low levels. Several recent studies have revealed that a positive correlation of DNA methylation with gene expression is present at the genome level [Citation61,Citation67]. Importantly, there are cis acting genetic loci associated with DNA methylation of CpGs, especially outside CpG islands, as well as with the expression of nearby genes in which positive correlation of DNA methylation and expression is evident [Citation68]. The positive correlation observed in males, therefore, could be resulting from the genetic component of the sex determination system. This would be the case of male-specific genetic variants in genomic proximity to cyp19a1a that influence the methylation and the expression of the gene. In any case, our results call for taking into account sex-dependent differences in the relation between DNA methylation and gene expression in future studies. Further, a recent study has shown that the first intron is the gene region that, along the promoter and the first exon is the most informative as regards to the inverse relationship between DNA methylation and gene expression, and that this applies across tissues and species [Citation69]. Thus, in future similar studies, the first intron should be considered.
We also examined the methylation levels of the target genes of this study in the oocytes and sperm of the progenitors. The aim of this was to identify possible relationships between the methylation of the gametes of the progenitors and that of the juvenile gonads. Given that the offspring of only one dam was taken into account for analysis, we were able to decipher the effects of the sires without confounding maternal effects. In zebrafish, global methylation levels of the sperm are higher (~ 91%) than those of the oocytes (~ 80%). Right after fertilization, global zygotic methylation is midway between sperm and oocyte levels, but by mid-blastula transition and gastrulation levels increase [Citation70,Citation71]. Global methylation levels in the adult muscle are also midway between sperm and oocyte [Citation71]. To our knowledge, there is no similar information for other fishes. Our data cannot be directly compared to that of zebrafish because rather than global levels we measured levels of seven genes at single nucleotide resolution in gametes and gonads. However, this approach provides some interesting insights. For example, in all examined genes except dmrt1, methylation levels of the sperm tended to be higher than those of oocytes, thus resembling the situation in zebrafish [Citation70,Citation71]. Also, methylation levels of the offspring tended to be similar compared to the dam and tended to be lower compared to the sires, although there were sire- and gene-specific tendencies. foxl2 showed a distinct profile, but this should be considered with care, since this gene always showed extreme hypomethylation (0–1%). Furthermore, nr3c1 was the only analyzed gene where methylation levels were essentially the same, around 10%, in sperm, oocytes and gonads, regardless of family and temperature conditions. Changes in the methylation status of nr3c1 have been associated with different illnesses in humans [Citation72] and in the European sea bass, nr3c1 expression in the liver is downregulated following exposure to stress [Citation73]. nr3c1 has different alternative promoters [Citation72] and the stable methylation levels of nr3c1 may indicate that epigenetic regulation is done in a different promoter than the one analyzed here, the one adjacent to the TSS.
Different CpGs from the same gene promoter may exhibit differences in methylation levels and in the response to environmental cues, changes that may affect gene expression [Citation74]. Consequently, we focused on the methylation differences of individual CpGs between sires and offspring ( and ) and between fish reared at high vs. low temperature (). We observed that stable methylation levels between sires and offspring (defined here as sire-offspring differences < 5%) of three genes, er-β2, foxl2 and nr3c1, were independent of actual methylation levels. We cannot exclude the possibility that this lack of differences in foxl2 and er-β2 is due to fixed hypo- (< 2%) or hyper- (> 95%) methylation, respectively, in these genomic regions. In nr3c1 though, the actual levels in all offspring were around 10%. In contrast, the rest of the examined genes, amh-r2, fsh-r, dmrt1 and cyp19a1a, showed differences of approximately ± 30% when individual CpGs were considered ()). It is interesting to note that methylation levels in male and female offspring of cyp19a1a, amh-r2, fsh-r and er-β2 were roughly similar to levels in the oocytes of the dam. On the other hand, methylation levels of dmrt1 in the offspring were similar to levels in sperm, but not oocytes, and, further, roughly matched levels of each corresponding sire. These findings are novel in the sense that, to our knowledge, no similar data is available for other vertebrates. Nevertheless, it seems that there are gene promoters in which CpG methylation is conserved, while in other genes the methylation varies, at least from sperm to gonads. It could be argued that stable CpGs constitute transmissible epigenetic marks but they also could be regarded as uninformative if it was confirmed in other species that they lack variation. However, they could also be regarded as a sort of ‘essential epigenetic marks’, as defined elsewhere [Citation37], with respect to dynamic CpGs, which when properly combined can help to predict phenotypic sex (see below). Also, in a recent study in the European sea bass we have shown that the sperm, in addition to its DNA, carries a complex population of chromatin-associated proteins [Citation75], providing further possibilities for the epigenetic transmission of information across generations.
The CpGs in the promoter of three genes, amh-r2, dmrt1 and cyp19a1a, not only showed the highest variation from sire to offspring at low temperature ()) but also were the most responsive to elevated temperature ()). The response of specific CpGs was sire-dependent but, at the same time, there was an overall pattern evident in the female and male offspring when all sires were combined ()). It is interesting to note differences in the methylation changes between different CpGs within the same gene promoter. This was evident in dmrt1 and cyp19a1a. Also, there was a sex-specific component in the case of amh-r2 especially, which responded to temperature in the males but not in the females.
In species without external sexual dimorphism and with late sex differentiation, the phenotypic sex of an individual remains unknown unless it is sacrificed. Being able to predict the sex of an undifferentiated individual based on epimarks is, therefore, of great interest. We selected the CpGs of these three genes, because they captured well both components of the sex determination system, the genetic and the environmental, since they showed variation between sires and they responded to temperature (). The combination of the CpGs which were more sensitive to temperature collectively contributed to a robust outcome variable that allowed prediction of phenotypic sex independently of sire and temperature (). Since DNA methylation levels are established during development and are stable throughout adulthood, the methylation of the panel of these CpGs is most likely to be established during the sex determination period. Identifying a defined panel of 23 CpGs located in only three genes that are enough for phenotypic sex prediction, especially before the period of sex differentiation, is of high importance for a species with a polygenic system of sex determination and without sex chromosomes, in which until now sex could only be identified after gonad formation. In addition, considering that the methylation levels of cyp19a1a and dmrt1 seem to follow the same pattern in unrelated species [Citation37], the same panel of CpGs from the corresponding gene regions might work to predict the sex of other species. Prediction of sex based on epigenetic marks has recently been achieved in the balsam poplar, Populus balsamifera [Citation76]. Thus, to the best of our knowledge, our study is the first to identify CpGs enabling the prediction of sex in an animal.
Epigenetically mediated responses of phenotypically plastic traits, such as sex, can be adaptive or maladaptive depending on the speed of environmental change. It has been suggested that these responses may have implications on population sex ratio in species responding to climate change, as well as for farmed species [Citation77,Citation78]. In sea bass aquaculture, male-biased stocks are often still present despite of thermal protocols applied to control sex. This could be due to an epigenetic maladaptive response or epigenetic trap leading to male-biased offspring of male-biased stocks. Thus, in a sort of ‘reproductive epigenetic programming’ applied to fish farming [Citation79], the identification of broodstock fish with a particular methylation profile holds promise because these animals may pass to their offspring specific DNA methylation marks. These epigenetically inherited DNA methylation profiles would provide offspring with desired features. For example, by conferring them resistance to the masculinizing effect of elevated temperature.
Conclusions
The changes in DNA methylation of the promoters of key genes related to sexual development in response to temperature are influenced by parents. There are CpGs with a stable parent-to-offspring pattern, suggestive of inheritance of epigenetic marks, although this aspect needs confirmation. Taking these into account, a complex epigenetic layer contributing to sex determination and differentiation is revealed, adding to the better understanding of the shaping of population sex ratios. The European sea bass is a vertebrate where a major plastic phenotypic trait, sex, is under the control of genetic and environmental influences with approximate equal strength of each. This study clearly illustrates how the epigenome integrates environmental information to the genome. It also shows variation in this epigenetic component and calls for further studies to gain a better picture of the interplay between these different regulatory components that bring, as Conrad Waddington said, ‘the phenotype into being’. Importantly, we came up with a combination of CpGs belonging to key genes for sexual development and sensitive to temperature that jointly contributed to an efficient prediction of phenotypic sex for the first time in an animal.
Materials and methods
Fish and general rearing conditions
Four West Mediterranean European sea bass sires (sires a–d) were selected based on their tendency to produce more or less females in the offspring, as assessed in two preliminary crossings. Thus, sire a had given 0% and 20.5% females (mean: 10.25%); sire b, 7.5 and 8.8% females (mean: 8.15); sire c, 25.0% and 43.2% females (mean: 34.1); and sire d, 25.9% and 58.6% females (mean: 42.25%). We crossed each sire with two randomly chosen West Mediterranean dams, thus producing 8 families. Cryopreserved sperm from the four sires and eggs from the two dams were kept for evaluation of the DNA methylation analysis. After fertilization, the batches corresponding to the four sires were incubated separately at ~ 14.5°C, then equalized in volume of floating eggs at 48 hours post fertilization and mixed in two groups, a ‘male-prone’ group, containing the offspring of sires a and b, and a ‘female-prone’ group, containing the offspring of sires c and d ()). A second crossing of eleven dams and twenty albino sea bass sires was done the same day of the experimental crossing. These fish were used as ‘spike-ins’ to control for possible tank effects on sex ratio (see below). All procedures performed were in accordance with the ethical standards of the institution and followed the European Directive 2010/63 UE. This study was conducted under the official national license of Dr. Marc Vandeputte (B34-437) in the premises of Ifremer in Palavas-les-Flots (France), registered as an authorized structure for animal experimentation (agreement C34-192–6). All fish handling procedures were conducted under anesthesia (40 ppm benzocaine) to minimize animal stress and suffering. Terminal sampling was performed after euthanasia by an overdose of benzocaine (150 ppm).
Temperature treatments
The hatched larvae from the male- and female-prone groups were split in two groups at the age of 13 days-post-fertilization (dpf). One group was reared at 16.5°C (low temperature, LT), the control group, and the other group at 20°C (high temperature, HT), the latter to induce environmentally-mediated masculinization. Thus, four combinations were available: male-prone (offspring from sires a and b) at LT, male-prone at HT, female-prone (offspring from sires c and d) at LT and female-prone at HT. Each combination was replicated in two experimental tanks, so that 8 tanks were used during this period ()). In each tank, an equal number of albino fish was also included, in order to be able to ascertain that the expected distorted sex ratios at HT were indeed due to the temperature treatments and also to identify any possible tank effect. Temperature treatments lasted until 65 dpf, the end of the thermosensitive period, at which point temperature was raised to 21°C to allow sufficient growth of the LT groups in order to facilitate sexing of the fish at the end of the experiment. From day 135 onwards, temperature was maintained at 20-22°C in all tanks until sampling.
Tagging and samplings
After anesthetic sedation by immersion in 40 ppm of benzocaine, fish were individually tagged with nano-tags (Nonatec) as soon as it was feasible, i.e., when they reached an average weight of ~ 1.5 g (85 dpf for HT and 105 dpf for LT) to follow their growth rate, which is highly linked to sex determination in the juvenile sea bass [Citation80].
At 323 dpf, fish were sedated in their rearing tank by adding a mild dose of anesthetic, captured and then euthanized with excess anesthesia. A total of 790 experimental and 868 albino fish were measured for body weight and length and were sexed by visual inspection, which allows unambiguous sex identification at this age. Gonad samples were preserved in liquid nitrogen for 200 fish in total: 10 females and 10 males from each one of the four LT tanks (80 fish) and 10 females and 20 males from each one of the four HT tanks (120 fish). The higher number of males was used to take into account for masculinized females in the HT groups. For a summary of the experimental design see ). All related data are available in Supplementary Data 1.
Genotyping
The 790 experimental fish were genotyped for 12 microsatellite markers by Labogena-DNA (Jouy-en-Josas, France). Seven hundred sixty eight of those (97.2%) gave adequate markers’ amplification, and 764 (96.7%) were traced back to a single parent pair, using VITASSIGN [Citation81] with 1 mismatch tolerated. It turned out that almost all fish were derived from only one dam, so the remaining fish from the second dam (only 9 in total) were not included in the analyzes, which then comprised 755 fish with known pedigree. The number of fish available for analysis of sex ratios from the LT groups was: 42 from sire a, 147 from sire b, 100 from sire c, and 87 from sire d. The number of fish available for analysis from the HT groups was: 59 from sire a, 132 from sire b, 76 from sire c, and 112 from sire d.
Quantitative real-time PCR (qRT-PCR)
RNA was extracted from the 200 fish gonad samples using the TRIzol® Reagent (ThermoFisher Scientific) according to manufacturer’s instructions after homogenization of the tissues using a pistil immersed in TRIzol® solution. RNA was quantified using a ND-100 spectrophotometer (NanoDrop Technologies). Five hundred nanograms of RNA were reverse transcribed into cDNA using the SuperScript III Reverse Transcriptase (ThermoFisher Scientific) and 100 μM of random hexamers (ThermoFisher Scientific). Primers for cytochrome p450 aromatase (cyp19a1a) were previously validated in sea bass [Citation34,Citation82], as well as primers for the two reference genes used, the elongation factor-1 (ef-1a) and the 40S ribosomal protein S30 [Citation83]. All primers targeted regions between two exons to avoid amplification of possible traces of genomic DNA. Primers efficiency was estimated using serial dilutions (1, 1:5, 1:10, 1:50, 1:100, 1:500) of a pool of 1 μl from each sample (200 μl in total) as E = 10(-Citation1/slope), with slope derived from the log-linear regression of the calibration curve. qRT-PCR reactions were carried out in triplicate including negative controls without cDNA in a total volume of 10 μl using the EvaGreen dye (Biotium) under the following conditions: 50ºC for 2 min, 95ºC for 10 min and 40 cycles of 95ºC for 15 s and 60ºC for 1 min. The specificity of the amplification was evaluated using melting curve with the following conditions: 95ºC for 15 s, 60ºC for 15 s and 95ºC for 15 s. qRT-PCR reactions were performed on an ABI 7900HT machine (Applied Biosystems).
Quantitative real-time PCR (qRT-PCR) data analysis
Cq values were exported from a multiple plate analysis, which included five 384-well plates using the RQ Manager 1.2.1 (Applied Biosystems). The mean Cq values and standard deviations (< 0.3) were calculated for each technical triplicate. Relative expression was calculated using the 2−ΔΔCq method [Citation84]. The geometric mean of the two reference genes was subtracted from the cyp19a1a Cq values to obtain the normalized dCq for statistical analysis. The efficiency of the cyp19a1a primers was estimated to be 2.15. All related data are available in Supplementary Data 2.
Multiplex bisulfite sequencing (MBS) library preparation and bioinformatics
Two separate MBS libraries were constructed: the first library (MBS1) contained cyp19a1a amplicons from 183 valid samples (out of 200 original ones) from the offspring gonads as well as the sperm samples of the four sires and the oocytes of the two dams. The second library (MBS2) contained amh-r2, dmrt1, er-β2, foxl2, fsh-r and nr3c1 amplicons in a representative subset of 94 samples and in the 5 parents. An average of 6 individual samples per sire, sex, and temperature treatment was ensured for all groups. For the HT males, the maximum available of 12 fish were included.
DNA extraction and bisulfite conversion
DNA was extracted by the standard phenol-chloroform-isoamyl alcohol (PCI; 25:24:1) protocol. Treatment with 1 μg of proteinase K (Sigma-Aldrich) and 0.5 μg of ribonuclease A (PureLink RNase A; Life Technologies) were used to eliminate the presence of proteins and RNA, respectively. For cryopreserved sperm samples, two PBS washings followed by a 1:5 dilution in PBS preceded the incubation with proteinase K. Five hundred nanograms of DNA per sample were bisulfite converted using the EZ DNA Methylation-Direct™ Kit (Zymo Research; D5023) in two batches of 96-well plates, following the manufacturer’s instructions with extended desulphonation time to 30 min. Elution of bisulfite converted DNA was performed with 20 μl of Milli-Q autoclaved H2O passing the same volume twice through the column by centrifugation.
Primers design
Primers were designed for bisulfite converted DNA using MethPrimer (Table S3 [Citation85]). Primers were further validated using Primer3Plus [Citation86] after in silico bisulfite conversion of the target sequence using Bisulfite Primer Seeker (Zymo Research). Amplicons were designed so that they never exceeded 550 bp in length in order to ascertain the acquisition of overlapping paired-end reads using the 300 bp paired-end Illumina sequencing protocol. An ideal amplicon’s range was considered between 450 and 500 bp encompassing as many CpGs as possible. The target regions included as much as possible from the first exon and the promoter, in this order of priority due to the importance of the first exon in the regulation of gene expression [Citation87], of each target gene. At this point it should be recalled that our own recent studies in the European sea bass show that not only the first exon but specially the first intron is very informative of the inverse relationship between DNA methylation and gene expression [Citation69], so the first intron should be considered in future similar studies. Adapters were added to the 5ʹ ends of the region-specific primers as in Illumina’s protocol for 16S metagenomic library preparation (Table S3). The target region of cyp19a1a included the 7 CpGs studied previously in sea bass [Citation34] at positions −431, −56, −49, −33, −13, 9 and 60 relative to the TSS, encompassing parts of the promoter, 5ʹ UTR and first exon.
Amplicons PCR
Amplifications of targeted regions were performed in a total volume of 25 μl containing: 25 ng of DNA (2 μl), 4 mM MgCl2, 0.8 mM dNTPs, primers at 0.8 μM (Life Technologies), 2.5 U of GoTaq G2 Hot Start polymerase (Promega) and its corresponding 5X Green GoTaq Flexi Buffer (Promega). PCR conditions were as follows: 7 min at 95ºC, followed by 40 cycles of 95ºC for 1 min, annealing temperature between 55 and 60ºC depending on each primer pair (Table S3) for 2 min and 65ºC for 2 min, with a final step at 65ºC for 10 min. The primers were validated by Sanger sequencing of amplicons from a pool of two samples. The presence and size of bands were confirmed by agarose gel electrophoresis in all samples.
Size-selection and normalization
After PCR amplification of the target regions, we performed size-selection (MBS1 and MBS2) and normalization of DNA quantities (MBS2) across PCR products following a customized version of the bead-based normalization of Hosomichi et al. [Citation54]. The working solution of serapure magnetic beads was prepared by washing 2 ml of Sera-mag SpeedBeads (Fisher 09981123) with Tris-EDTA (TE; 10 mM Tris; 1 mM EDTA) and adding the beads in a total volume of 50 ml containing 20% PEG-8000, a concentration of 2.5 M NaCl, 500 mM of Tris-HCl, 1 mM EDTA and 0.00055% Tween 20 (Adapted from: [Citation88]). In brief, 8 μl of PCR product and 42 μl of Milli-Q autoclaved H2O were incubated for 5 min at room temperature with 20 μl of beads. Following 2 min incubation on the magnetic stand (3D-printed 96-well magnetic rack designed by http://www.thingiverse.com/acadey/and realized by MAKE Creative Spaces), supernatants were transferred to new wells and incubated for 5 min with 0.8x of magnetic beads for MBS1 and with 0.6x of magnetic beads for MBS2. After discarding the supernatant, a single wash with 70% freshly prepared ethanol was performed and DNA was eluted in 20 μl Milli-Q autoclaved H2O. For MBS2, size-selected PCR products were incubated in equal volumes with 20-fold diluted magnetic beads (PEG 20% and 2.5 M NaCl) and isopropanol. After incubation for 5 min at room temperature and washing with 70% freshly prepared ethanol, PCR products were eluted in 20 μl Milli-Q autoclaved H2O. Since each amplicon contained theoretically equal DNA amounts, identical volumes of each amplicon were pooled for each biological sample, resulting in 99 wells containing 6 amplicons each.
Index PCR and size-selection
Sample-specific indices were incorporated into the amplicons following a dual-index strategy with i7 and i5 indices from Nextera XT index Kit SetA and SetD (Illumina; FC-131–2001 and FC-131–2004). For MBS1, the Nextera XT index Kit SetA for 94 samples and the Nextera XT index Kit SetD (Illumina; FC-131–2001 and FC-131–2004 accordingly) for 95 samples were used. For MBS2, a combination of indices from the same Nextera XT index kits was used. PCR reactions were performed using the 2x KAPA HiFi HotStart ReadyMix, 5 μl of each primer and 5 μl of template pooled amplicons DNA in a total volume of 50 μl with the following conditions: 95ºC for 3 min, 8 cycles of 95ºC for 30 s, 55ºC for 30s and 72ºC for 30s and a final step at 72ºC for 5 min, according to Illumina’s protocol for 16S metagenomic library preparation. Size-selection and normalization of DNA quantities across samples were carried out after the index PCR according to the customized bead-based normalization using 0.6x of magnetic beads. PCR products were eluted in 15 μl Milli-Q autoclaved H2O and 2 μl of each sample were pooled together. Therefore, we obtained a single multiplexed library with cyp19a1a for 189 samples and another single multiplexed library with 6 genes (amh-r2, dmrt1, er-β2, foxl2, fsh-r and nr3c1) for 99 samples. After pooling, extra clean-up steps were performed using 0.5x magnetic beads in order to ensure the absence of primers. DNA quantity of final libraries was measured trice by the Qubit dsDNA HS Assay Kit (ThermoFisher Scientific) and the Agilent DNA 1000 chip and DNA High Sensitivity (Agilent) by which the size of bands was also visualized. The multiplexed final libraries were additionally quantified by real-time qPCR using the Kapa system prior to sequencing on a MiSeq (Illumina) using the paired-end 300 bp protocol.
Multiplex bisulfite sequencing library bioinformatics
Samples were demultiplexed based on the dual-indices by the instrument’s software. Adapters and linker sequences were trimmed for paired-end reads by Trim Galore! (Babraham Bioinformatics), while filtering for low quality bases (Phred score < 20). Quality controls of the data were carried out before and after trimming using FastQC (Babraham Bioinformatics). Trimmed reads were aligned against the in silico bisulfite converted sea bass genome (dicLab1 v1.0c, Jul. 2012) [Citation89] using Bismark (v. 0.14.4) [Citation90] for both in silico bisulfite conversion and alignments. Mappings were done in three steps in a non-directional way: 1) paired reads were aligned, 2) unmapped reads from the first step were aligned as single reads, and 3) unpaired reads from the first step of trimming were aligned like the unmapped reads. An alignment was considered valid if the score attributed was above f(x) = 0 + −0.6 * read length. The alignments of unmapped (2) and unpaired (3) reads were merged using samtools (v. 1.5) and treated as single-end reads. Alignments were visually inspected using the Integrated Genome Browser [Citation91] and the genomic boundaries and amplicon sizes were confirmed. Methylation calling was performed by the bismark_methylation_extractor of Bismark separately for paired-end and for single-end reads. Paired and single reads were merged for each sample in a single file and the rest of the analysis were carried out using R, Rstudio [Citation92,Citation93] and Bioconductor [Citation94]. Only CpGs with coverage more than 5 were retained for further analysis. For each CpG per sample, counted cytosines and thymines were summed up from paired-end and single-end reads and percent of methylation was calculated as 100*(Cs/Cs+Ts). The bisulfite conversion ratio was calculated as 100 minus the percent of Cs methylated in CHH context from the report of Bismark for paired-end reads. The mean bisulfite conversion ratio was 99.55%. The libraries’ statistics can be found in Supplementary Data 2 and all related data are available in Supplementary Data 2.
General statistical analysis
All statistical analysis were performed using R [Citation92,Citation93]. The tank effect on resulting sex ratios was evaluated by Fisher’s exact test for count data. Departures from Fisherian sex ratios and effects of temperature on sex ratios were assessed by Fisher’s exact test for count data. The effects of sex, sire and temperature were evaluated on body weight, fork length and condition factor (K), the latter defined as K = 100*(W/L3.02), where W = weight in g and L = length in cm, of the offspring by multifactorial ANOVA for unbalanced data separately. The data were previously tested for homogeneity of variances by Levene’s test and the normality of the residuals of the linear regression was assessed by the Shapiro-Wilk normality test using log2-transformed values for body weight and fork length and sine-transformed values for condition factor (K). Methylation data was evaluated by 2-way ANOVAs and the normality of the residuals was tested by the Shapiro-Wilk test. In the cases where the assumption of normality of the residuals was violated, the values were logit-transformed. In the cases where the normality of residuals was violated even with transformed values, 2-way ANOVAs with modified M-estimators and 5000 bootstraps were performed.
Analysis of DNA methylation data
Mean DNA methylation levels
Association between DNA methylation levels of the CpGs was estimated using Pearson’s product-moment correlation coefficients. Mean DNA methylation levels were calculated by averaging the methylation percentages of each CpG per gene per sample and subsequently averaging the overall methylation per grouping factor depending on the comparison. For cyp19a1a, mean methylation levels were calculated using only the 5 central CpGs (−56, −49, −33, −13 and + 9) per sample because the two extreme CpGs (−431 and + 60) turned out to be always 100% methylated. Two-way ANOVA was used to assess the effects of sex and temperature on mean DNA methylation levels for each gene. The normality of the residuals was tested by the Shapiro-Wilk test. For three genes (er-β2, fsh-r and nr3c1), logit-transformed values were used for the two-way ANOVAs since the assumption of normality of the residuals was otherwise violated. In the case of cyp19a1a and amh-r2, we used two-way ANOVAs with modified M-estimators and 5000 bootstraps (function pbad2way of the WRS2 package v.0.9–2).
Transmission of DNA methylation patterns
Next, we focused on individual CpGs, which were 82 in total distributed in 7 genes, in order to investigate, on one hand, the possible transmission of the methylation status from sire to offspring, and, on the other hand, to identify the CpGs that were most responsive to temperature. To study sire-to-offspring transmission, only the offspring reared at low temperature was used to exclude the possible distorting effects of high temperature on methylation levels. For each CpG, the methylation in each offspring was subtracted from the methylation of the corresponding sire and the mean of these differences was calculated per sex and per sire. Thus, positive values indicate hypermethylation in sire and negative values indicate hypermethylation in offspring. The idea was to identify those CpG with the differences, positive or negative, as close as possible to zero. On the other hand, to study the effects of high temperature, for each CpG the mean methylation per sex and sire in offspring reared at low temperature was subtracted from the mean methylation in offspring reared at high temperature. In this case, positive values indicate hypermethylation at high temperature and negative values indicate hypermethylation at low temperature. Here, the idea was to identify those CpGs with the highest differences. The latter approach allowed us to identify the genes that exhibited the most dynamic changes with temperature.
Epigenetic biomarkers to predict sex
We used the 26 CpGs of the above genes in 93 fish. We filtered the data as follows: 1) we removed 6 samples for which there was no information on the methylation of 15 or more of the CpGs, and 2) we removed 3 CpGs for which there was no information in more than 12 fish. Therefore, for the rest of the analysis we used 23 CpGs in 87 fish. The rest of missing data were imputed by the MICE algorithm that generates multivariate imputations by chained equations using the mice package (v. 2.46.0) [Citation95]. We performed Principal Component Analysis (PCA) with 5-fold cross validation. The offspring was divided into 5 groups by the function createFolds of the caret package (v. 6.0–78). Each of the 5 groups was used as test set, the coordinates of which were predicted based on the PCAs performed on the remaining individuals (training sets). In this way, each fish was used as both training and test. The average success of the method was calculated based on the average percent of individuals for which the prediction failed. The results of the PCA and the predicted individuals were visualized using the package factoextra (v. 1.0.5).
Statistical analysis of DNA methylation and gene expression data for cyp19a1a
A multifactorial ANOVA was used to assess the effects of sex, sire, temperature and methylation levels, as well as their possible interactions, on the expression of cyp19a1a using log2-transformed 2ΔCq values. The sum of squares for ANOVA was calculated by the Type III approach since the design was unbalanced and interactions between factors were expected. The Shapiro-Wilk normality test was used to confirm normality of the residuals’ distribution. The methylation levels in this ANOVA model were integrated as categorical variables per sex, hypomethylation being the first 33.3% of the total distribution of values, intermediate methylation the values between 33.3% and 66.6% of the total distribution, and hypermethylation values above the 66.6% of the total distribution. Differences in cypa19a1a expression were tested using Wilcoxon signed rank test applying a continuity correction when needed on 2ΔCq values. Associations between DNA methylation levels and cypa19a1a expression were estimated using Spearman’s rank correlation coefficients. The offspring of sire a was excluded from the analysis of correlations since very few individuals were present.
Authors’ contributions
DA designed and carried out the MBS protocol, performed data analysis, interpreted results and wrote the article. MV and FA performed the temperature experiments and genotyping. MV conceived the study, provided reagents, interpreted results and revised the article. NSB constructed the MBS2 library and revised the article. FA interpreted results and revised the article; FP conceived the study, designed experiments, provided reagents, interpreted results and wrote the article. All authors read and approved the final manuscript.
Supplemental Material
Download Zip (1.7 MB)Acknowledgments
We thank Dr. Béatrice Chatain, Alain Vergnet, Marie-Odile Vidal and François Ruelle for contributing to raising the fish and help with the samplings; Sílvia Joly for performing the RNA extractions and qRT-PCR; Dr. Catherine Labbé and Alexandra Depince for help with the sperm DNA extraction protocol.
Disclosure statement
No potential conflict of interest was reported by the authors.
Supplementary material
Supplemental data for this article can be accessed here.
Additional information
Funding
Related Research Data
References
- Gilbert SF, Epel D. Ecological developmental biology: integrating epigenetics, medicine, and evolution. Sunderland, MA: Sinauer Associates; 2008.
- Skinner MK. Role of epigenetics in developmental biology and transgenerational inheritance. Birth Defects Res Part C. 2011;93:51–55.
- Piferrer F. Epigenetics of sex determination and gonadogenesis. Dev Dyn. 2013;242:360–370.
- Piferrer F, Ribas L, Díaz N. Genomic approaches to study genetic and environmental influences on fish sex determination and differentiation. Mar Biotechnol. 2012;14:591–604.
- Devlin RH, Nagahama Y. Sex determination and sex differentiation in fish: an overview of genetic, physiological, and environmental influences. Aquaculture. 2002;208:191–364.
- Duffy TA, Hice LA, Conover DO. Pattern and scale of geographic variation in environmental sex determination in the Atlantic silverside, Menidia menidia. Evolution. 2015;69:2187–2195.
- Valenzuela N, Lance V. Temperature-dependent sex determination in vertebrates. Washington, D.C: Smithsonian Books; 2004.
- Ospina-Álvarez N, Piferrer F. Temperature-dependent sex determination in fish revisited: prevalence, a single sex ratio response pattern, and possible effects of climate change. PLoS One. 2008;3:e2837.
- De Mitcheson YS, Liu M. Functional hermaphroditism in teleosts. Fish Fish. 2008;9:1–43.
- Baroiller J-F, D’Cotta H. The reversible sex of gonochoristic fish: insights and consequences. Sex Dev. 2016;10:242–266.
- Cortessis VK, Thomas DC, Levine AJ, et al. Environmental epigenetics: prospects for studying epigenetic mediation of exposure–response relationships. Hum Genet. 2012;131:1565.
- Heule C, Salzburger W, Bohne A. Genetics of sexual development: an evolutionary playground for fish. Genetics. 2014;196:579–591.
- Kondo M, Nanda I, Schmid M, et al. Sex determination and sex chromosome evolution: insights from medaka. Sex Dev. 2009;3:88–98.
- Nagai T, Takehana Y, Hamaguchi S, et al. Identification of the sex-determining locus in the Thai medaka, Oryzias minutillus. Cytogenet Genome Res. 2008;121:137–142.
- Ser JR, Roberts RB, Kocher TD. Multiple interacting loci control sex determination in lake Malawi cichlid fish. Evolution. 2010;64:486–501.
- Penman DJ, Piferrer F. Fish gonadogenesis. part I: genetic and environmental mechanisms of sex determination. Rev Fish Sci. 2008;16(S1):16–34.
- Vandeputte M, Dupont-Nivet M, Chavanne H, et al. A polygenic hypothesis for sex determination in the European sea bass Dicentrarchus labrax. Genetics. 2007;176:1049–1057.
- Sarre SD, Georges A, Quinn A. The ends of a continuum: genetic and temperature-dependent sex determination in reptiles. BioEssays. 2004;26:639–645.
- Quinn AE, Sarre SD, Ezaz T, et al. Evolutionary transitions between mechanisms of sex determination in vertebrates. Biol Lett. 2011;7:443–448.
- Lühmann LM, Knorr C, Hörstgen-Schwark G, et al. First evidence for family-specific QTL for temperature-dependent sex reversal in Nile tilapia (Oreochromis niloticus). Sex Dev. 2012;6:247–256.
- Yamamoto Y, Zhang Y, Sarida M, et al. Coexistence of genotypic and temperature-dependent sex determination in pejerrey Odontesthes bonariensis. PLoS One. 2014;9:e102574.
- Lance VA. Is regulation of aromatase expression in reptiles the key to understanding temperature-dependent sex determination? J Exp Zool Part A Ecol Genet Physiol. 2009;311A:314–322.
- Bull JJ. Evolution of sex determining mechanisms. Menlo Park, CA: Benjamin/Cummings Pub. Co.; 1983.
- Liew WC, Bartfai R, Lim Z, et al. Polygenic sex determination system in zebrafish. PLoS One. 2012;7:e34397.
- Ribas L, Liew WC, Díaz N, et al. Heat-induced masculinization in domesticated zebrafish is family-specific and yields a set of different gonadal transcriptomes. Proc Natl Acad Sci USA. 2017;114:E941–950.
- Palaiokostas C, Bekaert M, Taggart JB, et al. A new SNP-based vision of the genetics of sex determination in European sea bass (Dicentrarchus labrax). Genet Sel Evol. 2015;47:68.
- Saillant E, Fostier A, Haffray P, et al. Temperature effects and genotype-temperature interactions on sex determination in the European sea bass (Dicentrarchus labrax L.). J Exp Zool. 2002;292:494–505.
- Navarro-Martín L, Blázquez M, Viñas J, et al. Balancing the effects of rearing at low temperature during early development on sex ratios, growth and maturation in the European sea bass (Dicentrarchus labrax). Aquaculture. 2009;296:347–358.
- Piferrer F, Blázquez M, Navarro L, et al. Genetic, endocrine, and environmental components of sex determination and differentiation in the European sea bass (Dicentrarchus labrax L.). Gen Comp Endocrinol. 2005;142:102–110.
- Blázquez M, Navarro-Martín L, Piferrer F. Expression profiles of sex differentiation-related genes during ontogenesis in the European sea bass acclimated to two different temperatures. J Exp Zoolog B Mol Dev Evol. 2009;312B:686–700.
- Guiguen Y, Fostier A, Piferrer F, et al. Ovarian aromatase and estrogens: A pivotal role for gonadal sex differentiation and sex change in fish. Gen Comp Endocrinol. 2010;165:352–366.
- Piferrer F, Zanuy S, Carrillo M, et al. Brief treatment with an aromatase inhibitor during sex differentiation causes chromosomally female salmon to develop as normal, functional males. J Exp Zool. 1994;270:255–262.
- Capel B. Vertebrate sex determination: evolutionary plasticity of a fundamental switch. Nat Rev Genet. 2017;18:675–689.
- Navarro-Martín L, Viñas J, Ribas L, et al. DNA methylation of the gonadal aromatase (cyp19a) promoter is involved in temperature-dependent sex ratio shifts in the European sea bass. PLoS Genet. 2011;7:e1002447.
- Matsumoto Y, Buemio A, Chu R, et al. Epigenetic control of gonadal aromatase (cyp19a1) in temperature-dependent sex determination of red-eared slider turtles. PLoS One. 2013;8:e63599.
- Parrott BB, Kohno S, Cloy-McCoy JA, et al. Differential incubation temperatures result in dimorphic DNA methylation patterning of the SOX9 and aromatase promoters in gonads of alligator (Alligator mississippiensis) embryos. Biol Reprod. 2014;90:2, 1–11.
- Piferrer F. Epigenetics of sex determination and sex differentiation in fish. In: Wang H-P, Piferrer F, Chen S-L, editors. Sex control in aquaculture: theory and practice. Hoboken, NJ, USA: Wiley-Blackwell; 2018. p. 65–83.
- Wen AY, You F, Sun P, et al. CpG methylation of dmrt1 and cyp19a promoters in relation to their sexual dimorphic expression in the Japanese flounder Paralichthys olivaceus. J Fish Biol. 2014;84:193–205.
- Wan J, Oliver VF, Wang G, et al. Characterization of tissue-specific differential DNA methylation suggests distinct modes of positive and negative gene expression regulation. BMC Genomics. 2015;16:49.
- Anastasiadi D, Díaz N, Piferrer F. Small ocean temperature increases elicit stage-dependent changes in DNA methylation and gene expression in a fish, the European sea bass. Sci Rep. 2017;7:12401.
- Sun L-X, Wang -Y-Y, Zhao Y, et al. Global DNA methylation changes in Nile tilapia gonads during high temperature-induced masculinization. PLoS One. 2016;11:e0158483.
- Chen S, Zhang G, Shao C, et al. Whole-genome sequence of a flatfish provides insights into ZW sex chromosome evolution and adaptation to a benthic lifestyle. Nat Genet. 2014;46:253–260.
- Shao C, Li Q, Chen S, et al. Epigenetic modification and inheritance in sexual reversal of fish. Genome Res. 2014;24:604–615.
- Ziller MJ, Gu H, Müller F, et al. Charting a dynamic DNA methylation landscape of the human genome. Nature. 2013;500:477–481.
- Novel P, Porta JM, Porta J, et al. PCR multiplex tool with 10 microsatellites for the European seabass (Dicentrarchus labrax)—applications in genetic differentiation of populations and parental assignment. Aquaculture. 2010;308:S34–S38.
- Novel P, Porta J, Fernández J, et al. Critical points for the maintenance of genetic variability over a production cycle in the European sea bass, Dicentrarchus labrax. Aquaculture. 2013;416:8–14.
- Ma Q, Seyoum S, Tringali MD, et al. Evaluating spawning performance among captive Florida pompano Trachinotus carolinus broodstock using microsatellite-based parentage assignment. Aquac Res. 2017;48:5506–5516.
- Borrell YJ, Gallego V, García-Fernández C, et al. Assessment of parental contributions to fast-and slow-growing progenies in the sea bream Sparus aurata L. using a new multiplex PCR. Aquaculture. 2011;314:58–65.
- Rhody NR, Puchulutegui C, Taggart JB, et al. Parental contribution and spawning performance in captive common snook Centropomus undecimalis broodstock. Aquaculture. 2014;432:144–153.
- Petersen PE, Penman DJ, Dahle G, et al. Differential survival among batches of atlantic cod (Gadus morhua L). from fertilisation through to post-metamorphosis. PLoS One. 2016;11:e0158091.
- Borrell YJ, Alvarez J, Blanco G, et al. A parentage study using microsatellite loci in a pilot project for aquaculture of the European anchovy Engraulis encrasicolus L. Aquaculture. 2011;310:305–311.
- Bernstein DL, Kameswaran V, Le Lay JE, et al. The BisPCR2 method for targeted bisulfite sequencing. Epigenetics Chromatin. 2015;8:27.
- Venney CJ, Johansson ML, Heath DD. Inbreeding effects on gene-specific DNA methylation among tissues of Chinook salmon. Mol Ecol. 2016;25:4521–4533.
- Hosomichi K, Mitsunaga S, Nagasaki H, et al. A bead-based normalization for uniform sequencing depth (BeNUS) protocol for multi-samples sequencing exemplified by HLA-B. BMC Genomics. 2014;15:645.
- Mylonas CC, Anezaki L, Divanach P, et al. Influence of rearing temperature during the larval and nursery periods on growth and sex differentiation in two Mediterranean strains of Dicentrarchus labrax. J Fish Biol. 2005;67:652–668.
- Vandeputte M, Piferrer F. Genetic and environmental components of sex determination in the European sea bass (Dicentrarchus labrax). In: Wang H-P, Piferrer F, Chen S-L, editors. Sex control in aquaculture: theory and practice. Hoboken, NJ, USA: Wiley-Blackwell; 2018. p. 307–325.
- Deloffre LAM, Martins RST, Mylonas CC, et al. Alternative transcripts of DMRT1 in the European sea bass: expression during gonadal differentiation. Aquaculture. 2009;293:89–99.
- Piferrer F, Guiguen Y. Fish gonadogenesis. part II: molecular biology and genomics of sex differentiation. Rev Fish Sci. 2008;16(S1):35–55.
- Chen XW, Jiang S, Gu YF, et al. Molecular characterization and expression of cyp19a gene in Carassius auratus. J Fish Biol. 2014;85:516–522.
- Liu H, Mu X, Gui L, et al. Characterization and gonadal expression of FOXL2 relative to Cyp19a genes in spotted scat Scatophagus argus. Gene. 2015;561:6–14.
- Bell JT, Pai AA, Pickrell JK, et al. DNA methylation patterns associate with genetic and gene expression variation in HapMap cell lines. Genome Biol. 2011;12:R10.
- Teh AL, Pan H, Chen L, et al. The effect of genotype and in utero environment on interindividual variation in neonate DNA methylomes. Genome Res. 2014;24:1064–1074.
- Galay-Burgos M, Gealy C, Navarro-Martín L, et al. Cloning of the promoter from the gonadal aromatase gene of the European sea bass and identification of single nucleotide polymorphisms. Comp Biochem Physiol A Mol Integr Physiol. 2006;145A:47–53.
- Wang D-S, Kobayashi T, Zhou L-Y, et al. Foxl2 up-regulates aromatase gene transcription in a female-specific manner by binding to the promoter as well as interacting with ad4 binding protein/steroidogenic factor 1. Mol Endocrinol. 2007;21:712–725.
- Rocha A, Zanuy S, Gómez A. Conserved anti-müllerian hormone: anti-müllerian hormone type-2 receptor specific interaction and intracellular signaling in teleosts. Biol Reprod. 2016;94:141.
- Pacis A, Mailhot-Leonard F, Tailleux L, et al. Gene activation precedes DNA demethylation in response to infection in human dendritic cells. bioRxiv. 2018;358531. doi:10.1101/358531.
- van Eijk KR, de Jong S, Boks MP, et al. Genetic analysis of DNA methylation and gene expression levels in whole blood of healthy human subjects. BMC Genomics. 2012;13:636.
- Gibbs JR, van der Brug MP, Hernandez DG, et al. Abundant quantitative trait loci exist for DNA methylation and gene expression in human brain. PLoS Genet. 2010;6:e1000952.
- Anastasiadi D, Esteve-Codina A, Piferrer F. Consistent inverse correlation between DNA methylation of the first intron and gene expression across tissues and species. Epigenetics Chromatin. 2018;11:37.
- Jiang L, Zhang J, Wang -J-J, et al. Sperm, but not oocyte, DNA methylome is inherited by zebrafish early embryos. Cell. 2013;153:773–784.
- Potok ME, Nix DA, Parnell TJ, et al. Reprogramming the maternal zebrafish genome after fertilization to match the paternal methylation pattern. Cell. 2013;153:759–772.
- Argentieri MA, Nagarajan S, Seddighzadeh B, et al. Epigenetic pathways in human disease: the impact of DNA methylation on stress-related pathogenesis and current challenges in biomarker development. EBioMedicine. 2017;18:327–350.
- Terova G, Gornati R, Rimoldi S, et al. Quantification of a glucocorticoid receptor in sea bass (Dicentrarchus labrax L). reared at high stocking density. Gene. 2005;357:144–151.
- Ding Y, He F, Wen H, et al. Polymorphism in exons CpG rich regions of the cyp17-II gene affecting its mRNA expression and reproductive endocrine levels in female Japanese flounder (Paralichthys olivaceus). Gen Comp Endocrinol. 2012;179:107–114.
- Barrachina F, Anastasiadi D, Jodar M, et al. Identification of a complex population of chromatin-associated proteins in the European sea bass (Dicentrarchus labrax) sperm. Syst Biol Reprod Med. 2018;1–16.
- Bräutigam K, Soolanayakanahally R, Champigny M, et al. Sexual epigenetics: gender-specific methylation of a gene in the sex determining region of Populus balsamifera. Sci Rep. 2017;7:45388.
- Consuegra S, Rodríguez López CM. Epigenetic-induced alterations in sex-ratios in response to climate change: an epigenetic trap? BioEssays. 2016;38:950–958.
- Piferrer F. Altered sex ratios in response to climate change—who will fall into the (epigenetic) trap? (Comment on DOI 10.1002/bies.201600058). BioEssays. 2016;38:939.
- Moghadam H, Mørkøre T, Robinson N. Epigenetics—potential for programming fish for aquaculture? J Mar Sci Eng. 2015;3:175–192.
- Blázquez M, Carrillo M, Zanuy S, et al. Sex ratios in offspring of sex-reversed sea bass and the relationship between growth and phenotypic sex differentiation. J Fish Biol. 1999;55:916–930.
- Vandeputte M, Mauger S, Dupont-Nivet M. An evaluation of allowing for mismatches as a way to manage genotyping errors in parentage assignment by exclusion. Mol Ecol Notes. 2006;6:265–267.
- Díaz N, Piferrer F. Lasting effects of early exposure to temperature on the gonadal transcriptome at the time of sex differentiation in the European sea bass, a fish with mixed genetic and environmental sex determination. BMC Genomics. 2015;16:679.
- Mitter K, Kotoulas G, Magoulas A, et al. Evaluation of candidate reference genes for QPCR during ontogenesis and of immune-relevant tissues of European seabass (Dicentrarchus labrax). Comp Biochem Physiol B Biochem Mol Biol. 2009;153B:340–347.
- Livak KJ, Schmittgen TD. Analysis of relative gene expression data using real-time quantitative PCR and the 2(-Delta Delta C(T)) Method. Methods. 2001;25:402–408.
- Li L-C, Dahiya R. MethPrimer: designing primers for methylation PCRs. Bioinformatics. 2002;18:1427–1431.
- Untergasser A, Cutcutache I, Koressaar T, et al. Primer3—new capabilities and interfaces. Nucleic Acids Res. 2012;40:e115.
- Brenet F, Moh M, Funk P, et al. DNA methylation of the first exon is tightly linked to transcriptional silencing. PLoS One. 2011;6:e14524.
- Rohland N, Reich D. Cost-effective, high-throughput DNA sequencing libraries for multiplexed target capture. Genome Res. 2012;22:939–946.
- Tine M, Kuhl H, Gagnaire P-A, et al. European sea bass genome and its variation provide insights into adaptation to euryhalinity and speciation. Nat Commun. 2014;5:5770.
- Krueger F, Andrews SR. Bismark: a flexible aligner and methylation caller for Bisulfite-Seq applications. Bioinformatics. 2011;27:1571–1572.
- Nicol JW, Helt GA, Blanchard SG, et al. The Integrated Genome Browser: free software for distribution and exploration of genome-scale datasets. Bioinformatics. 2009;25:2730–2731.
- R Core Team. R: A language and environment for statistical computing. Vienna, Austria: R Foundation for Statistical Computing; 2015. Available from: https://www.R-project.org
- RStudio Team. RStudio: integrated Development Environment for R. Boston, MA: RStudio, Inc; 2015. Available from: http://www.rstudio.com/
- Huber W, Carey VJ, Gentleman R, et al. Orchestrating high-throughput genomic analysis with Bioconductor. Nat Methods. 2015;12:115–121.
- van Buuren S, Groothuis-Oudshoorn K. mice: multivariate Imputation by Chained Equations in R. J Stat Softw. 2011;45(3).