
 ?Mathematical formulae have been encoded as MathML and are displayed in this HTML version using MathJax in order to improve their display. Uncheck the box to turn MathJax off. This feature requires Javascript. Click on a formula to zoom.
ABSTRACT
Assessing DNA methylation profiles in human blood has become a major focus of epidemiologic inquiry. Understanding variability in CpG-specific DNA methylation over moderate periods of time is a critical first step in identifying CpG sites that are candidates for DNA methylation-based etiologic, diagnostic and prognostic predictors of pathogenesis. Using the Illumina MethylationEPIC [850K] BeadArray, DNA methylation was profiled in paired whole blood samples collected approximately 1 year apart from 35 healthy women enrolled in the Nurses Study II cohort. The median intraclass correlation coefficient (ICC) across all CpG loci was 0.19 [Interquartile Range (IQR) 0.00–0.50]; 74.8% of ICCs were in the low range (0–0.5), 16.9% in the mid-range of ICCs (0.5–0.8), and 8.3% in the high-range of ICCs (0.8–1). ICCs were similar for CpG probes on the 450K Illumina array (median 0.17) and the new probes added to the 850K array (median 0.21). ICCs for CpG loci on the sex chromosomes and known metastable epialleles were high (median 0.71, 0.97, respectively), and ICCs among methylation quantitative trait loci (mQTL) CpGs were significantly higher as compared to non-mQTL CpGs (median 0.73, 0.16, respectively, P < 2 × 10–16). We observed wide variation in DNA methylation stability over a 1-year period. Probes considered non-stable, due to substantial variation over a moderate period of time and with minimal variability across individuals could be removed in large epidemiological studies. Moreover, adjusting for technical variation that arises from using high-dimensional arrays is critical.
Introduction
Epigenetic mechanisms have long been known to alter gene regulation and coordinate variation in cellular and tissue phenotypes. Among the more intensively investigated epigenetic mechanisms is methylation of DNA at the 5-carbon position of cytosine [Citation1,Citation2]. This form of DNA methylation is well-known to be crucial in lineage specific differentiation during development; lineage-associated methylation marks are established in early embryogenesis and remain stable for a lifetime [Citation3,Citation4]. Invariant individual CpG site methylation marks the emergence of cellular lineage during development and these marks have been used to develop DNA methylation-based methods for assessing the relative leukocyte constituents in DNA from human peripheral blood [Citation5]. Alterations in the number and constituent subtypes of peripheral white blood cells (WBCs) as assessed by methylation are associated with a wide range of diseases. Notably, aberrant changes in DNA methylation in WBCs have been implicated in various pathologies that likely reflect both changes in the leukocyte profile (arising as a part of the normal immune response) and other alterations that may associate with the disease occurrence or progression. This has been investigated in autoimmune, cardiovascular, and neuro-psychiatric diseases as well as various cancers [Citation6–Citation10].
Assessing DNA methylation profiles in human blood has become a major focus of epidemiologic inquiry [Citation11,Citation12], particularly for research that is seeking to understand whether environmental exposures can impact changes in DNA methylation and if these changes are associated with disease risk [Citation11]. There have been several attempts to evaluate the sources of technical and biological variations in blood DNA methylation profiles [Citation13–Citation15]. Temporal stability and intra-individual variability has been previously investigated using the Illumina 450K platform; these studies demonstrate that DNA methylation levels are on average stable over short periods of time, although a large range of intraclass correlations (ICC) have been reported within individuals [Citation15–Citation17], and some authors have suggested that CpG sites with low ICCs should be excluded from analyzes of peripheral blood when examining long-term disease risk [Citation18]. The newest generation of the Illumina platforms, the MethylationEPIC [850K] BeadArray contains more than 90% of the 450K platform CpG sites, in addition to 333,265 CpGs located in gene enhancer regions [Citation19]. The MethylationEPIC array has, to our knowledge, not yet been tested to evaluate the variability of DNA methylation across all 850,000 CpGs (i.e., 445,000 new probes) at two time points in the same individuals.
Hence, to further characterize the nature of this variation, and examine the performance of new Illumina platform (MethylationEPIC array), we measured DNA methylation in WBCs at two time points over 1 year in postmenopausal women aged 53–66 years old.
Results
The mean age of the 35 women included in this pilot study was 60.8 years (range 53–66 years). Most women were non-smokers (68.6% never, 28.6% past, 2.8% current) and 34 were Caucasian and 1 African-American. The mean BMI of the women was 26.6 kg/m2 (SD ± 5.27), and all women were either postmenopausal or peri-menopausal. Characteristics of study participants are summarized in .
Table 1. Summary characteristics for 35 participants who contributed two blood samples over 1-year period.
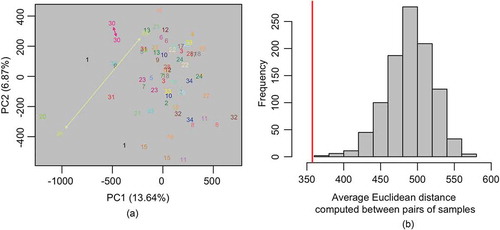
A total of 794,271 CpG sites were retained for analysis after removing poor quality, cross-reactive and SNP-associated probes. A principal component analysis (PCA) applied to normalized and ComBat adjusted methylation data revealed that DNA methylation profiles measured a year apart clustered tightly for most women, although there were exceptions where larger discrepancies were noted between the two time points (). To more formally evaluate whether epigenome-wide DNA methylation profiles were significantly more similar between samples collected from the same subject, we performed a permutation-based test that involved comparing the average within-subject Euclidean distance in DNA methylation profiles to the empirical null distribution of this statistic (). The results of this test showed statistically significant intra-individual similarity (permutation p < 0.001). In an attempt to understand the potential drivers of variability in a subject’s methylation profile between time points, we conducted an analysis examining the association between changes in a subject’s methylation profile and changes in the values of phenotypic variables across the two time points. As above, the similarity of a subject’s methylation signature between time points was quantified using Euclidean distance. Regressing the within-subject Euclidean distance estimates against changes in the values of phenotypic variables, including: smoking, alcohol, caffeine, season, menopausal status, hormone replacement therapy, antidepressants, NSAIDs, infections, antibiotic intake, steroid intake, asthma and allergy revealed no statistically significant associations, p > 0.05 (data not shown).
Figure 1. (a) Scatterplot of the first two principal components (PCs) estimated from the ComBat-adjusted β-values. Each point represents an individual sample, numbered according to the subject. Two subjects, 30 and 26, are indicated in the plot to illustrate examples of subjects with low/high relative within-person variation in DNA methylation between the two time points.(b) Empirical null distribution of the average Euclidean distance between pairs of samples. Red line denotes the average within-person Euclidean distance computed across each of the n = 35 subjects.
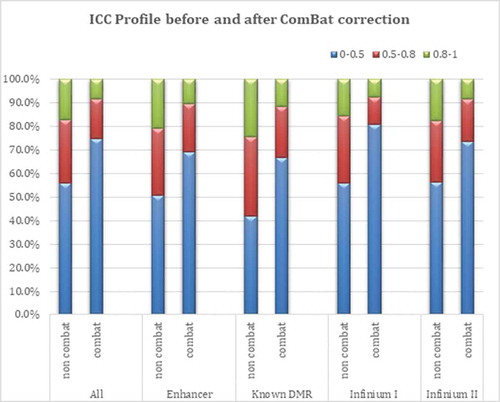
Across the 794,271 CpG loci, the within-person variation on the beta scale ranged from 4.71e-10 to 0.17, with a mean within-person variation of 0.0002. presents a summary of ICC estimates obtained when modeling β and M values across three different models: a crude model (not adjusted for any covariates), a model adjusted for cell type composition, and a model adjusted for cell type composition plus age. In addition, the results in are shown before and after correcting for intra-experimental variation in Illumina BeadChip data using the empirical Bayes batch-correction method (ComBat) [Citation20]. As expected, a considerable difference in ICC estimates was observed before and after ComBat correction; the values after adjustment were 55% smaller in non-sex and 15% smaller in sex chromosome associated CpG loci. The range of ICCs for non sex chromosomes, observed between and after ComBat adjustment, is depicted in (and in ). Infinium I probes were affected to a greater extent by the ComBat adjustment than Infinium II probes. As the distribution of ICC values differed between Infinium I and II probes, median ICC = 0.11 and 0.21 for Infinium I and II probes, respectively (), and because of the different design/chemistry of these two probe types, we applied Beta MIxture Quantile Dilation (BMIQ) [Citation21] using the function BMIQ in the wateRmelon Bioconductor package [Citation22] to assess the impact of probe type adjustment on the ICC landscape. While there was a slight attenuation in the median ICC for Infinium II probes, 0.21 (not BMIQ adjusted) versus 0.19 (BMIQ adjusted), the observation of higher overall ICC values among Infinium II relative to Infinium I probes was preserved (, Supplemental Table 1).
Table 2. Summary of Intraclass correlation coefficients of CpG locus methylation, for non-sex and sex chromosomes, in Beta and M scale.
Figure 2. ICC profile before and after batch effect (Combat) adjustment.
Detailed ICC results for non-sex chromosomes, modeling M values as the response (after ComBat correction), presented by gene region, location and probe type are presented in (the detailed ICC results without ComBat adjustment are presented in Supplemental Table 2). The median ICC across all CpG loci was 0.19 [IQR 0.00–0.50]; 74.8% of ICCs were in the low range (0–0.5), 16.9% in the mid-range of ICCs (0.5-< 0.8), and 8.3% in the high-range of ICCs (≥ 0.8). Restricting to probes that are also present on the 450K array (J = 400,355), our ICC estimates were strongly correlated (Pearson correlation = 0.652) with the ICC estimates reported in Shvetsov et al. [Citation17]. Further, CpGs unique to the EPIC array (not contained on 450K), showed slightly higher ICC as compared to CpGs that are also contained on the 450K array (median 0.21 vs 0.17, respectively). Among the low variability and mid variability loci (delta beta < 0.1 and 0.1< delta beta < 0.2 respectively), the percentage with ICCs in the mid and high-range were 22.1% and 99.4%, respectively. On the other hand, only 0.5% of the CpGs (n = 3,854) on non-sex chromosomes had delta beta> 0.2 (indicating a larger between-subject difference at any one CpG site that may indicate meaningful variations). Approximately 99.8% of the ICCs for these CpGs (n = 3,854) were above 0.5 (mid and high-range ICC) suggesting that methylation patterns at these CpGs are highly reproducible over time (). Known differentially methylated region (DMRs) (n = 36,323 CpGs) had higher ICCs than across the entire genome with median ICC of 0.31[IQR 0.06–0.61]. With respect to CpG location, CpG Islands had a median ICC of 0.1 [IQR 0.00–0.35], CpG Shores 0.25 [IQR 0.00–0.61] and CpG Shelves 0.2 [IQR 0.00–0.49]. Examining the ICC by mean beta value of the probe () demonstrates that probes exhibiting methylation levels around 50% (beta = 0.5) have the highest ICC, while those at the extremes had lower ICCs.
Table 3a. Summary of the ICCs of CpG locus methylation, M values, ComBat adjusted, non-sex chromosomes*.
Figure 3. ICC as a function of mean β-value.
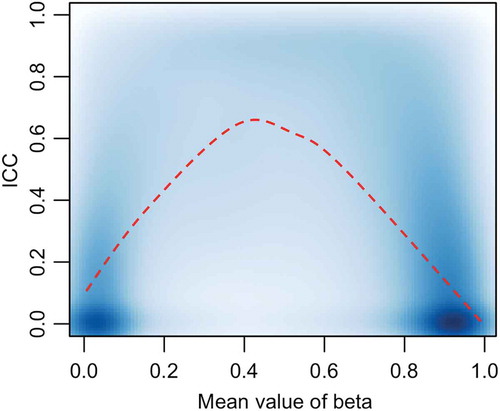
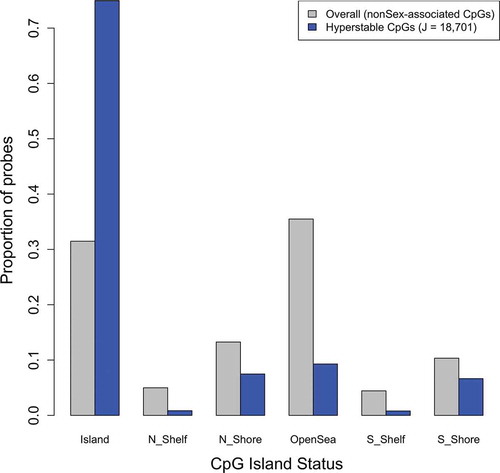
Figure 4. Distribution of hyper-stable probes by CpG Island status.
Regarding sex chromosomes, the overall ICC results for DNA methylation were notably different from that of non-sex chromosomes (; Supplemental Table 2). The median ICC across all CpG loci associated with the sex chromosomes was 0.71 [IQR 0.5–0.84]: 28.3% of them had low range of ICC (0–0.5), 37.3% mid-range of ICCs and 34.5% high-range of ICCs. Interestingly, ICCs in the mid- and high-variability regions were comparable to those of non-sex chromosome associated loci, although only 0.4% of all CpGs in sex chromosome (n = 76 CpGs) had delta beta> 0.2.
Table 3b. Summary of the intraclass correlation coefficients of CpG locus methylation, M values, ComBat adjusted, sex chromosomes*.
We examined the distribution of ICC values among known metastable epialleles and among CpGs previously identified as methylation quantitative trait loci (mQTLs) (see Methods for details on CpG selection). The median ICC among known metastable epialleles was 0.97, with a range from 0.70 to 1.00, whereas the median ICC for non-metastable epialleles was observed to be 0.20 with a range of 1.81e-17 to 1.0. In terms of mQTL CpGs, we first compared the mQTL CpGs reported in Gaunt et.al [Citation23] to the 794,271 CpG loci that withstood quality control processing and identified 34,721 overlapping mQTL CpGs in our data. As expected, the ICC values among mQTL was significantly larger as compared to non-mQTL loci (median ICC 0.73 and 0.16, for mQTL loci and non-mQTL loci, respectively, Wilcoxon rank sum P < 2 × 10–16).
To identify hyper-stable CpGs, we first computed the quartiles of the estimates of the between- and within-subject variance (Supplemental Table 3). Quartiles were computed over all non-sex chromosome loci on the EPIC array (J = 776,634) and among non-sex chromosome loci on the EPIC array that are also present on the 450K array (J = 400,355). Among non-sex chromosome loci on the EPIC array, the 25th percentile for between- and within-subject variance estimates (on the beta-scale) were 3.47E-12 and 4.41E-05, respectively. Estimates of the 25th percentile for between- and within-subject variance estimates among EPIC probes also located on the 450K array were similar, 1.39E-12 and 2.89E-05, respectively. There were a total of 93,684 hyper-stable CpGs on the EPIC array (e.g., both between- and within-subject variance estimates in the first quartile) (Supplemental Table 4) and 47,601 hyper-stable CpGs among those present on the 450K array (Supplemental Table 5). Examination of the overlap between the 34,721 mQTL loci and the 93,684 hyper-stable CpGs on EPIC array revealed only 573 CpGs, a statistically significantly smaller overlap that would be expected by random chance (permutation p < 0.0001). We next assessed the consistency of our hyper-stable CpGs with those identified using the data reported in Shvetsov et al. [Citation17]. Based on the data reported in Shvetsov et al. [Citation17], 47,013 hyper-stable CpGs were identified (Supplemental Table 6), of which 18,701 (40%) overlapped with the 47,601 hyper-stable CpGs identified in our data. A list of concordant CpGs between our data and the Shvetsov et al. [Citation17] data are provided in Supplemental Table 7. The number of overlapping, concordant CpGs between our data and the Shvetsov et al. [Citation17] data was significantly larger than would be expected by random-chance (randomization-based P < 0.0001). Further, among concordant hyper-stable CpGs (J = 18,701), we observed statistically significantly enrichment for CpGs located in CpG Islands (75% versus 31% among all non-Sex linked loci on the 450K array, P < 1E-16) ().
Supplemental Table 8 provides the pathways identified amongst CpGs exhibiting an ICC value greater than 0.9 and delta beta value less than 0.025 across all 34 individuals. Pathway analysis was performed based on the specific gene list (containing 226 genes); these identified highly stable pathways, many directly linked to HLA molecules. To discover pathways related to CpGs with high within-person variation, we selected the 2,000 CpGs with the smallest ICC values and used their corresponding target genes as pathway analysis input; Supplemental Table 9 presents the most frequently appearing significantly enriched pathways across the 34 participants after filtering for CpGs with a delta beta ≥ 0.2. As expected, these represent pathways that are likely to be highly fluid and frequently modified depending on physiological needs, such as signaling pathways and immune response activity.
Discussion
To our knowledge, this is the first study to investigate DNA methylation profiles from the same individual at two-time points using the MethylationEPIC [850K] BeadArray. As expected, our results show that some CpGs remain very stable over time, while others exhibit larger temporal changes or have low between-person variability. About 25% of all CpGs (n = 195,597) had ICC values greater than 0.5, demonstrating that a large number of CpGs on this platform can be used as reliable biomarker candidates for large-scale epidemiological studies with only one blood measurement. The majority (99.9%) of CpG sites in the non-sex chromosomes had similar methylation profiles between individuals (i.e, delta betas < 0.1).
The stability of CpG methylation appears to differ by functional locations, probe types, and methylation extent. CpG islands, the richest CpG regions, exhibited the lowest ICCs (median 0.10, 17% above 0.5), while CpG shores, with less dense CpGs, had slightly better ICCs (median 0.25, 32% above 0.5). Those loci that exhibited beta values around 0.5, likely representing regions with allele-specific methylation, such as imprinted regions, exhibited the most within person stability over time. As expected, it was noted that CpG loci within the known DMRs (where tissue specific lineage-defining regions are generally found), had better ICC profiles (median 0.31). CpG rich regions, such as CpG islands, are often the focus of functional epigenetic studies, due to DNA methylation alteration reported at these sites in cancer studies [Citation24,Citation25]. However, other studies suggest that the majority of phenotypically functional methylation sites are localized in CpG shores; due to large allocation of tissue-specific and cancer-related methylation patterns, CpG shores are now considered hot spots for DNA methylation studies [Citation26,Citation27]. Stratification of CpGs based on the updated Illumina array showed that the median ICC was higher in the new probes (median 0.21) than among CpGs that overlap between both arrays (median 0.17) and in the Infinium II probes (median 0.21).
Through normal aging, healthy individuals undergo increased DNA methylation in the CpG rich regions (i.e., CpG islands) [Citation28]. Monozygotic twin studies, as well as cross-sectional studies, have shown that age impacts methylation profiles [Citation29,Citation30]. Although, with age, DNA methylation increases in CpG enriched islands, overall DNA methylation in blood decreases with age, especially in non-islands regions [Citation31–Citation35]. In the present study, perhaps due to the modest time frame of one year, no major difference in ICCs was noted after adjusting for age.
Studies have established that there is important variation in the methylation profiles of whole blood in healthy individuals, in the context of cell type composition [Citation36,Citation37]. Cell specific DNA methylation often leads to challenges in interpreting the associations, requiring caution in the interpretation of whole blood methylation profiles (without cell composition adjustments). To minimize the potential confounding effects of immune cell type heterogeneity in this study, we adjusted for cell mixture distribution using known DMRs for cell types, as previously described [Citation5]. After adjusting for whole blood cell types through deconvolution, as expected, the ICCs were reduced due to the removal of the between-subject differences in immune cell types. It is important to note that this type of adjustment is conducted using major immune cell types; less common subtypes of immune cells, which can play an important role in pathophysiology, are not adjusted for, and may explain subtle differences in DNA methylation profiles between individuals. Consequently, CpGs with small delta betas (i.e., small differences between subjects) may provide valuable (disease relevant) data.
Four studies have investigated the temporal trend of DNA methylation using ICCs as a metric [Citation16,Citation17,Citation38]. Shvetsov et al [Citation17] investigated the intra-individual variation of DNA methylation of human blood taken nine months apart in 24 Chinese women. Methylation was measured using Illumina Human Methylation450K BeadChip. The median ICC reported was 0.36 across non sex chromosomes, almost double that of the present study. The median ICC was 0.80 on the X chromosome, which is comparable to the present study. Their reported ICC profile was similar among functional locations and probe type, while in the present study they differed from 0.09 to 0.18. Shvetsov et al [Citation17] did not adjust for batch effect using ComBat; our ComBat unadjusted ICCs are comparable to their results and similar patterns were observed for functional location, known DMR and probe type (). Although Shvetsov et al. used quantile normalization (QN) for correcting for batch effects, this method has been shown to be insufficient to reduce batch effects and maintain biological variability [Citation39]. Instead, functional normalization (FunNorm) was used in the present study in addition to ComBat correction. These methods expand on the limitations of QN by using control probes to remove unwanted technical variation [Citation40]. We evaluated the temporal change of DNA methylation measures with and without correction for batch effects, using both Beta and M values. The differences between ComBat and no ComBat adjusted ICC profiles were remarkable and in line with the literature [Citation41]. The ICCs for ComBat-adjusted values were lower than unadjusted, given that the between-person variation is reduced when extraneous error (i.e., technical error from batch effects) is removed. It is worthwhile noting that the percent of CpG probes with larger within-person than between-person variation in our study was comparable to the number from Shvetsov et al. [Citation17]; in both datasets, more than 50% of the CpG probes demonstrated greater within-person variation than between-person variation (data not shown). The large majority of these probes have very low variations in methylation levels overall, and thus, may be more easily influenced by technical errors. Finally, the incongruity of reliability values between the two studies could be partially attributed to genetic profile differences between Chinese and Western populations.
Stability of DNA methylation has been examined in a number of other studies. Forest et al [Citation15] investigated DNA methylation stability using samples from whole blood, blood spot and buccal tissue, collected at two time points (~ 1 year apart), and assessed by Illumina 450k methylation array. The percentage of loci with ICC > 0.7 in the whole blood (21.4%) was comparable with the present study, although ICCs decreased with time between sample collection. In a separate study, approximately 17% of the probes on the Illumina 450k methylation array had an ICC above 0.5 for whole blood samples collected 6 years apart [Citation16]. Finally, a third study investigated short-term temporal stability of DNA methylation in twelve gene-promoter regions and two non-long terminal repeat elements [Citation38]; similar to our findings, ICCs in CpG shores were higher than in CpG islands.
The assessment of ICCs for the known imprinted, metastable epialleles using the MethylationEPIC [850K] BeadArray confirmed that this array reproduces consistent results. The ICCs for the defined metastable alleles [Citation42] were close to 1, suggesting that our results are reproducible. Similarly, the results from the mQTL analysis confirmed that the ICCs of probes associated with mQTL are highly stable, as would be expected given that these CpG sites are associated with single nucleotide polymorphisms.
Based on the list of the pathways obtained from filtering the CpGs with the highest between-person variation and lowest methylation changes, the significantly stable molecules observed are mostly related with the major histocompatibility complex (MHC) type I. The constitutive pathways were mainly responsible for signaling of immune mediated pathways. This result is expected since HLA is stable across one individual and very different between individuals. All gene pathways identified when examining the least stable CpG sites were from signaling pathways, which are expected to have high intra-individual variations.
The strength of our study is that we investigated the most recent DNA methylation platform, the 850K MethylationEPIC array, and adjusted for biological (cell composition) and technical variations (plate variability). However, limitations include the fact that our study had a modest sample size and a relatively modest follow-up period. In addition, given that most women had similar exposures (e.g., smoking behavior) over the one year of study, we could not examine how changes in modifiable behaviors might impact methylation levels. Furthermore, this study was restricted to older females, which constrains its generalizability.
In conclusion, we showed that DNA methylation in different genomic loci have different degrees of reproducibility over one year. Our results also show that attention is needed to minimize technical errors that arise when using high-dimensional arrays; adjustment for batch effect and cell composition is important prior to conducting association studies. High ICC values (> 0.8) were observed for fewer than 10% of CpG sites, but adequate reproducibility was observed for 25% of all CpGs (ICC > 0.5). In addition, probes with low delta betas may have important biological relevance in defining specific cellular differentiation event and should be considered when ICCs are > 0.5. However, probes with low ICCs will likely have limited value for epidemiological studies examining DNA methylation associations with disease when using blood samples from one time point. Having information on which CpGs are stable (within an individual) and demonstrate sufficient between-person variation could be critical to reducing chance findings when conducting epidemiological studies with long-term follow-up for disease outcomes.
Materials and methods
Study population
Samples for this study were obtained from the Mind Body Study (MBS), a nested sub-study of women drawn from the Nurses’ Health Study II (NHSII) cohort [Citation43]. Details on selection of women into the MBS are published elsewhere [Citation44]. In brief, women in were eligible if they had provided two previous blood specimens (as part of the NHSII) and were willing to participate in a study that required multiple biospecimen collections (i.e., saliva, urine, stool, blood, hair, toenails) over one-year period, and a detailed psychosocial questionnaire at two time points. For this pilot study, we randomly selected 35 women (out of 215) who had provided two blood specimens for the MBS between 2013 and 2014. One of the study samples was excluded due to poor quality data, leaving 34 pairs and 35 individuals for the analysis.
Sample collection
Women provided fasting blood at MBS entry and one year post-baseline. Collection kits contained all necessary supplies to conduct the collection along with detailed instructions and shipping supplies/labels to return samples to our biorepository by overnight courier. Reminder emails were sent at 4 weeks, 8 weeks, and 10 weeks after kit delivery; continued non-responders were called at 12–14 weeks after kit delivery. Upon kit arrival, participants were asked to schedule a blood draw at a local doctor’s office or phlebotomy clinic; we referred people to appropriate websites to identify clinics near their location. Blood collection was conducted at a local clinic using four 10mL sodium heparin tubes and a butterfly needle. Each tube was inverted 10–12 times to prevent blood from clotting before placed into a padded pouch in a biohazard bag. A short questionnaire asked about date and time of sample collection, medication/hormone use, menopausal status, time since last eating, recent illnesses, weight/recent weight change, and assessment of blood pressure and heart rate. Samples, questionnaires and an ice pack were packed into a box with a biohazard sticker and shipped via overnight courier to our laboratory.
Upon receipt, kits were checked in to a laboratory information system. The blood was centrifuged for 20 minutes at 2500 RPM and 4 degrees C. Plasma, white blood cells, and red blood cells were aliquoted into labeled cryovials with screw-top lids and gaskets and stored in liquid nitrogen freezers.
Additional covariates
Weight was reported at biospecimen collection and height was reported on the 1989 baseline questionnaire, from which body mass index (BMI) was derived. Smoking in pack-years was derived using all questionnaires up to 2013.
DNA methylation
DNA extraction was conducted from buffy coats using QIAamp Blood Mini Kit (Qiagen Inc.). Bisulfite conversion was used to deaminate unmethylated cytosine to produce uracil in DNA; 1 ug of DNA was put through bisulfite conversion using EZ-96 DNA Methylation™ Kit (Shallow Well Format) (Zymo, D5003). The samples contained the converted DNA were used as the starting material in the Infinium quantitative assay. After fragmentation of the DNA, the samples were hybridized to 50-mer probes attached to the Infinium MethylationEPIC [850K] BeadArray, stopping one base before the interrogated base. Single base extension is then carried out to incorporate a labeled nucleotide. Dual color (Cy3 and Cy5) staining allows the nucleotide to be detected by the iSCAN reader and is converted to genotype during analysis with the GenomeStudio analysis software. A principle objective of our study was to understand within-person short-term variation in DNA methylation and because BeadChip is a well-recognized source of technical variation in DNA methylation array data [Citation45], we adopted an experimental design that aimed to curtail technical sources of variation, especially within-person variation, by placing samples from the same subject on the same BeadChip.
Methylation data preprocessing and quality control
Quality control (QC), preprocessing, and normalization of Illumina MethylationEPIC [850K] BeadArray methylation data was performed using the minfi bioconductor package [Citation46]. To ensure high-quality methylation data for downstream analyzes, functional normalization (e.g., Funnorm) [Citation40] was applied to normalize the between array technical variation based on internal control probes. Following application of the Funnorm, we identified and removed poor quality samples and probes. Samples were excluded if > 25% of their probes had detection p-values > 1 × 10⁻⁵ or if they exhibited irregularities in the distribution of their control probes [Citation47]. In addition, probes with a median detection p-value > 0.01 were identified and excluded from subsequent statistical analyzes, as were SNP-associated (reported SNPs at the queried CpG site and at the single-base extension (SBE) site) and cross-reactive CpGs [Citation48,Citation49]. Removal of SNP-associated and cross-reactive CpGs was carried out using the functions dropLociWithSnps and dropCrossReactiveProbes in the minfi Bioconductor package. Following probe exclusions, a total of 794,271 CpG sites were retained and used in downstream statistical analyzes. Cell composition was estimated using the estimateCellCounts function in the minfi Bioconductor package, which is based on previously published reference-based cell mixture deconvolution algorithm [Citation5]. After sample- and probe-level QC, the presence batch-effects and/or other technical sources of variation were inspected by first performing a principal components analysis (PCA) on the normalized methylation data, followed by an examination of the association between the top K principal components (K determined using random matrix theory [Citation45]) and plate, beadchip, and chip position. As we observed statistically significant association between beadchip and the first principal component (data not shown), we conducted batch-effect correction using ComBat [Citation20] (implemented using the ComBat() function in the sva Bioconductor package [Citation50]). ComBat was fit to methylation M-values (e.g., M = logit2(β-value)). The resulting ComBat-adjusted M-values were then back-transformed using the inverse-logit function to obtain ComBat-adjusted β-values.
Statistical analysis
To investigate whether epigenome-wide DNA methylation profiles were significantly more similar between temporal samples collected from the same subject, we performed a permutation-based test that involved comparing the average within-subject Euclidean distance to the empirical null distribution of this statistic. Euclidean distance was computed for each subject and was based on the first two principal components (e.g., PC1 and PC2) estimated from a PCA applied to the ComBat-adjusted β-values that remained after quality control removals. To generate the empirical null distribution of the average Euclidean distance between pairs of samples, subject labels were first permuted, followed by Euclidean distance calculation between each pair of samples based on the permuted labels. A total of 1,000 permutations were done. The permutation-based p-value was calculated as the probability of observing an average Euclidean distance as small, or smaller than what was observed between pairs of samples collected from the same subject. To study the relationship between phenotype and methylation changes within a subject, several phenotypic variables were used for association tests. Association tests were performed using a linear regression model that regressed the within-subject Euclidean distance estimates against differences in the values of specific phenotypic variables between the two time points. Euclidean distance was computed for each subject and was based on the first two principal components (e.g., PC1 and PC2) estimated from a PCA applied to the ComBat-adjusted β-values that remained after quality control removals. The phenotype value difference within subject was calculated by year one phenotype value minus baseline phenotype value.
For every CpG-locus, within-subject and between-subject variation was estimated by fitting a linear mixed model that modeled either the methylation M-value or β-value as the response (Yij), was adjusted for estimated cell composition (Uijk) [Citation5] and age (Xij), and included a subject-specific random intercept (Si). The model and intraclass correlation coefficient (ICC) were calculated as follows:
where i = 1,2…,35 is an index for subject, j = 1,2 is an index for sample within a subject, k = 1, 2…K is an index for cell type, represents the between-subject variation, and
represents the within-subject variation. A series of linear mixed effects models were fit and used to evaluate the influence of batch-effect adjustment (e.g., non-Combat-adjusted or Combat-adjusted), treatment of methylation data as the response (e.g., β-value or M-value modeled as response), and the inclusion of selected covariates (e.g., no adjustment, adjustment for cell composition only, adjustment for both cell composition and age) as fixed effects to adjust for potential sources of variation in blood-derived methylation signatures. In total, 12 separate models were fit independently to of the CpG sites withstanding quality control filtering.
As described in described in Shvetsov et al. [Citation17], when models were fit treating M-values as response, within- and between-subject standard errors on the β-scale were computed using the following calculations:
where and
represent estimates of the between- and within-subject standard deviations on the M-value scale. ICCs were examined according to specific characteristics of CpGs, including: genomic location, functional location, CpG Island status, probe type. The inter-individual difference in methylation at a specific CpG (Δβ) was taken to be the estimate of the between-subject standard deviation (e.g.,
or
) for that CpG.
To validate our results, the consistency of high ICCs of the known metastable epialleles was assessed. A total of 109 putative metastable epiallele regions [Citation42] were used to subset CpGs in the MethylationEPIC [850K] BeadArray. We identified 52 CpGs within the 109 genomic regions for putative metastable epialleles defined from Waterland RA et al [Citation42]. The ICC and estimated within-subject and between-subject variance are reported for the 52 metastable epiallele-associated CpGs. Additionally, as a positive control, we examined the distribution of ICC values among methylation quantitative trait loci (mQTL) CpGs as such loci would be expected to have high ICC values (high between-subject variance relative to within-subject variance). To do this, we focused our attention on the mQTLs identified in a recent publication [Citation23] as genotypic data was not readily available for the subjects in our study. We first compared the mQTL CpGs reported in [Citation23] to the 794,271 CpG loci that withstood quality control processing and identified 34,721 overlapping mQTL CpGs in our data. The distribution of ICC values between mQTL and non-mQTL loci were compared using a two-sample Wilcoxon-rank sum test.
We further sought to identify hyper-stable CpGs in our study, defined as CpGs with very low within- and between-subject variance. As multiplicity is a major analytical challenge faced by EWAS [Citation51–Citation53], the rationale for identifying hyper-stable CpGs is to provide the community with a list of low-varying CpG in blood (adjusted for cell composition). Knowledge of low-varying CpGs could be used for the purpose of pre-filtering in future studies involving methylation profiling in whole-blood samples, and in doing such, combat the burden of multiple testing characteristic of EWAS that use high density arrays for the assessment of DNA methylation. For this analysis we focused specifically on non-sex chromosome associated CpGs. Hyper-stable CpGs were defined as CpGs with between- and within-subject variance estimates in the lower quartile, computed over all non-sex chromosome associated CpGs that withstood quality control filtering. This analysis was done separately considering all of CpGs on the EPIC array and only those also contained on Illumina MethylationEPIC (450K) array. Similarly, we also identified hyper-stable CpGs based on the data reported Shvetsov et al. [Citation17] using the same criteria as outlined above. Hyper-stable CpGs identified in our data and in Shvetsov et al. [Citation17] were compared and used to identify concordant hyper-stable CpGs (e.g., CpGs exhibiting low within- and between-subject variation in both data sets). To determine whether the number of concordant hyper-stable CpGs was larger than would be expected by random-chance, a randomization based test was conducted wherein the empirical null distribution for the number of overlapping CpGs was generated by randomly sampling without replacement sets of CpGs of whose size was determined by the number of hyper-stable CpGs in our data and in data set reported in Shvetsov et al. [Citation17]. This process was repeated 10,000 times, and the randomization-based p-value was computed as the probability of observing the number of concordant hyper-stable CpGs (or larger) under the empirical null distribution.
Finally, to find CpGs with high and low within subject variation and their potentially related biological process, we conducted analysis as follows. We filtered CpGs with ICC > 0.9 and absolute value of beta difference < 0.025 across all 34 individuals. After these CpGs were obtained, we used their corresponding genes as input to identify canonical pathways that were significantly enriched with such genes (with p-value < 0.05). Pathway analysis was performed using Ingenuity Pathway Analysis software [Citation54]. In addition, we also filtered CpGs that exhibited a beta-value difference > 0.2 within each individual. For each individual, a gene list was generated and used for pathway analysis. To summarize pathways that related to high within subject variation CpG, we report the most frequent pathways observed across subjects.
Supplemental Material
Download MS Excel (67.8 MB)Acknowledgments
We would like to thank Dr. Shvetsov for sharing the raw data from his study [Citation17] to compare with our data.
Disclosure statement
No potential conflict of interest was reported by the authors.
Supplementary material
Supplemental data for this article can be accessed here
Additional information
Funding
Related Research Data
References
- Talbert PB, Henikoff S. Spreading of silent chromatin: inaction at a distance. Nat Reviews Genet. 2006;7(10):793–803.
- Li E. Chromatin modification and epigenetic reprogramming in mammalian development. Nat Reviews Genet. 2002;3(9):662–673.
- Richardson B, Yung R. Role of DNA methylation in the regulation of cell function. J Lab Clin Med. 1999;134(4):333–340.
- Dolinoy DC, Weidman JR, Jirtle RL. Epigenetic gene regulation: linking early developmental environment to adult disease. Reproductive Toxicology (Elmsford, NY). 2007;23(3):297–307.
- Houseman EA, Accomando WP, Koestler DC, et al. DNA methylation arrays as surrogate measures of cell mixture distribution. BMC Bioinformatics. 2012;13:86.
- Portela A, Esteller M. Epigenetic modifications and human disease. Nat Biotechnol. 2010;28(10):1057–1068.
- Kim M, Long TI, Arakawa K, et al. DNA methylation as a biomarker for cardiovascular disease risk. PloS One. 2010;5(3):e9692.
- Baccarelli A, Bollati V. Epigenetics and environmental chemicals. Curr Opin Pediatr. 2009;21(2):243–251.
- Bollati V, Galimberti D, Pergoli L, et al. DNA methylation in repetitive elements and Alzheimer disease. Brain Behav Immun. 2011;25(6):1078–1083.
- Zhu X, Liang J, Li F, et al. Analysis of associations between the patterns of global DNA hypomethylation and expression of DNA methyltransferase in patients with systemic lupus erythematosus. Int J Dermatol. 2011;50(6):697–704.
- Terry MB, Delgado-Cruzata L, Vin-Raviv N, et al. DNA methylation in white blood cells: association with risk factors in epidemiologic studies. Epigenetics. 2011;6(7):828–837.
- Feil R, Fraga MF. Epigenetics and the environment: emerging patterns and implications. Nat Reviews Genet. 2012;13(2):97–109.
- Michels KB, Binder AM. Considerations for design and analysis of DNA methylation studies. Methods in Molecular Biology (Clifton, NJ). 2018;1708:31–46.
- Sant KE, Nahar MS, Dolinoy DC. DNA methylation screening and analysis. Methods in Molecular Biology (Clifton, NJ). 2012;889:385–406.
- Forest M, O’Donnell KJ, Voisin G, et al. Agreement in DNA methylation levels from the Illumina 450K array across batches, tissues, and time. Epigenetics. 2018;13(1):19–32.
- Flanagan JM, Brook MN, Orr N, et al. Temporal stability and determinants of white blood cell DNA methylation in the breakthrough generations study. Cancer Epidemiology, Biomarkers & Prevention: a Publication of the American Association for Cancer Research, Cosponsored by the American Society of Preventive Oncology. 2015;24(1):221–229.
- Shvetsov YB, Song MA, Cai Q, et al. Intraindividual variation and short-term temporal trend in DNA methylation of human blood. Cancer Epidemiology, Biomarkers & Prevention: a Publication of the American Association for Cancer Research, Cosponsored by the American Society of Preventive Oncology. 2015;24(3):490–497.
- Bose M, Wu C, Pankow JS, et al. Evaluation of microarray-based DNA methylation measurement using technical replicates: the Atherosclerosis Risk In Communities (ARIC) Study. BMC Bioinformatics. 2014;15:312.
- Moran S, Arribas C, Esteller M. Validation of a DNA methylation microarray for 850,000 CpG sites of the human genome enriched in enhancer sequences. Epigenomics. 2016;8(3):389–399.
- Johnson WE, Li C, Rabinovic A. Adjusting batch effects in microarray expression data using empirical Bayes methods. Biostatistics (Oxford, England). 2007;8(1):118–127.
- Teschendorff AE, Marabita F, Lechner M, et al. A beta-mixture quantile normalization method for correcting probe design bias in Illumina Infinium 450 k DNA methylation data. Bioinformatics. 2013;29(2):189–196.
- Pidsley R, Yw CC, Volta M, et al. A data-driven approach to preprocessing Illumina 450K methylation array data. BMC Genomics. 2013;14:293.
- Gaunt TR, Shihab HA, Hemani G, et al. Systematic identification of genetic influences on methylation across the human life course. Genome Biol. 2016;17:61.
- Gardiner-Garden M, Frommer M. CpG islands in vertebrate genomes. J Mol Biol. 1987;196(2):261–282.
- Lechner M, Boshoff C, Beck S. Cancer epigenome. Adv Genet. 2010;70:247–276.
- Irizarry RA, Ladd-Acosta C, Wen B, et al. The human colon cancer methylome shows similar hypo- and hypermethylation at conserved tissue-specific CpG island shores. Nat Genet. 2009;41(2):178–186.
- Doi A, Park IH, Wen B, et al. Differential methylation of tissue- and cancer-specific CpG island shores distinguishes human induced pluripotent stem cells, embryonic stem cells and fibroblasts. Nat Genet. 2009;41(12):1350–1353.
- Issa JP, Ottaviano YL, Celano P, et al. Methylation of the oestrogen receptor CpG island links ageing and neoplasia in human colon. Nat Genet. 1994;7(4):536–540.
- Bell JT, Tsai PC, Yang TP, et al. Epigenome-wide scans identify differentially methylated regions for age and age-related phenotypes in a healthy ageing population. PLoS Genetics. 2012;8(4):e1002629.
- Johansson A, Enroth S, Gyllensten U. Continuous aging of the human DNA methylome throughout the human lifespan. PloS one. 2013;8(6):e67378.
- Rakyan VK, Down TA, Balding DJ, et al. Epigenome-wide association studies for common human diseases. Nat Reviews Genet. 2011;12(8):529–541.
- Heyn H, Li N, Ferreira HJ, et al. Distinct DNA methylomes of newborns and centenarians. Proc Natl Acad Sci U S A. 2012;109(26):10522–10527.
- Horvath S, Zhang Y, Langfelder P, et al. Aging effects on DNA methylation modules in human brain and blood tissue. Genome Biol. 2012;13(10):R97.
- Florath I, Butterbach K, Muller H, et al. Cross-sectional and longitudinal changes in DNA methylation with age: an epigenome-wide analysis revealing over 60 novel age-associated CpG sites. Hum Mol Genet. 2014;23(5):1186–1201.
- Weidner CI, Lin Q, Koch CM, et al. Aging of blood can be tracked by DNA methylation changes at just three CpG sites. Genome Biol. 2014;15(2):R24.
- Reinius LE, Acevedo N, Joerink M, et al. Differential DNA methylation in purified human blood cells: implications for cell lineage and studies on disease susceptibility. PloS one. 2012;7(7):e41361.
- Koestler DC, Marsit CJ, Christensen BC, et al. Peripheral blood immune cell methylation profiles are associated with nonhematopoietic cancers. Cancer Epidemiology, Biomarkers & Prevention: a Publication of the American Association for Cancer Research, Cosponsored by the American Society of Preventive Oncology. 2012;21(8):1293–1302.
- Byun HM, Nordio F, Coull BA, et al. Temporal stability of epigenetic markers: sequence characteristics and predictors of short-term DNA methylation variations. PloS one. 2012;7(6):e39220.
- Muller C, Schillert A, Rothemeier C, et al. Removing batch effects from longitudinal gene expression - quantile normalization plus combat as best approach for microarray transcriptome data. PloS one. 2016;11(6):e0156594.
- Fortin JP, Labbe A, Lemire M, et al. Functional normalization of 450k methylation array data improves replication in large cancer studies. Genome Biol. 2014;15(12):503.
- Dugué P-A, English DR, MacInnis RJ, et al. Reliability of DNA methylation measures from dried blood spots and mononuclear cells using the HumanMethylation450k BeadArray. Sci Rep. 2016;6:30317.
- Waterland RA, Kellermayer R, Laritsky E, et al. Season of conception in rural gambia affects DNA methylation at putative human metastable epialleles. PLoS Genetics. 2010;6(12):e1001252.
- Solomon CG, Willett WC, Carey VJ, et al. A prospective study of pregravid determinants of gestational diabetes mellitus. JAMA. 1997;278(13):1078–1083.
- Huang T, Poole EM, Vetter C, et al. Habitual sleep quality and diurnal rhythms of salivary cortisol and dehydroepiandrosterone in postmenopausal women. Psychoneuroendocrinology. 2017;84:172–180.
- Teschendorff AE, Zhuang J, Widschwendter M. Independent surrogate variable analysis to deconvolve confounding factors in large-scale microarray profiling studies. Bioinformatics. 2011;27(11):1496–1505.
- Aryee MJ, Jaffe AE, Corrada-Bravo H, et al. Minfi: a flexible and comprehensive Bioconductor package for the analysis of Infinium DNA methylation microarrays. Bioinformatics (Oxford, England). 2014;30(10):1363–1369.
- Wilhelm-Benartzi CS, Koestler DC, Karagas MR, et al. Review of processing and analysis methods for DNA methylation array data. Br J Cancer. 2013;109(6):1394–1402.
- Pidsley R, Zotenko E, Peters TJ, et al. Critical evaluation of the illumina methylationEPIC BeadChip microarray for whole-genome DNA methylation profiling. Genome Biol. 2016;17(1):208.
- Chen YA, Lemire M, Choufani S, et al. Discovery of cross-reactive probes and polymorphic CpGs in the illumina infinium HumanMethylation450 microarray. Epigenetics. 2013;8(2):203–209.
- Leek JT, Johnson WE, Parker HS, et al. The sva package for removing batch effects and other unwanted variation in high-throughput experiments. Bioinformatics (Oxford, England). 2012;28(6):882–883.
- Pe’er I, Yelensky R, Altshuler D, et al. Estimation of the multiple testing burden for genomewide association studies of nearly all common variants. Genet Epidemiol. 2008;32(4):381–385.
- Sobota RS, Shriner D, Kodaman N, et al. Addressing population-specific multiple testing burdens in genetic association studies. Ann Hum Genet. 2015;79(2):136–147.
- Pulit SL, de With SAJ, de Bakker PIW. Resetting the bar: Statistical significance in whole-genome sequencing-based association studies of global populations. Genet Epidemiol. 2017;41(2):145–151.
- Kramer A, Green J, Pollard J, Jr. et al. Causal analysis approaches in ingenuity pathway analysis. Bioinformatics (Oxford, England). 2014;30(4):523–530.