
 ?Mathematical formulae have been encoded as MathML and are displayed in this HTML version using MathJax in order to improve their display. Uncheck the box to turn MathJax off. This feature requires Javascript. Click on a formula to zoom.
ABSTRACT
The placenta is a vital fetal exchange organ connecting mother and baby. Specialised placental epithelial cells, called trophoblasts, are essential for adequate placental function. Trophoblasts transform the maternal vasculature to allow efficient blood flow to the placenta and facilitate adequate nutrient uptake. Placental development is in part regulated by epigenetic mechanisms. However, our understanding of how DNA methylation contributes to human trophoblast differentiation is limited. To better understand how genome-wide methylation differences affect trophoblast differentiation, reduced representation bisulfite sequencing (RRBS) was conducted on four matched sets of trophoblasts; side-population trophoblasts (a candidate human trophoblast stem cell population), cytotrophoblasts (an intermediate progenitor population), and extravillous trophoblasts (EVT, a terminally differentiated population) each isolated from the same first trimester placenta. Each trophoblast population had a distinct methylome. In line with their close differentiation relationship, the methylation profile of side-population trophoblasts was most similar to cytotrophoblasts, whilst EVT had the most distinct methylome. In comparison to mature trophoblast populations, side-population trophoblasts exhibited differential methylation of genes and miRNAs involved in cell cycle regulation, differentiation, and regulation of pluripotency. A combined methylomic and transcriptomic approach was taken to better understand cytotrophoblast differentiation to EVT. This revealed methylation of 41 genes involved in epithelial to mesenchymal transition and metastatic cancer pathways, which likely contributes to the acquisition of an invasive EVT phenotype. However, the methylation status of a gene did not always predict gene expression. Therefore, while CpG methylation plays a role in trophoblast differentiation, it is likely not the only regulatory mechanism involved in this process.
Introduction
The placenta is the first human organ to develop and forms the vital connection between the mother and fetus in utero. The placenta primarily functions as an exchange organ, allowing for nutrients, gases, and wastes to be transferred between the maternal and fetal circulations. The placenta is often described as the ‘tree of life’, in part due to its branching villous structure. Each placental villus is comprised of an outer bilayer of trophoblasts and an inner mesenchymal core containing fetal blood vessels (). Trophoblasts are the functional epithelial cells of the placenta of which there are three mature subtypes; cytotrophoblasts, extravillous trophoblasts (EVTs) and the syncytiotrophoblast. These mature trophoblast populations are thought to originate from a trophoblast stem cell (TSC) population () [Citation1]. The first differentiation step that human TSCs make is traditionally believed to be to villous cytotrophoblasts, a highly proliferative progenitor population that facilitates rapid early placental growth [Citation2]. Cytotrophoblasts can then either 1) fuse to form the outer multinucleated syncytiotrophoblast that transports nutrients and oxygen from the maternal blood, or 2) in the tips of anchoring villi, differentiate into EVTs that migrate away from the placenta and invade the decidualised maternal endometrium (decidua) () [Citation1]. In the decidua, EVTs transform the maternal spiral arteries eroding the smooth muscle of the vessel walls and dilating the arteries to ensure an increased amount of maternal blood can perfuse the placenta in an uninterrupted fashion ensuring maximal exchange.
Figure 1. (a) Schematic diagram of a first trimester human placental villus showing the three major mature trophoblast populations. Extravillous trophoblasts are shown invading into the decidua and remodelling a maternal spiral artery (b) Flow diagram showing the lineage differentiation pathway of trophectoderm derived trophoblast populations.
Impaired trophoblast differentiation is associated with pregnancy disorders such as fetal growth restriction (where babies are born pathologically small) and preeclampsia (when maternal blood pressure becomes dangerously elevated) [Citation3]. However, our understanding of how and why trophoblast differentiation is inadequate in these pregnancy disorders is poor. What we do know is that the pathophysiology of pregnancy disorders is established early in pregnancy [Citation3]. Thus, understanding the regulation of trophoblast differentiation in the first trimester is key to unlocking the underlying mechanisms of these disorders.
Studies in rodent models highlight the importance of DNA methylation in placental development. Inhibiting methylation in pregnant rats results in smaller placentae with anatomical abnormalities and altered ratios of trophoblast populations [Citation4]. Similar outcomes are observed in knockout models of DNA methyltransferases where embryonic lethality results from defective trophoblast differentiation [Citation5]. The impact of DNA methylation on trophoblast development begins at approximately day 5 post fertilization when the morula splits into the hypomethylated trophectoderm (that gives rise to the trophoblast populations of the placenta) and hypermethylated inner cell mass (that gives rise to the embryo proper) [Citation6]. Segregation of murine TSC from embryonic and extra-embryonic populations (e.g., embryonic stem cells (ESC) and extraembryonic endoderm XEN cells) is associated with distinct methylation signatures in key genes including caudal type homeobox 2 (Cdx2), eomesodermin (Eomes), E74 like ETS transcription factor 5 (Elf5), placenta expressed transcript 1 (Plet1) and transcription factor AP-2, gamma (Tcfap2c), and these methylation changes can be correlated with transcriptional changes between these lineages [Citation6–Citation8]. In contrast, the role of DNA methylation in regulating murine trophoblast differentiation has been explored far less [Citation9]. However, it is clear that while some genes (eg. Elf5 promoter hypomethylation) have similar levels of methylation between trophoblast subsets, differential gene methylation (eg. dimethylarginine dimethylaminohydrolase 2 (Ddah2) enhancer region) exists between the different murine trophoblast lineages [Citation8–Citation11]. While some transcriptional and regulatory differences exist between rodent and human trophoblast lineage segregation, significant anatomical differences exist in early murine and human trophoblast differentiation pathways, and our understanding of how methylation networks translate across species is incomplete.
Human trophoblast differentiation is associated with considerable gene expression changes [Citation12]. However, there is little understanding of how DNA methylation influences these transcriptional pathways as studies often focus on only a handful of genes or provide an overall picture of methylation data [Citation13–Citation16]. Until very recently, the lack of a human TSC population has limited our ability to understand the influences of DNA methylation on early trophoblast differentiation events. Recent advances employing a novel human TSC population, as well as other candidate trophoblast progenitor and stem cell populations may help shed light on the methylation events involved in early trophoblast differentiation [Citation16–Citation19]. Our laboratory works with a candidate TSC population termed side-population trophoblasts, which have some characteristic features of stem cells, both in their ability to rapidly efflux the DNA binding dye Hoechst 33,342 and at the level of the transcriptome [Citation19]. DNA methylation is known to play key roles in stem cell maintenance and promotion of lineage commitment. In particular DNA methylation helps regulate stem cell senescence, renewal, and differentiation [Citation20]. However, much of our understanding of this comes from stem cells that derive from the relatively hypermethylated inner cell mass of the embryo (eg. human embryonic stem cells, neuronal stem cells, mesenchymal stem cells), and it is unclear how they relate to TSC differentiation, which stems from the hypomethylated trophectoderm [Citation20]. In murine TSC hypomethylation of Elf5 and Plet1 promoters contribute to establishing the TSC state and allowing TSC self-renewal [Citation6]. Whether similar DNA methylation events influence human TSC function and differentiation is not yet known however it has been previously reported that that there is a degree of differential methylation between promoter regions of ELF5 between human cytotrophoblasts (3.4% methylated) and EVTs (9.1% methylated) [Citation13].
It is clear that DNA methylation differences exist between primary human trophoblast populations [Citation21]. These methylation changes are known to influence expression of genes involved in regulating; cell proliferation, the immune system, and cell invasion [Citation14,Citation15,Citation22]. Studies using trophoblast-like cell lines (JAr, Jeg-3, TEV-1, BeWo and HTR8/SVneo cells) also suggest that DNA hypermethylation downregulates tumor suppressor genes, whilst DNA hypomethylation allows upregulation of epithelial to mesenchymal transition (EMT) genes aiding acquisition of an invasive and migratory phenotype [Citation23]. However, DNA methylation has not been examined directly in uncultured trophoblasts and the impact of in vitro culture conditions on trophoblast DNA methylation are unclear. Therefore in this work we aimed to gain insights into the epigenetic landscape during early pregnancy by studying genome-wide methylation profiles in freshly isolated, first trimester trophoblast populations.
Methods
Isolation of trophoblast populations
Use of first trimester placental tissue in this study was approved by the Northern Regional Ethics Committee (NTX/12/06/057/AM04). Using a Becton Dickinson Aria II SORP, side-population trophoblasts ( = 97,899 cells/sample, n = 13), cytotrophoblasts (
= 201,029 cells/sample, n = 13) and EVTs (
= 110,427 cells/sample, n = 13) were isolated from human first trimester placentae of 5.6–12.2 weeks of gestation as previously described (Supplementary Table 1) [Citation19]. Live cell populations were sorted directly into 200 µL of sterile PBS in 2 mL RNAse-free Eppendorf tubes for DNA extraction (n = 4 placentae), or into 200 µL of RNA Later® (Cat no. AM7021, Ambion) for RNA (n = 5 placentae) or miRNA (n = 4 placentae) extraction.
Table 1. Table of sequenom massARRAY primers.
DNA extraction
Sorted cells were centrifuged at 450 g for 30 minutes at 4ºC. The supernatant was removed, and cells were resuspended in 200 µL of sterile PBS to which 20 µL of Qiagen Proteinase K was added. A 200 µL volume of AL buffer from a Qiagen QIAAMP DNA Mini Kit (Cat no. 51304, Qiagen) was added, and samples were incubated overnight at 56ºC. The next day, DNA was extracted using a Qiagen QIAAMP DNA Mini Kit as per the manufacturer’s instructions. The DNA was eluted into 200 µL of Qiagen DNA Mini Kit AE buffer and stored at −20ºC. At the time of DNA extraction, DNA quantity was assessed using the Qubit® dsDNA HS Assay Kit (Cat no. Q32851, Molecular Probes) or Qubit® dsDNA BR Assay Kit (Cat no. Q32850, Molecular Probes).
Reduced representation bisulfite sequencing preparation and analysis
DNA extracted from matched sets (from the same placenta) of side-population trophoblasts, cytotrophoblasts and EVTs were sent to New Zealand Genomics Limited to undergo reduced representation bisulfite sequencing (RRBS). All samples were prepared and sequenced at the same time in order to mitigate batch effects and RRBS libraries were prepared following previously published protocols [Citation24]. Briefly, 500 ng of DNA was digested overnight using Msp1 enzyme (Cat no. R0106S, New England Biolabs). DNA fragments then underwent end-repair and ‘A’-tailing at the 3ʹ ends. Methylated adaptors were ligated and DNA was purified using MinElute PCR purification kit (Cat no. 28006, Qiagen). Samples were eluted into 20 µL TE. Samples then underwent bisulfite conversion using the EZ DNA Methylation Kit (Cat no. D5001, Zymo Research) following the manufacturer’s protocol, followed by PCR amplification with Pfu Turbo Cx Hotstart DNA polymerase (Cat no. 600410, Agilent Technologies). The products were run on a 3% (w/v) NuSieve agarose gel and appropriate sized (150–325 bp) fragments were selected. DNA libraries were purified using the MinElute Gel Extraction Kit (Cat no. 28006, Quiagen) according to the manufacturer’s instructions. DNA quantity was assessed using a Qubit fluorimeter (Life Technologies). High sensitivity DNA chips run on a 2100 Bioanalyser (Agilent Technologies) were used to determine average fragment size. The RRBS libraries underwent single-end (100 bp) sequencing using the Illumina HiSeq2000 platform.
In total 12 libraries were prepared. Following ‘Processing RRBS samples: a User Guide’ by Peter Stockwell [Citation25], data files were trimmed and cleaned. FastQC reports of each cleaned data file determined they were acceptable for downstream applications. Bismark was then used to map the files to the Homo sapiens GRCh37 reference genome. On average across the 12 samples investigated by RRBS, 17,850,057 reads (±948,819 reads SEM) were obtained, 10,688,624 reads (±563413SEM) were aligned, the depth of coverage was 6.23 reads (±0.41 reads SEM), the proportion of C methylated in a CpG context was 30.62% (±0.605% SEM), and the samples had a bisulfite non-conversion rate of 1.28% (±0.05% SEM). The data was analysed using the R package ‘methylKit’ to determine the methylation at individual CpG sites (Supplementary tables 2–) [Citation26]. P-values were generated using logistic regression and a q-value cut-off of <0.01, and percentage methylation difference of >25% was employed by methylKit to identify differential methylation events. Gene enrichment analysis was undertaken using the GATHER pathway analysis online tool. These data have been deposited in the Gene Expression Omnibus (GEO) database with accession number GSE109682.
Table 2. Table of microRNA primers.
Table 3. Summary table of differential methylation between trophoblast populations.
Table 4. Table of differentially methylated genes regulating a stem cell phenotype and/or cell cycle regulation and proliferation in side-population compared to cytotrophoblasts or extravillous trophoblasts.
Sequenom MassARRAY EpiTYPER analysis
In order to interrogate CpGs of interest, primers specific to corresponding genomic regions were designed using the EpiDesigner (Agena Bioscience) online tool. The primers were then validated using the ‘MassArray’ R package (Thompson and Greally 2009) and NCBI BLAT tool. The selected primers () (HPLC grade, Integrated DNA technologies, Inc.) were then used to amplify the regions of interest from the bisulfite converted DNA using the EpiTYPER® Reagent and Chip Set reagents. The bisulfite conversion was performed with an EZ DNA methylation kit using 200 ng of DNA from each sample (12 trophoblast samples, as well as 0% and 100% methylation controls (Cat no. D5014, Zymo Research)). Water was included as a negative control. 1 µL of each PCR product was run on a 1.5% Agarose gel to ensure successful amplification of the target regions. The successful PCR reactions were sent to Grafton Clinical Genomics (GCG), University of Auckland, for processing and analysis. At GCG, the PCR products were subjected to SAP treatment and T7 conversion, followed by spot firing and Quantitative DNA Methylation Analysis using the EpiTYPER software (Agena Bioscience). Mean methylation was calculated for the each CpG of interest identified in the RRBS data set. Statistical analysis was conducted using GraphPad Prism v7.03 using a one-way ANOVA and Bonferroni post-test correction.
miRNA extraction and quantification
RNA was extracted using a mirVana™ miRNA Isolation Kit (Cat no. 4464066, Ambion) and eluted into 100 µL of nuclease-free water. cDNA was generated using a qScript™ microRNA cDNA Synthesis Kit (Cat no. 95107–100, Quanta Biosciences™) and real-time PCR was conducted using a Quanta PerfeCTa SYBR Fastmix Low ROX mix (Cat no. 95074–250, Quanta Biosciences™) and run on Applied Biosystems Quant Studio K12 Flex as per the manufacturer’s instructions using the primers listed in . Gene expression was normalised to the geometric mean of three stably expressed miRNAs (miR525-3p, miR103a-3p and miR21-5p) using the ΔΔCT method [Citation27].
Transcriptomic comparison of cytotrophoblasts and EVT gene expression
RNA was extracted using an Invitrogen PureLink Mini-Kit (Cat no. 12183018A, Life Technologies) according to the manufacturer’s instructions and evaluated for quality and quantity using Experion RNA HighSens chips (Bio-Rad) as previously described [Citation19]. cDNA was generated and amplified using a NuGEN Ovation Pico WTA system V2 kit in accordance with the manufacturer’s instructions (Cat no. NUG-3302–12, NuGEN). Purified cDNA was biotin labelled and hybridised to Affymetrix PrimeView microarrays (Cat no. 901837, Affymetrix).
Microarray data were quality checked and lacked obvious outliers. Data were normalised using the ‘limma’ R package as previously described [Citation19]. Genes that were significantly different between cytotrophoblasts and EVTs were identified after Benjamini–Hochberg false-discovery rate (FDR) correction, and a cut-off coefficient of 1.2 (corresponding to a 2.29-fold change) with corrected p-values <0.05 were used. These data can be accessed using the GEO database with accession number GSE57834.
Results
Trophoblast populations have distinct methylomes
Hierarchical clustering identified that the greatest methylation differences resulted from variation between placentae, rather than by cell type ().Despite these placenta specific differences, the three trophoblast populations had distinct methylomes. When the methylome of side-population trophoblasts were compared to cytotrophoblasts 158 CpG sites were differentially methylated between the groups, corresponding to 32 genes (, , Supplementary Table 2). 2991 CpG sites, corresponding to 1487 genes, were differentially methylated between side-population trophoblasts and EVTs (, , Supplementary Table 3). Finally, 7061 CpG sites, corresponding to 3185 genes, were differentially methylated between cytotrophoblasts and EVTs (, , Supplementary Table 4). Taken together, these data indicate that the methylome of side-population trophoblasts and cytotrophoblasts are more closely related, while EVT have a more distinctive methylome.
Table 5. Table of miRNA involved in signalling pathways regulating stem cells.
Figure 2. (a) Cluster dendogram showing hierarchical clustering based on global methylation for side-population trophoblasts (SP), cytotrophoblasts (CTB) and extravillous trophoblasts (EVT) from the four placentae used in this work (denoted by numbers 1–4). (b) Venn diagram of differentially methylated CpG sites between SP and CTB, SP and EVT or CTB and EVT.
Using a genome-wide approach to investigate DNA methylation allows the opportunity to determine the location (introns, exons, promoters, intergenic regions) where DNA methylation modifications may be occurring. Methylation events in promoter regions influence gene expression, while methylation events at exons influence repetitive DNA elements and gene splicing. The role of methylation at intra- and intergenic regions remains more unclear, although there is evidence that differential methylation in these regions can fine tune gene expression [Citation28–Citation31]. When the distribution of all CpGs covered by the 12 trophoblast samples was investigated the majority of CpGs identified were located in either introns (34.21%, ) or intergenic regions (35.51%, ). Only 17.50% of CpG were located in promoter regions () and even fewer CpGs in exons (12.77%, ). However, when trophoblast populations are compared different patterns of CpG methylation are present. The same patterns of genome methylation were observed in all three trophoblast comparison groups (side-population trophoblasts vs cytotrophoblasts, side-population trophoblasts vs EVTs, cytotrophoblasts vs EVTs), with the most differential methylation occurring in promoter regions (>54%, -) and the least occurring in exons (<10%, -). The remaining methylation events (>35%) occurred in intra- and intergenic regions (-). The high proportion of differential methylation in promoter and intra- and inter-genic regions indicates a regulatory role of DNA methylation in promoting trophoblast differentiation through control of gene expression at the promoter region or through the use of short and long non-coding RNA respectively.
Figure 3. (a) Pie chart showing the mean distribution of CpGs in promoter, exon, intron and intergenic regions across all 12 trophoblast samples. b-d) Pie charts showing the percentage of differentially methylated CpG located in promoter, exon, intron and intergenic regions when (b) side-population trophoblasts (SP) are compared to cytotrophoblasts (CTB), (c) SP are compared to extravillous trophoblasts (EVT), or (d) CTB are compared to EVT.
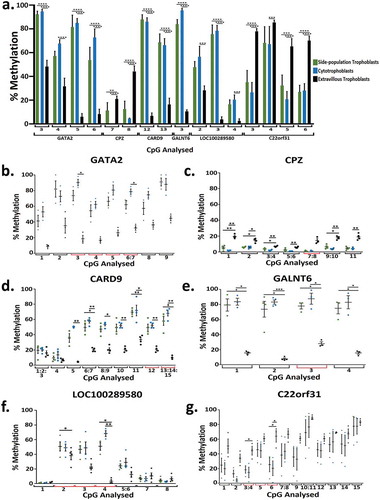
RRBS data was validated using Sequenom MassARRAY. In total 16 CpG sites across 6 genes (LOC100289580, CARD9, GALNT6, CPZ, GATA2, C22orf31) that were significantly differentially methylated in RRBS analysis were investigated by Seqenom MassARRAY (, Supplementary Table 5). In all of the significantly different methylation events examined in the three trophoblast populations () biologically similar changes in the direction of percentage of methylation were observed (i.e., methylation was in the same direction for each trophoblast population) (-, Supplementary Figure 1), but not all biological changes were statistically significant (-). In addition, a number of CpGs examined across the Sequenom MassARRAY fragment were also identified as significantly differentially methylated (-).
Figure 4. (a) Bar graph of the percentage methylation at 16 CpG across 6 genes that were significantly differentially methylation when analysed using RRBS and chosen for further validation using Sequenom methylation analysis in side-population trophoblasts, cytotrophoblasts and extravillous trophoblasts. Each number correlates to the CpG in the Sequenom amplicon presented in Figure 4 plots B-G. (b-g) Dot plots showing percentage methylation of CpGs in GATA2 (b), CPZ (c), CARD9 (d), GALNT6 (e), LOC100289580 (f), and C22orf31 (g) in SP, CTB, and EVT when analysed by Sequenom MassARRAY EpiTYPER Analysis. * indicates an adjusted p value ≤0.05 and ** indicates an adjusted p value ≤0.01, *** indicates an adjusted p value ≤0.001, **** indicates an adjusted p value ≤0.0001. Error bars SEM.
Compared to mature trophoblast populations, side-population trophoblasts exhibit differential gene methylation
To understand how gene methylation affects human trophoblast differentiation and to examine the role that side-population trophoblasts may play in this, we further investigated the differentially methylated genes between side-population trophoblasts, and mature trophoblast populations (cytotrophoblasts and EVTs). First, we examined the differential methylation of genes that play key roles in establishing the trophectoderm lineage in the blastocyst, and/or in murine TSC biology, that are known to be influenced by DNA methylation (CDX2, EOMES, HAND1, TEAD4, ELF5, and PLET1) [Citation6,Citation8,Citation32,Citation33], and found that none of these genes were differentially methylated in side-population trophoblasts compared to cytotrophoblasts or EVTs. However, several genes that are highly expressed in murine TSC, (DDB1 and CUL4 associated factor 12 like 1 (DCAF12L1), and stabilin 1 (STAB1)) were hypomethylated in side-population trophoblasts compared to cytotrophoblasts and/or EVTs () [Citation34,Citation35]. Interestingly, genes associated with maintaining pluripotency, proliferation and differentiation were differentially methylated in side-population trophoblasts compared to cytotrophoblasts or EVTs (). Taken together, this data suggests that side-population trophoblasts have a methylomic signature that distinguishes them from cytotrophoblasts.
Table 6. Table of differentially methylated genes related to EMT, and/or metastatic cancers were up-regulated in extravillous trophoblasts compared to cytotrophoblasts.
Differential methylation impacts regulatory miRNAs involved in pluripotency signalling pathways
16%–17% of methylation differences between side-population trophoblasts and cytotrophoblasts, side-population trophoblasts and EVTs, or cytotrophoblasts and EVTs, occurred at intragenic regions that encode gene regulatory molecules, including miRNAs (). Differential methylation of eight miRNAs was evident between side-population trophoblasts and cytotrophoblasts, 92 miRNAs between side-population trophoblasts and EVTs, and 212 miRNAs between cytotrophoblasts and EVTs. Eighteen of 92 miRNAs that were differentially methylated between side-population trophoblasts and EVTs, and 48/212 miRNAs that were differentially methylated between cytotrophoblasts and EVTs, were significantly enriched (p < 0.03) for ‘signalling pathways regulating pluripotency of stem cells’ by DIANA-miRPath analysis and of these, 13 were common to both groups (). This suggests that these miRNAs could play roles in maintaining a stem/progenitor phenotype in side-population trophoblasts and cytotrophoblasts.
To determine whether methylation influenced miRNA expression, the expression of three miRNAs that regulate proliferation and differentiation in stem cell populations and trophoblasts (miR-let-7b, miR-637 and miR-193B) were quantified by real-time PCR in all three trophoblast populations from four placentae. RRBS showed that all three of these miRNAs were hypermethylated in side-population trophoblasts compared to EVTs. Therefore, we would expect to see a corresponding decrease in gene expression of these miRNAs in side-population trophoblasts compared to EVTs. In concordance with expression patterns predicted by RRBS, miR-let-7b expression was significantly lower (>2 fold, p value <0.01) in both side-population and cytotrophoblasts compared to EVT (). However, there were no significant differences in mir637 or mir193B expression (, ). This demonstrates that methylation alone does not necessarily determine the expression of these miRNAs.
Figure 5. Bar graphs showing the normalised miRNA expression in side-population trophoblasts (SP), cytotrophoblasts (CTB) or extravillous trophoblasts (EVT) for (a) miR-let-7b, (b) miR-637 and (c) miR4487. ** indicates an adjusted p value ≤0.01. Error bars are SEM.
Gene methylation is associated with the acquisition of an invasive phenotype during EVT differentiation
The differentiation of villous cytotrophoblasts to invasive EVTs in many ways mimics an epithelial-mesenchymal transition (EMT) in cell phenotype [Citation36]. This EMT process is also observed in a number of invasive cancers where it is in part regulated by gene methylation. Therefore, in order to understand how methylation may regulate EVT differentiation we compared the transcriptome and methylome of first trimester cytotrophoblasts and EVTs.
When the transcripts of EVTs were compared to the transcripts of cytotrophoblasts 1744 genes were significantly upregulated ≥2 fold, and 2068 genes were significantly downregulated ≥2 fold (Supplementary Table 6). The GATHER gene ontology tool revealed that genes upregulated in EVTs were involved in pathways such as the immune response, defence response, cell motility, and response to external stimulus (Supplementary Table 7). Genes downregulated in EVTs were involved in pathways such as cell proliferation, cell cycle, regulation of protein kinase activity, and cell-cell adhesion (Supplementary Table 8). Markers characteristic of EVTs including; human leukocyte antigen–G (HLA-G) and HLA-E, and pro-migratory and invasive genes including integrin subunit alpha 1 (ITGA1), integrin subunit alpha 5 (ITGA5), and matrix metallopeptidase 2 (MMP2) were all upregulated in EVTs. Genes characteristic of cytotrophoblasts such as integrin subunit beta 4 (ITGB4), integrin subunit alpha 6 (ITGA6) and epidermal growth factor receptor (EGFR) were also all upregulated in cytotrophoblasts compared to EVTs [Citation37,Citation38].
Approximately one-third (2231/7061) of the CpG sites that were differentially methylated between cytotrophoblasts and EVTs were in promoter regions, impacting 633 unique genes. When the methylomes and transcriptomes were compared, 102/633 genes also exhibited transcriptomic changes. Interestingly 41/102 genes were associated with EMT and/or metastatic cancers (, ). However, promoter methylation did not always correspond to the expected transcript levels. 97/102 genes were hypermethylated at promoter regions in cytotrophoblasts compared to EVT, yet only 61/97 of these had a corresponding decrease in gene expression ().
Figure 6. Bar graphs showing (a) the normalised mRNA fold change in extravillous trophoblasts (EVT) compared to cytotrophoblasts (CTB) of the top 20 significantly different genes associated with EMT or invasive cancer that were hypomethylated at CpG islands in promoters regions of EVT compared to CTB (b) the normalised mRNA fold change in CTB compared to EVT of the top 20 significantly different genes that were hypermethylated at CpG island in promoters regions of CTB compared to EVT.
Discussion
Our genome-wide DNA methylation data generated from freshly isolated human side-population trophoblasts, cytotrophoblasts, and EVTs suggests that trophoblasts have a multi-level system involving both DNA methylation and miRNAs that regulate their differentiation and function. These data support our hypothesis that side-population trophoblasts are a stem-like population in the placenta, and provide insights into the regulatory mechanisms involved in acquisition of a migratory and invasive phenotype during EVT differentiation.
Studies of murine TSC suggest that the DNA methylome is important for trophoblast development and differentiation. Consequently, our current study aimed to determine whether CpG methylation may regulate side-population trophoblast differentiation and function in a similar manner to murine TSC. Our study identified two genes (DCAF12L1 and STAB1) that were hypomethylated in our side-population trophoblasts compared to mature trophoblasts, and these two genes are known to contribute to murine TSC function [Citation34,Citation35]. Our previously published microarray data set (GEO accession number GSE57834) also showed a corresponding significant increase in STAB1 gene expression in both side-population trophoblasts and cytotrophoblasts compared to EVTs. However, no transcriptomic differences in DCAF12L1 between trophoblast populations were observed. In mice, Elf5 contributes to TSC maintenance, and although there is no difference in Elf5 methylation between different murine trophoblast populations, Elf5 gene expression is downregulated in TSC differentiated to mature trophoblast lineages [Citation10,Citation11]. Similarly, in this study there was no differential methylation of ELF5 in the different human trophoblast populations, although the human situation is slightly different as ELF5 is stably expressed in cytotrophoblasts [Citation13,Citation19,Citation39]. We speculate that these differences may result from the fact that the murine placenta is anatomically quite distinct from the human placenta, and that murine and human embryos implant into the maternal tissue in opposite orientations with human embryos implanting via the embryonic pole, while murine embryos implant via the an anembryonic pole. Thus the trophoblasts of the two species are exposed to quite different environmental cues that may influence DNA methylation [Citation38].
In line with their proposed in vivo lineage relationship where side-population trophoblasts differentiate into cytotrophoblasts, this study showed that side-population trophoblasts have a methylome more similar to that of cytotrophoblasts than EVTs [Citation40]. Our differential methylation analyses indicate that side-population trophoblasts may be less differentiated than cytotrophoblasts and EVTs. For example, tumour protein, translationally-controlled 1 (TPT1) is hypermethylated in side-population trophoblasts compared to mature trophoblasts. Hypermethylation of TPT1 inhibits expression of POU class 5 homeobox 1 (OCT4) and Nanog homeobox (NANOG), which are downregulated during trophectoderm lineage segregation during blastocyst formation [Citation41,Citation42]. This suggests that from the perspective of DNA methylation patterns, side-population trophoblasts are more closely related to the trophectoderm (from which all trophoblasts lineages are derived) than mature trophoblast populations. In addition, differential methylation of genes associated with the maintenance of stem cell populations (e.g., DExH-box helicase 34 (DHX34), PR/SET domain 2 (PRDM2), and LDL receptor related protein 5 (LRP5)), was observed in side-population trophoblasts compared to mature trophoblast populations [Citation43,Citation44]. Together this suggests that DNA methylation may contribute to maintaining potency and guiding lineage commitment/differentiation in side-population trophoblasts.
Successful placentation involves the invasion of EVTs through the decidua [Citation22,Citation45]. Similar characteristics are found in cancer cells, and may result from similar molecular circuits involved in EMT and tumour development, which have been suggested to be regulated by epigenetic factors [Citation22,Citation45,Citation46]. Previous data has shown that first trimester placental lysates and cytotrophoblasts are hypomethylated in gene blocks more closely related to cancer phenotypes (some of which were enriched for EMT) compared to third trimester samples [Citation47]. Corresponding gene expression differences in EMT pathways in first versus third trimester placentae have also been reported, and together this data likely represents key gestational differences in placentation, as the majority of EVT differentiation and invasion occurs in the first half of pregnancy [Citation22]. We believe our study is the first to investigate differences in methylation in individual uncultured trophoblast populations from the first trimester placentae, and to our knowledge is the first large scale analysis of matched cytotrophoblasts and EVTs from the same placenta that has connected promoter methylation with gene expression data to understand how methylation influences EVT differentiation. Overall, changes in gene methylation in promotor regions between cytotrophoblasts and EVTs were observed in 19 EMT-associated genes. Of these, 17 genes that were hypomethylated in promoter regions in our methylomic dataset exhibited corresponding changes in gene expression in our transcriptomic dataset, including ADAM metallopeptidase domain 19 (ADAM19), distal-less homeobox 4 (DLX4), LIM homeobox 2 (LHX2), and lysyl oxidase like 1 (LOXL1). This demonstrates that gene methylation likely regulates some (but not all) of the EMT changes in gene expression during EVT differentiation, and supports the emerging concept that EVT differentiation is an EMT-like process [Citation36,Citation48,Citation49].
It has previously been demonstrated that in the placenta methylation differences do not always directly correspond to differences in gene expression [Citation50–Citation52]. Our data shows a similar lack of direct correlation between methylation and gene expression. The majority of placental gene expression regulation is instead likely attributable to changes associated with small RNA, non-coding RNA and histone modifications that in-directly regulate gene expression [Citation52,Citation53]. Indeed our study identified 225 miRNAs that were differentially methylated between trophoblast populations. However, as DNA methylation did not always correlate with miRNA expression, additional regulatory mechanisms must guide miRNA expression in human trophoblasts. Such additional mechanisms may lie in the 3D structure that the genome holds within cells, which means that small changes to the DNA (for example, through the addition or removal of methyl groups) can change the ultrastructure of the DNA in a manner that impacts lineage-specific transcriptional programs [Citation9,Citation54]. For example, DNA methylation mediates chromatin remodelling and contributes to murine trophoblast lineage segregation [Citation9].
The methodology employed in this study only allowed us to investigated CpG methylation in detail. To more comprehensively understand how methylation influences trophoblast differentiation, future studies of human trophoblast populations should investigate non-CpG methylation (CpA, CpT, and CpC). Indeed, non-CpG methylation is a feature of pluripotent cell types and induced pluripotent stem cells [Citation55]. However, as non-CpG methylation accounts for ≤1.7% of methylation in our samples (data not shown) the extent to which this would influence side-population trophoblast function/differentiation in the placenta is unclear.
In conclusion, the methylome of human first trimester side-population trophoblasts, cytotrophoblasts and EVT are distinct from one another. This RRBS analysis of the trophoblast methylome suggests that a multilevel mechanism regulates human trophoblast differentiation. This study provides a scaffold from which individual trophoblast populations can be studied in pregnancy disorders to better understand how DNA methylation maybe impacting the pathogenesis of diseases such as fetal growth restriction and preeclampsia.
Supplemental Material
Download Zip (2 MB)Acknowledgments
Thanks are extended to the staff and patients at Auckland Medical Aid Centre for donating the placental tissue used in this work. The authors would like to thank Stephen Edgar for flow cytometry assistance and expertise.
Disclosure statement
No potential conflict of interest was reported by the authors.
Supplementary material
Supplemental data for this article can be accessed here.
Additional information
Funding
Related Research Data
References
- Benirschke K. The placenta: structure and function. NeoReviews. 2004;5:e252–e61.
- James JL, Srinivasan S, Alexander M, et al. Can we fix it? Evaluating the potential of placental stem cells for the treatment of pregnancy disorders. Placenta. 2014;35:77–84.
- Huppertz B. Trophoblast differentiation, fetal growth restriction and preeclampsia. Pregnancy Hypertens. 2011;1:79–86.
- Vlahovic M, Bulic-Jakus F, Juric-Lekic G, et al. Changes in the placenta and in the rat embryo caused by the demethylating agent 5-azacytidine. Int J Dev Biol. 1999;43:843–846.
- Branco MR, King M, Perez-Garcia V, et al. Maternal DNA methylation regulates early trophoblast development. Dev Cell. 2016;36:152–163.
- Murray A, Sienerth AR, Hemberger M. Plet1 is an epigenetically regulated cell surface protein that provides essential cues to direct trophoblast stem cell differentiation. Sci Rep. 2016;6:25112.
- Senner CE, Krueger F, Oxley D, et al. DNA methylation profiles define stem cell identity and reveal a tight embryonic-extraembryonic lineage boundary. Stem Cells. 2012;30:2732–2745.
- Ng RK, Dean W, Dawson C, et al. Epigenetic restriction of embryonic cell lineage fate by methylation of Elf5. Nat Cell Biol. 2008;10:1280–1290.
- Tomikawa J, Fukatsu K, Tanaka S, et al. DNA methylation-dependent epigenetic regulation of dimethylarginine dimethylaminohydrolase 2 gene in trophoblast cell lineage. J Biol Chem. 2006;281:12163–12169.
- Latos PA, Sienerth AR, Murray A, et al. Elf5-centered transcription factor hub controls trophoblast stem cell self-renewal and differentiation through stoichiometry-sensitive shifts in target gene networks. Genes Dev. 2015;29:2435–2448.
- Oda M, Oxley D, Dean W, et al. Regulation of lineage specific DNA hypomethylation in mouse trophectoderm. PloS one. 2013;8:e68846.
- Apps R, Sharkey A, Gardner L, et al. Genome-wide expression profile of first trimester villous and extravillous human trophoblast cells. Placenta. 2011;32:33–43.
- Lee CQ, Gardner L, Turco M, et al. What is trophoblast? A combination of criteria define human first-trimester trophoblast. Stem Cell Reports. 2016;6:257–272.
- Novakovic B, Evain-Brion D, Murthi P, et al. Variable DAXX gene methylation is a common feature of placental trophoblast differentiation, preeclampsia, and response to hypoxia. FASEB J. 2017;31:2380–2392.
- Novakovic B, Fournier T, Harris LK, et al. Increased methylation and decreased expression of homeobox genes TLX1, HOXA10 and DLX5 in human placenta are associated with trophoblast differentiation. Sci Rep. 2017;7:4523.
- Okae H, Toh H, Sato T, et al. Derivation of human trophoblast stem cells. Cell Stem Cell. 2018;22:50–63 e6.
- Zdravkovic T, Nazor KL, Larocque N, et al. Human stem cells from single blastomeres reveal pathways of embryonic or trophoblast fate specification. Development. 2015;142:4010–4025.
- Genbacev O, Donne M, Kapidzic M, et al. Establishment of human trophoblast progenitor cell lines from the chorion. Stem Cells. 2011;29:1427–1436.
- James JL, Hurley DG, Gamage TK, et al. Isolation and characterisation of a novel trophoblast side-population from first trimester placentae. Reproduction. 2015;150:449–462.
- Kim M, Costello J. DNA methylation: an epigenetic mark of cellular memory. Exp Mol Med. 2017;49:e322.
- Bianco-Miotto T, Mayne BT, Buckberry S, et al. Recent progress towards understanding the role of DNA methylation in human placental development. Reproduction. 2016;152:R23–30.
- Nordor AV, Nehar-Belaid D, Richon S, et al. The early pregnancy placenta foreshadows DNA methylation alterations of solid tumors. Epigenetics. 2017;12:793–803.
- Logan PC, Mitchell MD, Lobie PE. DNA methyltransferases and TETs in the regulation of differentiation and invasiveness of extra-villous trophoblasts. Front Genet. 2013;4:265.
- Chatterjee A, Rodger EJ, Stockwell PA, et al. Technical considerations for reduced representation bisulfite sequencing with multiplexed libraries. J Biomed Biotechnol. 2012;2012:741542.
- Stockwell PA, Chatterjee A, Rodger EJ, et al. DMAP: differential methylation analysis package for RRBS and WGBS data. Bioinformatics. 2014;30:1814–1822.
- Akalin A, Kormaksson M, Li S, et al. methylKit: a comprehensive R package for the analysis of genome-wide DNA methylation profiles. Genome Biol. 2012;13:R87.
- Livak KJ, Schmittgen TD. Analysis of relative gene expression data using real-time quantitative PCR and the 2(-Delta Delta C(T)) Method. Methods. 2001;25:402–408.
- Yong WS, Hsu FM, Chen PY. Profiling genome-wide DNA methylation. Epigenetics Chromatin. 2016;9:26.
- Gulyaeva LF, Kushlinskiy NE. Regulatory mechanisms of microRNA expression. J Transl Med. 2016;14:143.
- Maunakea AK, Nagarajan RP, Bilenky M, et al. Conserved role of intragenic DNA methylation in regulating alternative promoters. Nature. 2010;466:253.
- Yan X, Dong X, Liu L, et al. DNA methylation signature of intergenic region involves in nucleosome remodeler DDM1-mediated repression of aberrant gene transcriptional read-through. J Genet Genome. 2016;43:513–523.
- Knott JG, Paul S. Transcriptional regulators of the trophoblast lineage in mammals with hemochorial placentation. Reproduction. 2014;148:R121–R36.
- Cambuli F, Murray A, Dean W, et al. Epigenetic memory of the first cell fate decision prevents complete ES cell reprogramming into trophoblast. Nat Commun. 2014;5:5538.
- Pearton DJ, Smith CS, Redgate E, et al. Elf5 counteracts precocious trophoblast differentiation by maintaining Sox2 and 3 and inhibiting Hand1 expression. Dev Biol. 2014;392:344–357.
- Asanoma K, Kubota K, Chakraborty D, et al. SATB homeobox proteins regulate trophoblast stem cell renewal and differentiation. J Biol Chem. 2012;287:2257–2268.
- DaSilva-Arnold S, James JL, Al-Khan A, et al. Differentiation of first trimester cytotrophoblast to extravillous trophoblast involves an epithelial-mesenchymal transition. Placenta. 2015;36:1412–1418.
- Knöfler M, Pollheimer J. Human placental trophoblast invasion and differentiation: a particular focus on Wnt signaling. Front Genet. 2013;4:190.
- Gamage TK, Chamley LW, James JL. Stem cell insights into human trophoblast lineage differentiation. Hum Reprod Update. 2016;23:77–103.
- Hemberger M, Udayashankar R, Tesar P, et al. ELF5-enforced transcriptional networks define an epigenetically regulated trophoblast stem cell compartment in the human placenta. Hum Mol Genet. 2010;19:2456–2467.
- James JL, Carter AM, Chamley LW. Human placentation from nidation to 5 weeks of gestation. Part I: What Do We Know about Formative Placental Development following Implantation?.Placenta. 2012;33:327–334.
- Amson R, Pece S, Marine JC, et al. TPT1/TCTP-regulated pathways in phenotypic reprogramming. Trends Cell Biol. 2013;23:37–46.
- Koziol MJ, Garrett N, Gurdon JB. Tpt1 activates transcription of oct4 and nanog in transplanted somatic nuclei. Curr Biol. 2007;17:801–807.
- Li T, Shi Y, Wang P, et al. Smg6/Est1 licenses embryonic stem cell differentiation via nonsense-mediated mRNA decay. Embo J. 2015;34:1630–1647.
- Lou C-H, Shum EY, Wilkinson MF. RNA degradation drives stem cell differentiation. Embo J. 2015;34:1606–1608.
- Holtan SG, Creedon DJ, Haluska P, et al. Cancer and pregnancy: parallels in growth, invasion, and immune modulation and implications for cancer therapeutic agents. Mayo Clin Proc. 2009;84:985–1000.
- Ferretti C, Bruni L, Dangles-Marie V, et al. Molecular circuits shared by placental and cancer cells, and their implications in the proliferative, invasive and migratory capacities of trophoblasts. Hum Reprod Update. 2007;13:121–141.
- DaSilva-Arnold S, Zamudio S, Al-Khan A, et al. Human trophoblast epithelial-mesenchymal transition in abnormally invasive placenta. Biol Reprod. 2018.
- Davies JE, Pollheimer J, Yong HEJ, et al. Epithelial-mesenchymal transition during extravillous trophoblast differentiation. Cell Adh Migr. 2016;10:310–321.
- Knofler M. Critical growth factors and signalling pathways controlling human trophoblast invasion. Int J Dev Biol. 2010;54:269–280.
- Ehrlich KC, Paterson HL, Lacey M, et al. DNA hypomethylation in intragenic and intergenic enhancer chromatin of muscle-specific genes usually correlates with their expression. Yale J Biol Med. 2016;89:441–455.
- Avila L, Yuen RK, Diego-Alvarez D, et al. Evaluating DNA methylation and gene expression variability in the human term placenta. Placenta. 2010;31:1070–1077.
- Mayne BT, Leemaqz SY, Smith AK, et al. Accelerated placental aging in early onset preeclampsia pregnancies identified by DNA methylation. Epigenomics. 2017;9:279–289.
- Cai Y, Yu X, Hu S, et al. A brief review on the mechanisms of miRNA regulation. Genomics Proteomics Bioinformatics. 2009;7:147–154.
- Gorkin DU, Leung D, Ren B. The 3D genome in transcriptional regulation and pluripotency. Cell Stem Cell. 2014;14:762–775.
- Ziller MJ, Muller F, Liao J, et al. Genomic distribution and inter-sample variation of non-CpG methylation across human cell types. PLoS Genet. 2011;7:e1002389.
- Cheedipudi S, Puri D, Saleh A, et al. A fine balance: epigenetic control of cellular quiescence by the tumor suppressor PRDM2/RIZ at a bivalent domain in the cyclin a gene. Nucleic Acids Res. 2015;43:6236–6256.
- Lindvall C, Evans NC, Zylstra CR, et al. The Wnt signaling receptor Lrp5 is required for mammary ductal stem cell activity and Wnt1-induced tumorigenesis. J Biol Chem. 2006;281:35081–35087.
- Ohtsubo M, Kai R, Furuno N, et al. Isolation and characterization of the active cDNA of the human cell cycle gene (RCC1) involved in the regulation of onset of chromosome condensation. Genes Dev. 1987;1:585–593.
- Celano P, Berchtold CM, Giardiello FM, et al. Modulation of growth gene expression by selective alteration of polyamines in human colon carcinoma cells. Biochem Biophys Res Commun. 1989;165:384–390.
- Asano M, Furukawa K, Kido M, et al. Growth retardation and early death of beta-1,4-galactosyltransferase knockout mice with augmented proliferation and abnormal differentiation of epithelial cells. Embo J. 1997;16:1850–1857.
- Johnstone ED, Sibley CP, Lowen B, et al. Epidermal growth factor stimulation of trophoblast differentiation requires MAPK11/14 (p38 MAP kinase) activation. Biol Reprod. 2005;73:1282–1288.
- Melero R, Hug N, Lopez-Perrote A, et al. The RNA helicase DHX34 functions as a scaffold for SMG1-mediated UPF1 phosphorylation. Nat Commun. 2016;7:10585.
- Francoz S, Froment P, Bogaerts S, et al. Mdm4 and Mdm2 cooperate to inhibit p53 activity in proliferating and quiescent cells in vivo. Proc Natl Acad Sci U S A. 2006;103:3232–3237.
- Gouti M, Gavalas A. Hoxb1 controls cell fate specification and proliferative capacity of neural stem and progenitor cells. Stem Cells. 2008;26:1985–1997.
- Chuang TH, Xu X, Kaartinen V, et al. Abr and Bcr are multifunctional regulators of the Rho GTP-binding protein family. Proc Natl Acad Sci U S A. 1995;92:10282–10286.
- Wang X, Wang E, Cao J, et al. MiR-145 inhibits the epithelial-to-mesenchymal transition via targeting ADAM19 in human glioblastoma. Oncotarget. 2017;8:92545–92554.
- Kawahara R, Granato DC, Carnielli CM, et al. Agrin and perlecan mediate tumorigenic processes in oral squamous cell carcinoma. PloS one. 2014;9:e115004.
- Horie A, Fujiwara H, Sato Y, et al. Laeverin/aminopeptidase Q induces trophoblast invasion during human early placentation. Hum Reprod. 2012;27:1267–1276.
- Canevari RA, Marchi FA, Domingues MA, et al. Identification of novel biomarkers associated with poor patient outcomes in invasive breast carcinoma. Tumour Biol. 2016;37:13855–13870.
- Miao C, Liang C, Tian Y, et al. Overexpression of CAPN2 promotes cell metastasis and proliferation via AKT/mTOR signaling in renal cell carcinoma. Oncotarget. 2017;8:97811–97821.
- Yang M, Shao JH, Miao YJ, et al. Tumor cell-activated CARD9 signaling contributes to metastasis-associated macrophage polarization. Cell Death Differ. 2014;21:1290–1302.
- Kaufmann MR, Schraml P, Hermanns T, et al. Onconeuronal antigen Cdr2 correlates with HIF prolyl-4-hydroxylase PHD1 and worse prognosis in renal cell carcinoma. Exp Mol Pathol. 2013;94:453–457.
- Sun YY, Lu M, Xi XW, et al. Regulation of epithelial-mesenchymal transition by homeobox gene DLX4 in JEG-3 trophoblast cells: a role in preeclampsia. Reprod Sci. 2011;18:1138–1145.
- Vasudevan SA, Russell HV, Okcu MF, et al. Neuroblastoma-derived secretory protein messenger RNA levels correlate with high-risk neuroblastoma. J Pediatr Surg. 2007;42:148–152.
- Sossey-Alaoui K, Pluskota E, Davuluri G, et al. Kindlin-3 enhances breast cancer progression and metastasis by activating Twist-mediated angiogenesis. FASEB J. 2014;28:2260–2271.
- Li C, Zhu M, Lou X, et al. Transcriptional factor OCT4 promotes esophageal cancer metastasis by inducing epithelial-mesenchymal transition through VEGF-C/VEGFR-3 signaling pathway. Oncotarget. 2017;8:71933–71945.
- Guiet R, Poincloux R, Castandet J, et al. Hematopoietic cell kinase (Hck) isoforms and phagocyte duties - from signaling and actin reorganization to migration and phagocytosis. Eur J Cell Biol. 2008;87:527–542.
- de Kreuk BJ, Schaefer A, Anthony EC, et al. The human minor histocompatibility antigen 1 is a RhoGAP. PloS one. 2013;8:e73962.
- Jiang Y-X, Li P-A, Yang S-W, et al. Increased chemokine receptor IL-17RA expression is associated with poor survival in gastric cancer patients. Int J Clin Exp Pathol. 2015;8:7002–7008.
- Kim JK, Jin X, Ham SW, et al. IRF7 promotes glioma cell invasion by inhibiting AGO2 expression. Tumour Biol. 2015;36:5561–5569.
- Hwang ES, Nyante SJ, Yi Chen Y, et al. Clonality of lobular carcinoma in situ and synchronous invasive lobular carcinoma. Cancer. 2004;100:2562–2572.
- Wang C, Wang C, Wei Z, et al. Suppression of motor protein KIF3C expression inhibits tumor growth and metastasis in breast cancer by inhibiting TGF-beta signaling. Cancer Lett. 2015;368:105–114.
- Henson BJ, Gollin SM. Overexpression of KLF13 and FGFR3 in oral cancer cells. Cytogenet Genome Res. 2010;128:192–198.
- Gehrau RC, D’Astolfo DS, Dumur CI, et al. Nuclear expression of KLF6 tumor suppressor factor is highly associated with overexpression of ERBB2 oncoprotein in ductal breast carcinomas. PloS one. 2010;5:e8929.
- Kuzmanov A, Hopfer U, Marti P, et al. LIM-homeobox gene 2 promotes tumor growth and metastasis by inducing autocrine and paracrine PDGF-B signaling. Mol Oncol. 2014;8:401–416.
- Zhang Y, Chen K, Guo L, et al. Characterization of PINCH-2, a new focal adhesion protein that regulates the PINCH-1-ILK interaction, cell spreading, and migration. J Biol Chem. 2002;277:38328–38338.
- Cuevas EP, Eraso P, Mazon MJ, et al. LOXL2 drives epithelial-mesenchymal transition via activation of IRE1-XBP1 signalling pathway. Sci Rep. 2017;7:44988.
- Abdelzaher E, Mostafa MF. Lysophosphatidylcholine acyltransferase 1 (LPCAT1) upregulation in breast carcinoma contributes to tumor progression and predicts early tumor recurrence. Tumour Biol. 2015;36:5473–5483.
- Konakahara S, Saitou M, Hori S, et al. A neuronal transmembrane protein LRFN4 induces monocyte/macrophage migration via actin cytoskeleton reorganization. FEBS Lett. 2011;585:2377–2384.
- Zhu LY, Zhang WM, Yang XM, et al. Silencing of MICAL-L2 suppresses malignancy of ovarian cancer by inducing mesenchymal-epithelial transition. Cancer Lett. 2015;363:71–82.
- Wu Y, Siadaty MS, Berens ME, et al. Overlapping gene expression profiles of cell migration and tumor invasion in human bladder cancer identify metallothionein 1E and nicotinamide N-methyltransferase as novel regulators of cell migration. Oncogene. 2008;27:6679–6689.
- Green AR, Burney C, Granger CJ, et al. The prognostic significance of steroid receptor co-regulators in breast cancer: co-repressor NCOR2/SMRT is an independent indicator of poor outcome. Breast Cancer Res Treat. 2008;110:427–437.
- La Belle AA, Schiemann WP. The propensity for epithelial-mesenchymal transitions is dictated by chromatin states in the cancer cell of origin. Stem Cell Investig. 2017;4:44.
- Zito A, Cartelli D, Cappelletti G, et al. Neuritin 1 promotes neuronal migration. Brain Struct Funct. 2014;219:105–118.
- Karaczyn AA, Adams TL, Cheng RY, et al. Human NUMB6 induces epithelial-mesenchymal transition and enhances breast cancer cells migration and invasion. J Cell Biochem. 2017;118:237–251.
- Zhong M, Bian Z, Wu Z. miR-30a suppresses cell migration and invasion through downregulation of PIK3CD in colorectal carcinoma. Cell Physiol Biochem. 2013;31:209–218.
- Liu J, Qu X, Shao L, et al. Pim-3 enhances melanoma cell migration and invasion by promoting STAT3 phosphorylation. Cancer Biol Ther. 2018;19:160–168.
- Takahata M, Inoue Y, Tsuda H, et al. SKI and MEL1 cooperate to inhibit transforming growth factor-beta signal in gastric cancer cells. J Biol Chem. 2009;284:3334–3344.
- Duan B, Cui J, Sun S, et al. EGF-stimulated activation of Rab35 regulates RUSC2-GIT2 complex formation to stabilize GIT2 during directional lung cancer cell migration. Cancer Lett. 2016;379:70–83.
- Chen D, Lin Q, Box N, et al. SKI knockdown inhibits human melanoma tumor growth in vivo. Pigment Cell Melanoma Res. 2009;22:761–772.
- Kondaveeti Y, Guttilla Reed IK, White BA. Epithelial-mesenchymal transition induces similar metabolic alterations in two independent breast cancer cell lines. Cancer Lett. 2015;364:44–58.
- Li W, Cao L, Han L, et al. Superoxide dismutase promotes the epithelial-mesenchymal transition of pancreatic cancer cells via activation of the H2O2/ERK/NF-kappaB axis. Int J Oncol. 2015;46:2613–2620.
- Brown KA, Aakre ME, Gorska AE, et al. Induction by transforming growth factor-β1 of epithelial to mesenchymal transition is a rare event in vitro. Breast Cancer Res. 2004;6:R215–R31.
- Kubo E, Hasanova N, Fatma N, et al. Elevated tropomyosin expression is associated with epithelial-mesenchymal transition of lens epithelial cells. J Cell Mol Med. 2013;17:212–221.
- Wang JM, Huang FC, Kuo MH, et al. Inhibition of cancer cell migration and invasion through suppressing the Wnt1-mediating signal pathway by G-quadruplex structure stabilizers. J Biol Chem. 2014;289:14612–14623.
- Mori M, Nakagami H, Koibuchi N, et al. Zyxin mediates actin fiber reorganization in epithelial-mesenchymal transition and contributes to endocardial morphogenesis. Mol Biol Cell. 2009;20:3115–3124.