
ABSTRACT
One common experimental hurdle that arises when explore patterns of cytosine methylation is the generation of data derived from a single specific tissue, often arduous to isolate from a heterogeneous biospecimen. Here we show a new strategy for exploring environment- or mutation-caused changes in cell type- or tissue-specific methylation landscapes, which requires neither transgenic reporter cell lines nor physical separation. This approach takes advantage of a known distinct methylation signature existing in only one of the tissues within an organ under a particular condition. From the information on such compared published methylomes, one can design a set of PCR primers that specifically amplify bisulfite-converted DNA of two nearby genomic regions of interest, thus allowing for tissue-specific DNA methylation data. To validate the performance of the approach, we designed primers able to amplify a portion of a gene in the context of root biology: the Arabidopsis homeotic gene Glabra-2 (Gl2), expressed only in epidermis during cell differentiation. We found that the extent of methylated cytosines appears remarkably different when root epidermis-specific primers were used vs. non-specific ones under three genetic backgrounds involving mutations in genes also associated with the establishment of cell identity. Although the genetic or environmental perturbations to be studied might modify methylation in the primer-annealing zone, leading to a possible misinterpretation of the data, the strategy presented here can become a useful first round screening tool to detect differences in tissue-specific epigenetic status under new conditions.
Background
DNA methylation and demethylation at the carbon 5 position of cytosines (5 meC) is one of several regulatory mechanisms at the transcriptional level that give cells the possibility to respond to different stimuli [Citation1]. These epigenetic reversible processes contribute to the plasticity of organisms as they grant them the chance to rapidly adapt to an environment under continuously changing conditions without the need of mutation and selection, which take generations to operate [Citation2].
Gene expression patterns are not homogeneous across different cell types of a particular organ. In this context, a common problem in many epigenetics studies is a great loss of information as results often are derived from samples made of different tissues. The reason is the experimental difficulty that arises when it comes to separate one specific tissue in a heterogeneous sample. One solution is the use of expensive or laborious techniques, for example laser microdissection [Citation3] or fluorescence-activated cell sorting (FACS), the latter requiring an expensive equipment and a reporter transgenic line with labeled cells [Citation4]. These strategies are time-consuming and introduce some kind of stress to cells, an undesirable effect specially when studying regulation networks. However, some work addressing this issue for the first time by isolating individual cells or single tissues had to be done [Citation5–Citation8].
In the present work we show an affordable, quick and easy strategy to analyze methylation patterns of cells from a single tissue. Its convenience relies on: i) the use of the standard protocol based on treatment of genomic DNA with sodium bisulfite [Citation9]; ii) the avoidance of physical cell isolation, being a thermocycler the only necessary laboratory equipment. The method allows comparison of DNA methylation status of specific cells from organisms subjected to different treatments or conditions, provided the methylome under one condition is already known. There are several online platforms and databases showing methylomes from many biological models [Citation10–Citation13], potentially amenable to take advantage of.
To test the method, we chose a gene of our interest in the context of root biology: the homeotic gene Glabra-2 (Gl2) (AT1G79840), which encodes a transcription factor that determines epidermal cell identity [Citation14,Citation15]. This gene possesses 9 exons and 8 introns and is expressed only in epidermis. This tissue is formed by a single layer of cells [Citation16], being the more external, it surrounds the other tissues present in the root: cortex, endodermis, stele (pericycle, phloem, procambium, metaxylem and protoxylem), columella and columella root cap (the two latter present only in the tip). The fragility and thinness of the root of Arabidopsis thaliana, our model organism, make the dissection of its constituting tissues difficult. As this gene happened to display a differential methylation pattern in root epidermis [Citation17], we focused our study on Gl2 in root epidermal cells.
As examples of perturbation of the Gl2 methylation pattern to be analyzed in a tissue-specific manner, we chose three different Arabidopsis mutants in loci encoding proteins involved in the process of cell differentiation at the epidermal level, acting upstream of GL2: i) Werewolf (AT5G14750) (wer), which normally promotes epidermal cells to differentiate to the non-hair cell fate by forming a complex together with two other proteins [Citation18] promoting the expression of Gl2; ii) Caprice (AT2G46410) (cpc), which forms a complex that represses Gl2 and promotes differentiation of hair-forming cells [Citation19]; and iii) ‘Enhancer of Triptychon and Caprice 1’ (AT1G01380) (etc1), which is partially redundant along with Caprice [Citation20].
Results
Design of tissue-specific primers
We used the standard sodium bisulfite protocol, which includes the treatment of genomic DNA with sodium bisulfite, followed by PCR, cloning of the product and sequencing. The strategy we developed takes advantage of the differences that appear after bisulfite treatment in the sequence of a gene with a differential methylation pattern in one particular tissue, Gl2 in the case of this work. This allows the design of primers that specifically match the treated DNA from that tissue in a sample derived from a mixture of cells of different tissues. The design of tissue-specific primers is the most critical step for the current approach to be successful.
We analyzed the master gene Gl2, which is differentially expressed in the epidermis, having a key role in cell differentiation. We explored its methylome in the root of wild type Arabidopsis thaliana Col-0 plants [Citation17] (http://neomorph.salk.edu/Arabidopsis_root_methylomes.php) and found three regions differentially methylated in the epidermis. For the design of the tissue-specific primers to be used in the post-bisulfite PCR, we chose two of those regions, separated by 744 bp as they allowed the amplification of the sequence they encompass (802 bp). We also paid attention to a general requirement for the designed primers: the presence of a high content of thymines corresponding to unmethylated cytosines in the original DNA sequence (or adenines in the case of the reverse primer), particularly in the 3´end if possible [Citation21]. With the previous caution in mind, we carefully designed a set of primers that made it possible to analyze the methylation status of a region of Gl2 in a tissue-specific manner. shows the two DNA sequences chosen as found in the six tissues of the root, previous to the bisulfite treatment (original sequence) -which is obviously the same in all of them-, and after the treatment. The sequence of the designed primers is also shown.
Figure 1. Gl2 nucleotide sequence (before and after bisulfite treatment) for a 21-bp region where the tissue-specific forward primer matches (left panel) and a 37-bp region where the tissue-specific reverse primer matches (right panel). Highlighted in black: cytosines that remained as such after the treatment (as they were methylated in the original sequence). So are their complementary guanines in the reverse primer sequence. Highlighted in gray: thymines resulting from conversion of unmethylated cytosines. So are their complementary adenosines in the reverse primer sequence.
This way, the conceived primers seemed in principle suitable to amplify the target region in the epidermis according to the cytosines differentially methylated in this tissue. In addition, they bear the mentioned high content of thymine residues compatible with convertible unmethylated cytosines: 6 in the forward primer, and 9 in the reverse one. These primers enabled the analysis of a Gl2 sequence 802-nt long (208 are cytosines), corresponding to exons 7, 8, part of 6, part of 9 and introns 6, 7 and 8.
Testing primer specificity
After extracting genomic DNA from entire roots of A. thaliana plants and submitting it to bisulfite treatment followed by PCR, we confirmed that the primers designed amplified only bisulfite-treated genomic DNA ()). In addition, for all the experimental assays carried out from here on, we used a portion of the mitochondrial gene Atp1 as a control of conversion, which is a way to evaluate the effectiveness of the bisulfite reaction. We found that its naturally completely unmethylated sequence showed a 99.5% of conversion after the treatment (Figure S1).
Figure 2. Specificity of the designed primers. (a) Primers only amplify bisulfite treated DNA. 1% agarose gel electrophoresis. MWM: Molecular Weight Marker, pbDNA: post-bisulfite treated DNA, ntDNA: non-treated DNA, NTC: No-template control. (b) Gl2 methylation profile using epidermal specific primers in WT plants. Template methylation pattern match in all cases with those published in the epidermal methylome. Brown arrows represent forward and reverse primers.
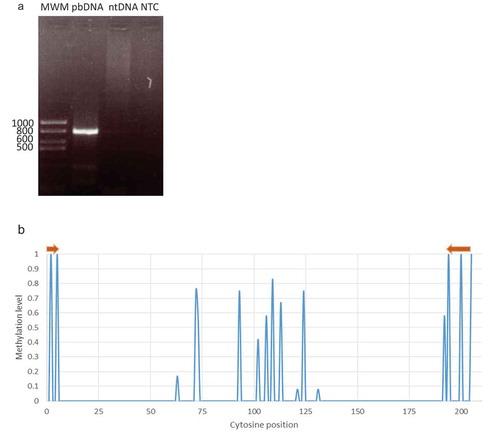
To assess the specificity of the primers towards the epidermal tissue, we sequenced the corresponding amplicon and analyzed its cytosine methylation status. We observed an excellent agreement between the methylation pattern found in all the clones analyzed and the one in the epidermis according to the published methylome ()). From this result, we could infer a high specificity for the primers as they are able to clearly distinguish between molecules from different tissues. Being the differential methylation pattern the key for tissue discrimination, it is fundamental that primers anneal unequivocally to converted template DNA from the specific tissue under study.
Methylation data using tissue-specific primers versus non-specific ones. analyzing the wer, cpc and etc1 mutant cases
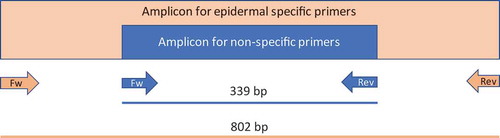
To further assess the specific (in terms of tissue type) methylation status of the model gene, we also designed a non-specific set of primers for the same gene. For its design, we targeted two genomic regions where the methylation status was the same for the six tissues. These primers were able to amplify a shorter sequence of Gl2, 339-bp in length, which is embedded within the tissue (epidermis)-specific amplified sequence (). Within this 339-nt region, there are 87 cytosines, 12 of which are in the -CG- context, 12 in the -CHG- context, and 63 in the -CHH- context (being ‘H’ any nucleotide except for G).
Figure 3. Schematic representation of the Gl2 amplicons. The region amplified by using the non-specific primers is embedded in the epidermal-specific amplicon.
As stated before, for the present strategy to be feasible, it is necessary to previously know the methylation status of the gene under study in each of the different tissues present in the biological sample. The usefulness of the tissue-specific set of primers is, precisely, to be able to detect changes in methylation in a particular tissue caused by a genomic or environmental perturbation. To this end, we took advantage of two conditions under which plants showed a drastic alteration in their epidermal developmental cell program. For instance, it has been reported [Citation18] and also observed in our lab that plants mutated in Werewolf (wer) showed a drastic increase in its root hair density compared to wild type plants, and, conversely, mutants in Caprice (cpc) exhibited a marked decrease [Citation22] (Figure S2). As the root hair pattern changed in these mutants, we reasoned that the regulatory network might also be altered. It could thus be expected that Gl2 -a master gene for epidermal cell differentiation- could be affected in its methylation pattern in these mutants. To test this, we carried out assays with genomic DNA from entire roots of A. thaliana wer plants (T-DNA insertional mutants, SALK_114008), cpc plants (T-DNA insertional mutants, SAIL_310_C06), and etc1 plants (T-DNA insertional mutants, SALK_094648C). The latter mutant lacks an overt root phenotype, as Etc1 gene is partially redundant with Cpc gene. We then analyzed the methylation pattern of Gl2 in each of the three mutants by using either the non-specific or the tissue-specific primers. After post-bisulfite PCR for each mutant plant line, we sequenced 24 clones harboring the amplicons, 12 from each primer set used (, Figure S3 and Figure S4). A similar analysis and display of results were done for wild type plants (Figure S5).
Figure 4. Kismeth dotplots [Citation30] showing the methylation pattern for a region of Gl2 in roots from the wer mutant, detected using either the non-specific primers or the epidermal-specific primers. Each line represents one clone, and each circle one cytosine (from 5´, left to 3´, right). Blue, red and green correspond to cytosines in -CHG-, -CG- and – CHH- contexts, respectively. Filled circles indicate methylated cytosines, whereas empty circles represent unmethylated ones.
![Figure 4. Kismeth dotplots [Citation30] showing the methylation pattern for a region of Gl2 in roots from the wer mutant, detected using either the non-specific primers or the epidermal-specific primers. Each line represents one clone, and each circle one cytosine (from 5´, left to 3´, right). Blue, red and green correspond to cytosines in -CHG-, -CG- and – CHH- contexts, respectively. Filled circles indicate methylated cytosines, whereas empty circles represent unmethylated ones.](/cms/asset/7fdb1408-d2ad-409b-9b47-993043c3ac93/kepi_a_1565589_f0004_c.jpg)
For the sake of clarity, we quantified the methylation status of the 87 cytosines, firstly by determining the global methylation status of the gene region, and secondly by clustering the results according to the surrounding context: CHG, CG or CHH ( and ).
Table 1. Percentage of cytosines methylated in Gl2, total and grouped by their methylation context (CG, CHG or CHH) for WT, wer, cpc, and etc1 mutant plants, using either the epidermal-specific primers or the non-specific primers.
Figure 5. Percentage of total methylated cytosines in the analyzed portion of Gl2 and also grouped by their methylation context (-CG-, -CHG- and -CHH-, being H any nucleotide except for G) in WT, wer, cpc and etc1 plants, using either the non-specific primers (NSP) or the epidermal-specific primers (ESP). The bottom table resumes statistical significances: NS, non-significant, *p < 0.05; **p < 0.01; *** p < 0.001 (Kruskal-Wallis test, Dunns post-tests).
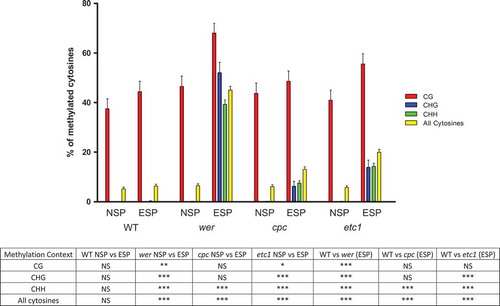
It is notable that the total (the three contexts combined) methylation value for each of the three mutants appears very different when the epidermal-specific primers were used instead of the non-specific ones. In the case of wer it rises from 6.51% to 43.30% (p < 0.001) using the specific primers, in cpc from 6.13% to 13.03% (p < 0.001), and in etc1 from 5.75% to 19.92% (p < 0.001, Kruskal-Wallis test, Dunns post-test).
When examining the three methylation contexts separately, significant differences were found for each of them in wer and etc1 genetic backgrounds. The strong effect caused by the mutations was evident only when the epidermal-specific primers were employed. In the case of cpc, the CHH context was the only one that showed a significantly different level of methylation between both sets of primers.
Also interesting is the comparison of the results obtained for the WT and each of the mutant plants, being the methylation level significantly higher in the second ones. This difference is mainly caused by the gain of methylation in non-CG contexts in the mutants, only perceived when the primers used were the specific ones as the non-specific primers revealed none or insignificant methylation for these contexts.
In addition, the methylation status observed in the CG context is also significantly different between WT plants and wer mutants (44.44% vs. 68.16% respectively, p < 0.001, Kruskal-Wallis test, Dunns post-test), but again only evident when using the specific primers.
Finally, it is worth mentioning that, in the case of roots from wer, cpc and etc1 plants, among the 12 clones obtained with the tissue-specific primers, two subpopulations could be distinguished: one showing high methylation present in all the contexts; and the other one displaying lower levels, derived only from cytosines in a CG context ().
Discussion
A common problem when exploring methylation patterns under different conditions is that experimental results usually derive from biological samples consisting of a mixture of cell types belonging to different tissues. As a consequence, differences in methylation marks inherent to individual tissues may be overlooked [Citation23,Citation24]. The experimental difficulty arises from the frequently cumbersome isolation of one particular tissue from the rest present in the entire organ. To circumvent this, we here presented a strategy to achieve comparative studies of tissue-specific methylation patterns of a gene under different experimental conditions without the need of laborious, time- consuming or expensive techniques as no physical dissection is involved. One limitation is that the approach is applicable only to biological models where the methylomes under study are already known. In this context, there exists a variety of platforms on the web providing such data [Citation13] and, considering the growing interest in epigenetic mechanisms in numerous species and environmental conditions, it is expected that new methylomes will be released in the future. If such a first requirement is met, differential specific methylation across tissues should occur and be perceived through the methylome data as well. If eventually, no inter-tissue differences appear, it is likely that there is no tissue-specific regulation of gene expression dependent on DNA methylation, so that a heterogeneous cell population might well provide fairly accurate data.
In addition, the method offers the advantage that it can be used with any biological model as the starting sample is genomic DNA, thus not depending on morphological features of the organism under study. It also avoids any dissection or cell disaggregation as the organ can be cut off and immediately frozen for DNA extraction afterwards. This way, not enough time is given for cells to trigger regulatory mechanisms in response to treatments likely to provoke damage and/or stress, hence altering the methylation pattern of certain genes. Another benefit is the possibility to use wild type individuals without the need of reporter transgenic lines to isolate tissues or sort out cell types. This is a bonus as reporter transgenics do not necessarily behave as wild type individuals do at the physiological level.
Besides, the strategy we have developed could provide a solution to epigenetic studies on cells with autofluorescence (for example, those containing chlorophyll), in which this feature interferes with the FACS methodology often used for cell isolation [Citation25].
By applying the method to monitor the methylation status of Gl2 in the root epidermis of wer, cpc and etc1 mutant plants, we showed that data differ greatly when using the tissue-specific versus the non-specific set of primers. This is relevant since epidermal cells in the root represent a low proportion of the total population of cells in the organ [Citation16] making possible that their methylation pattern is masked by those of the rest of the cell population if non-specific primers are used. We also found a high gain of methylation in the mutants in respect to the wild type plants, mainly concentrated in cytosines located in CHG and CHH contexts. Again, this important piece of information was only noticeable when using the tissue-specific set of primers.
Interestingly, for the case of the mutants, some of the clones analyzed display an epidermal-specific methylation in the CHG and CHH contexts, whereas the remaining show only the CG-type methylation. This can be accounted for by the fact that the epidermal tissue is composed of two distinct cell types: trichoblasts and atrichoblasts [Citation26]. It is then possible that the two observed patterns derive from these two cell populations as the original methylome [Citation17] does not discriminate between them.
A particular situation that can arise while applying the method is that the designed tissue-specific primers stop annealing the bisulfite-converted DNA sequence from individuals grown under an experimental condition different from the one under which the methylome was reported. However, this mishap could be a valuable result in itself, revealing that at least some of the cytosines in the primer-binding region changed their methylation status with potentially relevant outcomes in chromatin plasticity, gene regulation and splicing [Citation27]. Another worrying possibility is that the chosen primer-binding genomic regions change in some other tissues present in the sample in the same way as in the tissue originally targeted, with the consequent loss of the claimed specificity. However, although possible, it is unlikely as several specific methylated sites should necessarily be gained and/or lost simultaneously in two regions relatively far from each other. Nevertheless, despite this risk, we still believe that the strategy presented here could become a useful first round screening tool to detect differences in epigenetic landscapes between tissue types under new genetic backgrounds or environmental conditions. If those differences appear, then physical isolation endeavors to generate separate methylome data under those conditions would be worth the effort.
Conclusions
Here we show a new strategy for exploring tissue-specific methylation landscapes avoiding physical separation of the constituting tissues of an organ sample. This approach takes advantage of known distinct methylation signatures, under a particular condition. From the information on the compared methylomes between tissues or cell types, one can design a set of PCR primers that specifically match and amplify bisulfite-converted DNA of genomic regions of interest. Consequently, this strategy is a convenient, practical tool to reveal a particular cell- or tissue-specific methylation status of plant or animal genes under an environmental or genomic condition different to that under which a reported methylome was generated.
Methods
Plant growth
Arabidopsis thaliana Col-0, wer (SALK_114008), cpc (SAIL_310_C06) and etc1 (SALK_094648) plants were grown on 1% agar plates containing half-strength MS (Murashige & Skoog) media. Seeds were sterilized by soaking in 30% bleach solution for 12 min, and then washed three times with distilled water. Seeds were grown for 14 days in vertical position, with 22°C as mean temperature and a 16 hr light/8 hr darkness photoperiod.
DNA extraction
Roots were cut and immediately frozen in liquid nitrogen. After grinding with mortar and pestle, CTAB extraction buffer was added. Weigel and Glazebrook’s protocol [Citation28] was followed with some modifications. Briefly, samples in CTAB buffer were incubated at 65°C for 20 minutes and then submitted to chloroform extraction. DNA present in aqueous phase was precipitated using isopropanol and the pellet was then resuspended on TE buffer supplemented with RNase-A (1% volume). After 20 minutes incubation at 37°C, a second precipitation was performed using isopropanol (0.7 volume) and sodium acetate 3M pH = 5.8 (0.1 volume) overnight at −20°C. DNA was then pelleted, washed with 70% ethanol and resuspended in milliQ water.
Bisulfite treatment
DNA was digested with EcoRV restriction enzyme overnight at 37°C in order to obtain fragments between 500 and 2000 bp, for proper denaturation while bisulfite treatment. Frommer’s protocol [Citation9] was followed with some modification described in Gonzalez et Al. [Citation29]. Briefly, 2 µg of previously cut DNA was submitted to initial denaturation with NaOH 0.3 M for 20 min at 37°C followed by 2 minutes at 95°C. Then, we performed bisulfite conversion in a MJ Research PTC-100 thermocycler by means of 16 cycles of 59 min at 55°C followed by 1 min at 95°C in order to maintain DNA denaturation during bisulfite treatment. Finally, DNA was purified using Wizard DNA Clean Up System (Promega, cat Nº A7280) and then desulfonated by adding 0.3 M NaOH and incubating at 37°C for 20 min. As a control of unmethylated cytosine conversion, we examined a segment of Atp1, a mitochondrial gene that lacks methylation, so that all cytosines are expected to be converted to thymines.
Design of primers
For primers design, Wojdacz’s [Citation21] suggestions were followed. For fine tunning, we used Beacon Designer Software (http://www.premierbiosoft.com/molecular_beacons/index.html) in order to minimize the presence of secondary structures intra and inter- primers.
Post-bisulfite PCR
A 40-cycle program was performed in a Techne TC-512 thermocycler. An initial denaturation at 94°C for 5 minutes was followed by 40 cycles of denaturation (30 sec, 94°C), annealing (30 sec, temperature according to primer set) and elongation (90 sec, 72°C). Finally, an elongation step for 5 minutes at 72°C was set. All amplification reactions performed through this work were made as follows, in a final volume of 25 µl:
Taq DNA Polymerase (Invitrogen Cat Nº 11,615–010) 1.25 Units
6 µM Magnesium Chloride dNTP’s 0.2 µM
0.2 µM Forward Primer
0.2 µM Reverse Primer
75 ng bisulfite-treated DNA
The primers used are listed below:
Gl2 primers specific for epidermal tissue:
Fw: 5ʹ- GGTTCGATATTGGGTCGTTAT-3ʹ
Rev: 5ʹ- GAACACCAACTATATCGTATTTATATCTACAAAAACG −3ʹ
Amplicon length: 802 bp; annealing temperature: 57.3ºC.
Gl2 primers for all tissues:
Fw: 5ʹ- TTGAAGATGGTTTAGAGAATGAT −3ʹ
Rev: 5ʹ- TAACAAAACATCCCACTAATA −3ʹ
Amplicon length: 339 bp; annealing temperature: 55.1ºC.
Atp1 primers for conversion control:
Fw: 5ʹ- TGAGTAAAGATGTGTTGAAGTGAAAGTT −3ʹ
Rev: 5ʹ- ACTACCTACACCATACTAATCCAATCA −3ʹ
Amplicon length: 592 bp; annealing temperature: 62.5ºC
Subcloning and sequencing
For post-bisulfite PCR products cloning, pGEM-T easy vector (Promega, Cat. Nº A1360) was employed. The procedure was carried out as displayed in Gonzalez et Al. [Citation29]. Briefly, a ligation reaction was made employing 3:1 insert:vector relation. Transformation of E. coli DH5 alpha strain was made by heat shock at 42°C for 90 seconds. For selection of positive clones, a blue/white strategy was employed using ampicillin, IPTG and X-gal plates. The size of cloned product was determined by colony PCR using universal primers SP6 and T7 promoter. Minipreps were performed using the ADN PuriPrep-P Kit (Inbio Highway, Cat. N° K1207-100), following manufacturer indications. Sequencing of inserts was carry out using the Sanger method employing SP6 universal primer. A total of 12 clones were sequenced per combination of primer type (epidermal specific vs. non-specific primer) and for each plant line (Wild type, wer, cpc, etc1).
Methylation analysis
Sequences obtained were analyzed employing Kismeth software (http://katahdin.mssm.edu/kismeth/revpage.pl), developed by Gruntman et Al. [Citation30]. Methylation status of each cytosine was grouped according to methylation context (CG, CHG or CHH) and subsequently analyzed using GraphPad software (www.GraphPad.com). For comparisons between WT and mutant plants and between specific vs. non-specific primers, we employed the Kruskal-Wallis test and Dunns post-test with 95% significance level, as data are derived from a binomial distribution and do not pass the D’Agostino and Pearson normality test.
Wer, cpc and etc1 mutant root hair density phenotype determination
Wild type Col-0, wer mutant (SALK_114008), cpc mutant (SAIL_310_C06) and etc1 mutant (SALK_094648) Arabidopsis thaliana plants were grown for 10 days as indicated above. Root hairs were observed under an Olympus SZX7 zoom microscope equipped with a Q-Color5 digital camera with a 25X magnification. Photographs taken were analyzed using ImageJ software. The totality of root hairs observed in each photo was counted. The number of root hairs per root millimeter was determined.
Competing interests
All the authors declare that they have no competing interests.
Authors’ contributions
CCB and RMG (equal contributions) performed all the experimental work, contribute to experimental design and drafted the manuscript. NDI introduced the theoretical frame, coordinated the project and revised the manuscript. All authors read and approved the final manuscript.
Supplemental Material
Download PDF (76.6 KB)Acknowledgments
The authors are indebted to the following Argentinian institutions: CONICET (Consejo Nacional de Investigaciones Científicas y Tecnológicas) for salaries, fellowships and grants, ANPCyT (Agencia Nacional de Promoción Científica y Tecnológica) for grants and UBA (the University of Buenos Aires) for salaries and grants.
We wish to thank José Estévez (Fundación Instituto Leloir) for facilitate seeds and usage of the zoom microscope.
Disclosure statement
No potential conflict of interest was reported by the authors.
Supplementary material
Supplemental data for this article can be accessed on publisher’s website.
Additional information
Funding
References
- Jeltsch A. Beyond Watson and Crick: DNA methylation and molecular enzymology of DNA methyltransferases. ChemBioChem. 2002;3:382.
- Burggren WW, Crews D. Epigenetics in comparative biology: why we should pay attention. Integr Comp Biol. 2014;54:7–20.
- Fang J, Schneider B. Laser microdissection: a sample preparation technique for plant micrometabolic profiling. Phytochem Anal. 2014;25:307–313.
- Iyer-Pascuzzi AS, Benfey PN. Fluorescence-activated cell sorting in plant developmental biology. In: Hennig L, Köhler C, editors. Plant developmental biology. Methods in molecular biology (Methods and protocols). Vol. 655. Totowa (NJ): Humana Press; 2010. p. 313–319.
- Deal RB, Henikoff S. The INTACT method for cell typeg-specific gene expression and chromatin profiling in Arabidopsis thaliana. Nat Protoc. 2011;6:56–68.
- Endo M, Shimizu H, Araki T. Rapid and simple isolation of vascular, epidermal and mesophyll cells from plant leaf tissue. Nat Protoc. 2016;11:1388–1395.
- Svozil J, Gruissem W, Baerenfaller K. Meselect – A rapid and effective method for the separation of the main leaf tissue types. Front Plant Sci. 2016;7.
- van Beijnum JR, Rousch M, Castermans K, et al. Isolation of endothelial cells from fresh tissues. Nat Protoc. 2008;3:1085–1091.
- Frommer M, McDonald LE, Millar DS, et al. A genomic sequencing protocol that yields a positive display of 5-methylcytosine residues in individual DNA strands. Proc Natl Acad Sci. 1992.
- Capra E, Toschi P, Del Corvo MD, et al. Genome-wide epigenetic characterization of tissues from three germ layers isolated from sheep fetuses. Front Genet. 2017;8.
- Kundaje A, Meuleman W, Ernst J, et al.; Roadmap Epigenomics Consortium. Integrative analysis of 111 reference human epigenomes. Nature. 2015;518:317–330.
- Sánchez-Martín FJ, Lindquist DM, Landero-Figueroa J, et al. Sex- and tissue-specific methylome changes in brains of mice perinatally exposed to lead. Neurotoxicology. 2015;46:92–100.
- Song Q, Decato B, Hong EE, et al. A reference methylome database and analysis pipeline to facilitate integrative and comparative epigenomics. PLoS One. 2013;8:e81148.
- Di Cristina M, Sessa G, Dolan L, et al. The Arabidopsis Athb-10 (GLABRA2) is an HD-Zip protein required for regulation of root hair development. Plant J. 1996;10:393–402.
- Masucci JD, Rerie WG, Foreman DR, et al. The homeobox gene GLABRA2 is required for position-dependent cell differentiation in the root epidermis of Arabidopsis thaliana. Development. 1996;122:1253–1260.
- Dolan L, Janmaat K, Willemsen V, et al. Cellular organisation of the Arabidopsis thaliana root. Development. 1993;119:71–84.
- Kawakatsu T, Stuart T, Valdes M, et al. Unique cell-type-specific patterns of DNA methylation in the root meristem. Nat Plants. 2016;2:16058.
- Lee MM, Schiefelbein J. WEREWOLF, a MYB-related protein in Arabidopsis, is a position-dependent regulator of epidermal cell patterning. Cell. 1999;99:473–483.
- Wada T. Role of a positive regulator of root hair development, CAPRICE, in Arabidopsis root epidermal cell differentiation. Development. 2002;129:5409–5419. Available from http://dev.biologists.org/cgi/doi/10.1242/dev.00111
- Kirik V, Simon M, Huelskamp M, et al. The ENHANCER of TRY and CPC1 gene acts redundantly with TRIPTYCHON and CAPRICE in trichome and root hair cell patterning in Arabidopsis. Dev Biol. 2004;268:506–513.
- Wojdacz TK, Hansen LL, Dobrovic A. A new approach to primer design for the control of PCR bias in methylation studies. BMC Res Notes. 2008;1:54.
- Wada T, Tachibana T, Shimura Y, et al. Epidermal cell differentiation in Arabidopsis determined by a Myb homolog, CPC. Science. (80-). 1997;277: 1113–1116.
- Houseman EA, Kile ML, Christiani DC, et al. Reference-free deconvolution of DNA methylation data and mediation by cell composition effects. BMC Bioinformatics. 2016;17.
- Peng Q, Ecker JR. Detection of allele-specific methylation through a generalized heterogeneous epigenome model. Bioinformatics. 2012;28:i163-i171.
- Doležel J, Greilhuber J, Suda J. Flow cytometry with plants: an overview. In: Doležel J, Greilhuber J, Suda J, editors. Flow cytometry with plant cells: analysis of genes, chromosomes and genomes. 2007. Available from: https://onlinelibrary.wiley.com/doi/book/10.1002/9783527610921
- Bruex A, Kainkaryam RM, Wieckowski Y, et al. A gene regulatory network for root epidermis cell differentiation in Arabidopsis. PLoS Genet. 2012;8:e1002446.
- Tirado-Magallanes R, Rebbani K, Lim R, et al. Whole genome DNA methylation: beyond genes silencing. Oncotarget. 2017;8.
- Weigel D, Glazebrook J. Arabidopsis : a laboratory manual. Woodbury (NY): Cold Spring Harbor Laboratory Press; 2002.
- González RM, Ricardi MM, Iusem ND. Epigenetic marks in an adaptive water stress-responsive gene in tomato roots under normal and drought conditions. Epigenetics. 2013;8:864–872.
- Gruntman E, Qi Y, Slotkin RK, et al. Kismeth: analyzer of plant methylation states through bisulfite sequencing. BMC Bioinformatics. 2008;9:371.