
ABSTRACT
DNA hydroxymethylation has gained attention as an intermediate in the process of DNA demethylation. More recently, 5-hydroxymethylcytosine has been recognized as an independent epigenetic mark that can persist over time and that exerts influence on gene regulation and other biological processes. Deregulation of this DNA modification has been linked to tumorigenesis and a variety of other diseases. The impact of irradiation on DNA hydroxymethylation is poorly understood. In this study we exposed lung fibroblasts (IMR90) to 0.5 Gy and 2 Gy of X-rays, respectively. We characterized radiation induced changes of DNA hydroxymethylation 1 h, 6 h, 24 h and 120 h after exposure employing immunoprecipitation and subsequent deep sequencing of the genomic fraction enriched for hydroxymethylated DNA. Transcriptomic response to irradiation was analyzed for time points 6 h and 24 h post exposure by means of RNA sequencing. Irradiated and sham-irradiated samples shared the same overall distribution of 5-hydroxymethylcytosines with respect to genomic features such as promoters and exons. The frequency of 5-hydroxymethylcytosine peaks differentially detected in irradiated samples increased in genic regions over time, while the opposing trend was observed for intergenic regions. Onset and extent of this effect was dose dependent. Moreover, we demonstrated a biased distribution of 5-hmC alterations at CpG islands and sites occupied by the DNA binding protein CTCF. In summary, our study provides new insights into the epigenetic response to irradiation. Our data highlight genomic features more prone to irradiation induced changes of DNA hydroxymethylation, which might impact early and late onset effects of irradiation.
Introduction
DNA hydroxymethylation is a central player in replication-dependent and – independent DNA demethylation [1]. The presence of 5-hmC can reduce the activity of maintenance DNA methylase DNMT1 [Citation2–Citation4], which results in lower levels of 5-methylcytosine after successive rounds of replication. An active, replication independent mechanism of DNA demethylation involves dioxygenases of the Ten-eleven Translocation (TET) family [Citation5,Citation6], which oxidize methylcytosine to hydroxymethylcytosine, formylcytosine and finally carboxylcytosine [Citation7,Citation8]. The latter can then be removed by the concerted action of thymine-DNA glycosylase (TDG) and base excision repair. In this way, cells can meet the requirements of a dynamic regulation of DNA methylation levels needed to adequately respond to internal and external cues in a timely manner.
However, limiting the role of 5-hmC to an intermediate of DNA demethylation does not live up to its impact on various other biological processes [Citation9]. Although the genome-wide prevalence of 5-hmC is rather low when compared to 5-methylcytosine, its tissue specific accumulation at regulatory sequences and gene bodies, with peaks at splicing sites and a bias towards the sense strand, points to a function in gene regulation [Citation10]. A possible role in preventing the spread of DNA methylation into CpG islands of active genes and large segments of undermethylated DNA called ‘canyons’ has also been discussed [Citation11]. Moreover, DNA hydroxymethylation has been implicated in DNA repair [Citation12,Citation13]. Many of the biological consequences of DNA hydroxymethylation listed above may be attributed to increased polarity of hydroxymethylated DNA, which not only destabilizes the DNA double helix, but also alters site specific affinity of DNA binding proteins, i.e. promotes or prevents the binding of transcription factors and chromatin remodeling enzymes depending on the polarity of their binding domain [Citation14–Citation16].
Several studies have demonstrated that the degree of DNA hydroxymethylation is sensitive to internal factors as well as environmental stressors such as irradiation [Citation9,Citation17,Citation18]. Possible scenarios involving exposure to rather high doses of radiation range from medical applications like radiation therapy to the fortunately rare events of nuclear power plant accidents or terroristic attacks. However, according to the few reports available in literature, irradiation associated changes of DNA hydroxymethylation seem to be variable and dependent on various factors including radiation quality [Citation17,Citation19–Citation22]. This variability suggests a complex and context dependent regulation of 5-hmC in response to irradiation, which, however, is poorly understood. In part, this lack of understanding is owed to the fact that the majority of studies only monitored global levels of 5-hmC without taking into account its regional distribution. Yet, the identification of regional preferences of 5-hmC promises new insights into the epigenetic response to irradiation and the regulation of DNA hydroxymethylation in general as it would highlight those genomic elements characterized by higher susceptibility to 5-hmC associated changes of DNA properties such as structural stability, accessibility and binding affinity for proteins. In consequence, this knowledge could also contribute to a better understanding of the mechanisms leading to irradiation induced diseases as non-physiological deregulation of global 5-hmC levels and its genome-wide distribution has already been linked to tumorigenesis [Citation23–Citation28] and various other diseases [Citation29–Citation31].
Against this background we investigated the existence of dose, time and region specific effects of irradiation on DNA hydroxymethylation in human fibroblasts of the lung.
Results
Genome-wide distribution of 5-hmC in irradiated and non-irradiated samples
Distribution of 5-hmC across the genome was analyzed by immunoprecipitation and deep sequencing of the genomic fraction enriched for hydroxymethylated DNA. Supplementary Figure 1 provides a schematic overview of the experimental design. The number of sequenced fragments after filtering is provided in Supplementary Table 1. The number of 5-hmC peaks common to exposed and unexposed samples and differentially called peaks as detected by MACS2 are provided in . In line with the vast majority of common peaks (), Pearson correlation between replicates was 0.9717 -/+ 0.0228 based on a comparison of bam.files at 1 kb resolution. Supplementary Figure 2 shows the enrichment of hydroxymethylated DNA both on the example of a region of chromosome 10 and genomewide employing the ‘fingerprint’ feature of deepTools [Citation32].
Table 1. Numbers of differentially and common peaks after exposure to 0.5Gy and 2Gy.
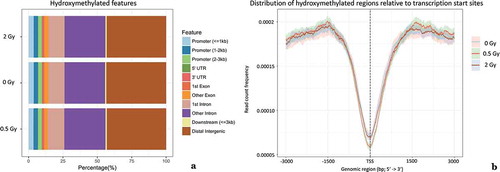
Functional annotation analysis based on the complete set of 5-hmC peaks corroborated the previously reported distribution of DNA hydroxymethylation with respect to promoters, introns, exons, UTRs and distal intergenic regions (). 5-hmC peaks were 4.47 times enriched at promoters (9.75% ± 0.17 of peaks were identified within 3 kb next to promoters, which approximately cover ~ 2.18% of the human reference genome). A distinct drop of frequency has been observed in the immediate vicinity of the transcription start site (exemplarily depicted in ). A similar dip was also detected in a public data set (human lymphoblastoid cell line), which we have analyzed the very same way for comparison and validation (Supplementary Figure 3B).
Figure 1. Relative distribution of 5-hmC peaks with respect to genomic features (a). Comparative visualization of the percentage of DNA hydroxymethylation peaks in irradiated (six hours after exposure to 0.5 Gy and 2 Gy) and non-irradiated samples. (b). Degree of DNA hydroxymethylation within 3 kb around transcription start sites (TSS) indicated by read count frequency. In close vicinity to TSS a low read count frequency of hydroxymethylated peaks could be found. 95% confidence interval is represented by opaque lines. Results for other time-points were similar (data not shown).
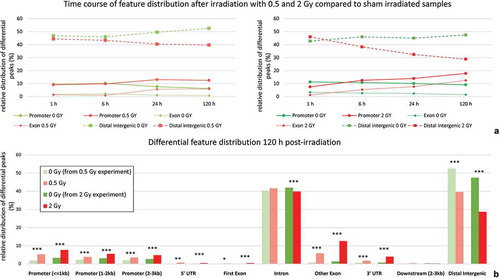
Proceeding from the complete set of DNA hydroxymethylation peaks, we failed to reveal any dose dependent bias with respect to functional annotations. This changed when focusing on the subset of differential peaks, i.e. regions with significant accumulation of 5-hmC in irradiated samples not present in the corresponding sham irradiated controls and vice versa. This restricted analysis unearthed that the number of differential peaks increased over time in genic regions after exposure, while it decreased in distal intergenic regions (). The effect was most prominent at the end of the observation period 120 h post irradiation. A detailed view on DNA hydroxymethylation peaks in the context of genic and intergenic segments for this time point is provided for 0.5 Gy and 2 Gy in .
Figure 2. Distribution of differential hydroxymethylation in genic and intergenic regions over time.
(a) relative frequencies of differential hydroxymethylation peaks in samples exposed to 0.5Gy and 2 Gy, respectively, in comparison to differential peaks present in corresponding sham irradiated controls for time-points 1 h, 6 h, 24 h and 120 h after exposure. (b) detailed view of differential peak frequencies for time-point 120h after exposure (* < 0.05; ** < 0.01; *** < 0.001; representing significance levels for comparison to matching sham control.)
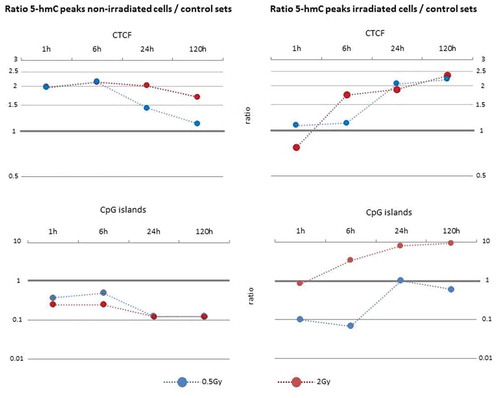
For further correlation of our datasets with genomic annotations we have taken advantage of EpiExplorer [Citation32]. This web based tool facilitated the intersection of datasets on differential peaks and public datasets, among them several data generated with the same cell line used in this study. The outcome of this analysis is provided in supplementary Table 2. Selected features are visualized in . In light of recent reports on 5-hmC rims at the boundaries of large hypomethylated regions and superenhancers [Citation33], we tested whether differential peaks show a non-random location with respect to canyons [Citation34] (large hypomethylated regions) and superenhancers [Citation35] by means of the Kolmogorow-Smirnow test implemented in the GenometriCorr [Citation36] package. As recommended by the authors of this tool, the analysis was done twice. The first time differential peaks present 24 h after exposure with 2 Gy constituted the query set and canyons/superenhancers the reference set, the second time the reciprocal combination was used. Using differential peaks identified in the unexposed sample as the query set this analysis revealed a non-random location with respect to ‘canyons’ p < 0.05 (‘canyons’ as query: p < 0.001) and ‘superenhancers’ p < 0.001 (‘superenhancers’ as query: p < 0.001). For samples exposed to 2 Gy: ‘differential peaks’ Vs. ‘canyons’ p = 0.908547 (‘canyons’ as query: p < 0.05) and ‘differential peaks’ Vs. ‘superenhancers’ p < 0.001 (‘superenhancers’ as query: p < 0.05).
Figure 3. Overrepresentation analysis of CpG islands and CTCF binding sites within the set of differential 5-hmC peaks. See Methods for details.
Radiation induced gene expression changes
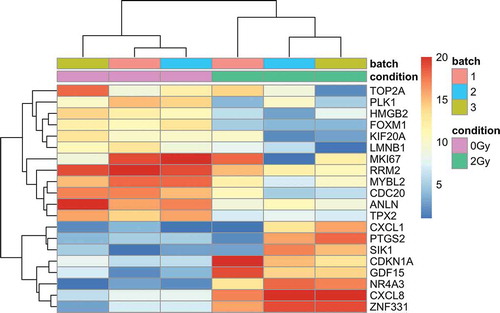
Deep sequencing of RNA derived from three replicate experiments was performed to characterize irradiation associated alterations of gene expression patterns 6 h and 24 h after exposure to 0.5 Gy and 2 Gy, respectively. These time-points have been chosen because of the prominent changes in 5-hmC distribution both in samples exposed to 0.5 Gy and 2 Gy. The number of significantly deregulated genes was remarkable small after exposure to 0.5 Gy. At time point 6 h, only 11 and 14 genes were significantly up- and downregulated, respectively. These numbers lowered to nine and one gene at time point 24 h. Small numbers of deregulated genes were also encountered 6 h after exposure to 2 Gy (up-regulated n = 24; down-regulated n = 3), whereas the count of deregulated genes raised to 38 up- and 248 down-regulated genes 24 h post exposure with 2 Gy. Gene set enrichment analysis revealed significant overrepresentation of biological processes and pathways only for the 2 Gy experiment at time point 24 h, e.g. chromosome segregation (p = 1.73E-22), regulation of cell cycle (p = 7.41E-18) or cell proliferation (p = 1.10E-03). A list of most overrepresented biological processes and pathways is provided in supplementary Table 3. Consequently, unsupervised hierarchical clustering based on 20 deregulated genes with highest variability across all samples managed to successfully discriminate irradiated from corresponding sham-irradiated samples for time point 24 h of the 2 Gy experiment, but for none of the other samples (). Proceeding from the gene set identified at time point 24 h of the 2 Gy experiment we have observed significant correlation of upregulated gene expression and both 5-hmC peaks emerging in irradiated samples of 5-hmC (p = 0.000116245) and those disappearing in irradiated samples (p = 0.00806326). No significant interdependency of gene regulation and DNA hydroxymethylation was observed for the subset of downregulated genes (p = 0.38858 and p = 0.706962). The small number of deregulated genes limited our options to investigate the correlation of gene regulation and changes in DNA hydroxymethylation for other exposures and time points.
Figure 4. Hierarchical clustering of 20 genes with highest inter-sample variance of gene expression 24h after exposure to 2Gy. Replicate (batch) and condition (0 and 2Gy) are indicated on top. Coloring of gene expression status based on normalized read counts by means of DESeq2.
As to genes involved in DNA (de)methylation DNMT1 and TET2 were the highest expressed genes within their respective gene family. Both genes also showed the clearest trend of deregulation in response to irradiation 24 h after exposure to 2 Gy. However, none of the two genes exceeded our conservative threshold of a log2 transformed fold change beyond 1 and −1, respectively. Downregulation of DNMT1 was judged significant by DESeq2 (adjusted p = 1.37E-13), but the log2 transformed fold change only amounted −0.80 (Supplementary Figure 4).
Validation assays and comparison to public data sets
Specificity of antibodies, in particular its ability to discriminate methylcytosine from hydroxymethylcytosine, and the immunoprecipitation protocol were verified by dot blot assay and immunoprecipitation using a mixture of hydroxymethylated and methylated PCR amplicons, respectively. Both experiments confirmed the feasibility of the antibody to specifically detect and pull down hydroxymethylated DNA (Supplementary Figure 5).
A direct comparison of public data on DNA hydroxymethylation in a human lymphoblastoid cell line with our own datasets demonstrated the shared genomic distribution characteristic of 5-hmC peaks and the lack of hydroxymethylation in the immediate vicinity of the transcription start site (Supplementary Figure 3A and B).
Proliferation rate and global changes in DNA hydroxymethylation after irradiation
Changes in proliferation rate induced by different doses of X-ray irradiation were tested by means of a colorimetric assay which measures metabolic activity. IMR90 cells showed a significant decrease of metabolic activity only for time point 120 h post-irradiation with 2 Gy (2 Gy at 120 h Vs. 0 Gy at 120 h p < 0.001). Results are summarized in Supplementary Figure 6.
Enzyme-linked Immunosorbent Assay (ELISA) was used to monitor irradiation associated changes in the overall degree of DNA hydroxymethylation. No significant differences were observed between irradiated samples and corresponding sham-irradiated controls. However, it has to be stated that standard deviation was considerably high for both biological and technical replicates (2 Gy 120 h post-irradiation ± 0.066; 2 Gy 24 h post-irradiation ± 0.008). Hence, these results should be interpreted with care. Similar problems with evaluating the overall degree of DNA hydroxymethylation by ELISA were also encountered by others [Citation20].
Discussion
With this study we aimed to identify region specific changes of DNA hydroxymethylation after exposure to X-ray radiation in order to gain further insights into the radiation induced epigenetic response.
Overall genome wide distribution of 5-hmC peaks is hardly affected by irradiation
The observed genome-wide distribution of 5-hmC was congruent with previously reported results obtained in other cell lines; e.g. characteristic enrichment around promoters with absence of 5-hmC in the immediate vicinity of the transcription start site [Citation10,Citation37,Citation38]. This supports the notion that, although the absolute degree of DNA hydroxymethylation can considerably differ between cell types and cell lines, its relative distribution across the genome seems less variable [Citation17,Citation39]. In the overall picture, neither exposure to 0.5 Gy nor to 2 Gy did significantly alter this pattern of 5-hmC distribution. This was not unexpected given that comparative analysis of DNA hydroxymethylation proved the vast majority of 5-hmC peaks to be common in exposed samples and their corresponding unexposed controls. Remarkably, numbers of differential 5-hmC peaks, i.e. those peaks exclusively observed in either exposed or unexposed controls, were repeatedly higher in unexposed samples. This could suggest either a preponderance of regional dispersion of 5-hmC or a general increase of intercellular heterogeneity in 5-hmC distribution in response to irradiation.
Differential 5-hmC peaks show opposing trends in genic and intergenic regions
In line with the assumption that the large fraction of common 5-hmC peaks may mask subtle irradiation triggered effects, the analysis limited to differential peaks unveiled a dose and time dependent regional bias. The percentage of sites found with significantly higher levels of 5-hmC in relation to unexposed samples increased in promoters and intragenic regions over time, while the opposite trend was found for distal intergenic regions. In previous studies intragenic hydroxymethylation has been reported to be mainly positively correlated with gene expression [Citation40,Citation41], although, several factors have been identified that can complicate this relationship, including cell type, promoter state (active, poised or inactive) and the transcription level of a given gene [Citation37,Citation39,Citation42–Citation45]. The finding of our study that regulatory elements of upregulated genes are significantly correlated with 5-hmC differential peaks both, lost and gained in response to irradiation, may be a reflection of this complex and context dependent relationship as previously described. In this context it is noteworthy that differential peaks were also non-randomly positioned towards superenhancers, which all together merits further functional investigations.
Over- and underrepresentation of CTCF and CpG islands in differential 5-hmC peaks
In order to identify specific genomic characteristics over- or underrepresented within the set of differential peaks for each time-point and dose we compared intervals affected by 5-hmC alterations with a corresponding control set of randomly shuffled intervals of same number and length. Two features with prominent over- and underrepresentation, respectively, are the DNA binding factor CTCF and CpG islands.
CTCF has been implicated in gene regulation and higher order chromatin conformation, where it is instrumental in the formation of DNA loops. Based on genomic intervals previously shown to be occupied by CTCF in IMR90, our analysis demonstrate that sites affected by a gain or loss of 5-hmC do have a higher chance to overlap with CTCF sites when compared to randomly shuffled control intervals. Recently, it has been demonstrated that CTCF associates with enzymatically active TET [Citation46] and it has been speculated that in this way CTCF binding can promote active DNA demethylation [Citation47]. Alternatively, it has been hypothesized that TET mediated conversion of 5-mC to 5-hmC ease the displacement of nucleosomes by CTCF and in this way its binding to DNA [Citation48]. Irrespective of the question whether CTCF binding is cause or consequence of DNA hydroxymethylation, the overrepresentation of differential peaks overlapping CTCF bound sites highlights the dynamic of 5-hmC at these loci and points at the possible implications irradiation associated 5-hmc alteration might have for DNA looping and higher order chromatin conformation.
A different situation was encountered with CpG islands, which are known to be generally depleted of 5-hmC [Citation49]. Accordingly, hardly any 5-hmC peak exclusively detected in non-irradiated samples overlapped a CpG island. However, upon irradiation, an increasing fraction of emerging differential peaks intersected with CpG islands, resulting in up to 9.4 times overrepresentation in comparison to the randomly shuffled control intervals (15 vs 143). Apart from activation of genes silenced by DNA methylation, this could reflect the cellular attempt to protect CpG islands from irregular DNA methylation or to re-establish pre-exposure methylation state; both in line with the proposed role of 5-hmC in preventing the improper spread of DNA methylation into CpG islands and other hypomethylated regions.
Dependency of differential peak distribution on dose and time post exposure
In general, samples exposed to 0.5 Gy and 2 Gy shared the same trends of 5-hmC alterations in response to irradiation, although the effects were more prominent and -for some features- more immediate or longer lasting in samples exposed to 2 Gy. Interestingly, samples analyzed 1 h after irradiation with 2 Gy behaved not in line with the common trend. Possible causes underlying this particularity could be fast acting chemical conversion associated with oxidative stress or epigenetic modifications associated with DNA repair [3-5], [Citation30,Citation31]. Notably, Wang and colleagues have reported that UV-B induced DNA damage triggers an increase of 5-hmC, which is most prominent in early phases of DNA damage response and starts to decrease already 3 h after exposure [Citation50].
Many effects observed in this study were most prominent at time point 120 h post exposure suggesting that irradiation induced alterations of 5-hmC may persist beyond the observation period. Further studies with extended observation periods will be needed in order to evaluate the potential involvement of 5-hmC alterations in the long-term consequences of an irradiation event in the epigenome.
In summary, it can be stated that the impact of irradiation on DNA hydroxymethylation is subtle within the investigated cell line. However, those regions affected by 5-hmC alterations are non-randomly distributed and exhibit preferences for several genomic features. As ionizing radiation is a common external stressor not only in the case of possible disastrous scenarios (e.g. nuclear power plant accident) but also widely administered in radiological therapy and diagnostic we hereby provide a starting point for further follow-up studies to elucidate the epigenetic response to radiation.
Methods
Irradiation of cells
Primary human lung fibroblasts (IMR-90, adherent cells) were obtained from Corriell Institute for medical Research (Camden, New Jersey, USA). IMR90 is a well investigated cell line with cells cultivated at 37°C/5% CO2 in Eagle´s Minimum Essential Medium, respectively. For each time-point and dose 10 million cells were irradiated with an x-ray beam at room temperature with 240 kV tube current (YXLON Maxishot; Hamburg, Germany) filtered with 3 mm beryllium. Absorbed dose was measured with a PTW Unidos dosimeter (PTW Freiburg GmbH, Germany). Dose rate was 1 Gy/min at 13 mA. No fresh medium was added to cells after irradiation. After exposure to either 0.5 Gy or 2 Gy one flask containing about 1 million cells was washed two times in PBS at time points 1 h, 6 h, 24 h, 48 h and 120 h post exposure and shock frozen in liquid nitrogen before storage at −80°C. An additional flask of cells was reserved for RNA isolation at time points 6 h and 24 h. Apart from being irradiated, sham irradiated controls were treated the very same way, e.g. taken out of the incubator for the same time span and brought to the same room. A scheme summarizing the workflow of this study is provided in Supplementary Figure 1.
DNA-hydroxymethylation library preparation and immunoprecipitation
DNA was isolated from cell pellets using a phenol-free approach (Qiagen Genomic DNA Isolation Kit Mini for Blood and Tissue, Version 04/12, Cat.-No. 69504). RNA was removed by incubation with 1 µg RNAse A 10 mg/ml at 37°C for 30 minutes. DNA concentration was determined by means of a Qubit 3.0 Fluorometer (Thermo Scientific, Waltham, MA, USA). DNA was randomly sheared using the Covaris M220 according to the manufacturers’ protocol (Covaris protocol truChIP™ Chromatin Shearing Reagent Kit, PN 010179, Rev C 15 August 2013) using the following parameters: average incident power = 10 W; Peak Incident power = 50 W; Duty factor = 20%; Cycles/Burst = 200; Duration = 80 s. The optimal fragment length of 300–500 bp was verified by gel electrophoreses.
Given the fact that successful immunoprecipitation of hydroxymethylated DNA depends on denaturation of DNA, in the workflow followed in this study, library preparation precedes the immunoprecipitation step. Sequencing libraries were prepared with the iDeal Library preparation kit (Diagenode, including Primer Set 1, Version 1/11_14, Cat.-No. C05010020) and hydroxymethylated library fragments were enriched using the hMeDIP kit (Diagenode, monoclonal mouse antibody, Version 2 09.10, Cat.-No. C02010031). Immunoprecipitated DNA was purified employing the IPure kit (Diagneode, Version 2 I 07.15, Cat.-No.C03010015). For library amplification we performed 12 PCR-cycles in accordance to the manufacturer’s protocol. For each sequencing library range of fragment lengths was determined with Agilent Bioanalyzer (Agilent 2100 Bioanalyzer, Agilent, Santa Clara, CA, USA) and DNA concentration was measured with a Qubit 3.0 Fluorometer (Thermo Scientific, Waltham, MA, USA).
Deep sequencing and bioinformatic analysis of hMeDIP output
Libraries were diluted to a concentration of 20 pM after denaturation with NaOH and further processed in accordance to the manufacturers’ recommendations (NextSeq System Denature and Dilute Libraries Guide, Illumina, San Diego, CA, USA) Document # 15048776 v02, January 2016). Samples were sequenced with an Illumina NextSeq500 sequencer with 2 × 150 bp paired end reads.
After conversion of Illuminas proprietary bcl files to FASTQ format, FASTQ files were aligned to reference genome hg19 (human_g1k_v37.fasta) using BWA MEM (version 0.7.15) [Citation51]. BAM files were quality filtered (QC score > 30), sorted and indexed with samtools (version 1.5) [Citation52] Peak calling was performed using MACS2 default settings for paired end reads following the workflow of Zhang et al. [Citation53] based on two merged replicate experiments (Command line input: macs2 callpeak -t replicate1.bam replicate2.bam -c input1.bam input2.bam input3.bam input4.bam -f BAMPE -g hs -n results_name -B -q 0.01.) Resulting .narrowpeak files were annotated and analyzed with ChIPseeker [Citation54] using R (version 3.4.2) [Citation55]. Differential peak calling between samples was performed using the bdgdiff command in MACS2 (Command line input: macs2 bdgdiff – t1 sample1_peaks_treat_pileup.bdg – c1 sample1_peaks_control_lambda.bdg – t2 sample2_peaks_treat_pileup.bdg – c2 sample2_peaks_control_lambda.bdg – d1 < number of minimum reads after filtering sample1> – d2 < number of minimum reads after filtering sample2> -g 60 -l 200 – o-prefix results_name). Resulting peak files were annotated and visualized using ChIPseeker [Citation54] and associated R packages. All ChIPseeker results refer to hg19 reference genome [Citation56] and calculations were based on n = 22801 genes as listed in the annotation file used by ChIPseeker. For further visualization we used Microsoft Excel 2010 and GIMP (version 2.8.4). Correlation of differentially hydroxymethylated regions with public data of super-enhancer [Citation35] and partly methylated regions [Citation34] within the human genome was analyzed by means of the GenometriCorr package in R [Citation36]. A p-value < 0.05 was considered significant for all statistical tests.
EpiExplorer [Citation32] was used to evaluate the intersection of differentially hydroxymethylated regions with additional (epi)genomic characteristics including conservation, CpG islands and chromatin state as previously identified in IMR90 by the ENCODE project (Tier 2) [Citation57,Citation58]. Intersections were counted if at least 50% of two intervals were overlapping. For each time-point and condition a corresponding control set comprising the same number of intervals with similar range distribution, but randomly shuffled along the genome, was used to determine overrepresentation of 5-hmC within a given feature.
RNA sample acquisition and deep sequencing
RNA isolation was performed with the RNeasy Mini kit (Qiagen, RNeasy Mini Handbook 06/2012) following the manufacturer’s protocol. RNA concentration was determined by means of a Qubit 3.0 Fluorometer (Thermo Scientific, Waltham, MA, USA) and quality was assessed using Bioanalyzer (Agilent 2100 Bioanalyzer, Agilent, Santa Clara, CA, USA). Only RNA with RNA integrity number ≥ 9 were used for RNASeq.
RNA Seq library preparation was performed with Illumina TruSeq® Stranded mRNA Sample Preparation Kit (Cat.-No. RS-122-9004DOC, Part # 15031047 Rev. E, 10/13, Index Primers Set 1). Library fragment length was determined with Agilent Bioanalyzer 2100 (Agilent, Santa Clara, CA, USA) and concentration was measured with a Qubit 3.0 Fluorometer (Thermo Scientific, Waltham, MA, USA). Libraries were sequenced with 2 × 75 bp paired end reads following the protocols for the NextSeq500 sequencing platform (NextSeq 500 High Output Kit 2x75bp; NextSeq System Guide; NextSeq Denature and Dilute Libraries Guide; Illumina, San Diego, CA, USA, Document # 15048776 v02, Document # 15046563 v02).
RNASeq data analysis and interpretation
For visual inspection of RNASeq results within the IGV genome viewer [Citation59], FastQ files were aligned to reference genome hg19 using STAR (version 2.5) [Citation60], followed by indexing and sorting of .bam files with samtools (version 1.5) [Citation52]. For differential gene expression analysis we followed the workflow described by Love et al [Citation61]. In brief, sequence reads were aligned to the human transcriptome (Homo_sapiens.GRCh37.67) with Salmon (version 0.8.1) [Citation62] and counted by means of a python script provided within the RSeqQC package [Citation63]. Resulting data was summarized into matrices using tximport (version 1.4.0) [Citation64] and analyzed for differential gene expression using the default settings of DESeq2 (version 1.16.1) [Citation65]. Genes were assumed to be differentially expressed with log2 fold changes of FPKM ratios > 1 and < −1 (fragments per kilobase per million mapped fragments) and FDR < 0.1. Results were exported with DESeq2 and the R package ‘reporting tools’ (version 2.1.16.0) [Citation66].
Overrepresentation of biological processes and pathways within the lists of deregulated genes was tested employing the web-based tool PANTHER (Analysis Type: PANTHER Overrepresentation Test (Released 20171205); Annotation Version and Release Date: PANTHER version 13.0 Released 2017-11-12; Analyzed List: gene results (Homo sapiens), Reference List: Homo sapiens (all genes in database); Test Type: FISHER, False discovery rate (FDR) < 0.05; PANTHER GO-Slim Biological Process; PANTHER reactome pathways) [Citation67].
Interdependencies of changes in gene expression and DNA hydroxymethylation were tested by means of the Kolmogorov-Smirnov test implemented in the GenometriCorr package in R [Citation36]. This test proceeds on the assumption that spatial distances of independent features should follow a normal distribution. We downloaded the coordinates of transcription start sites of all those genes identified as significantly up- or downregulated and tested the distribution of their distances to the set of differentially hydroxymethylated peaks identified in hMeDIP experiments of the corresponding time point. A low Kolmogorov-Smirnov p-value indicate a non-random distribution of the query population with respect to the reference point. A p-value < 0.05 was considered significant.
Global DNA-hydroxymethylation analysis with ELISA
ELISA was performed using a 5-hmc-DNA-ELISA-Kit following the manufacturer’s protocol (Zymo Research Quest 5-hmC™ DNA ELISA Kit, Version 1.5.0, Cat.-No. D5425). In brief, for each sample 100ng of DNA dissolved in 1x ELISA buffer were pipetted into one well of a 96 well plate, which was coated with Anti-5-Hydroxymethylcytosine polyclonal antibody. DNA was denatured at 98°C for 5 min and transferred to the ELISA plate. After incubation for 1 h at 37°C, washing and blocking, a secondary antibody with horse reddish oxidase was added and incubated for further 1 h at 37°C. Absorbance was recorded after washing and incubation with HRP developer solution with an ELISA plate reader (Multiskan FC, Thermo Scientific, Waltham (MA), USA). The assay was performed twice with biological replicates. On each plate each sample was present in three technical replicates. Parametric data was analyzed with two-tailed Students’s t-test whereas for non-parametric data the Mann-Whitney rank sum test was used. To determine correlation between two groups we used Fisher Exact test (Sigma Plot 13.0; Systat Software Inc., Erkrath, Germany). A p-value < 0.05 was considered significant for all statistical tests.
Validation assays
Specificity of the anti-5-hydroxymethylcytosin antibody and the immunoprecipitation protocol was tested by means of dot blots and by immunoprecipitation of hydroxymethylated DNA out of a mix of methylated and hydroxymethylated PCR amplicons. For this purpose, two PCR amplicons of different size were synthesized using a nucleotide mix containing either 5-hmC or 5-mC (Zymo Research, Irvine, CA, USA). For dot blot analysis both amplicons were separately blotted onto a nitrocellulose membrane (Whatman, Merck, Darmstadt, Germany) and detected by the anti-5-mC and 5-hmC antibody (see below), respectively. For testing the specificity of immunoprecipitation, 5-hmC and 5-mC modified amplicons were mixed and pulled down with either the MagMeDIP kit (Diagenode, monoclonal 5-methyl cytidine antibody, clone 33D3, Cat. #K04323001) targeting methylated DNA or the hMeDIP kit (Diagenode, monoclonal mouse antibody, Version 2 09.10, Cat.-No. C02010031) targeting hydroxymethylated DNA. Immunoprecipated DNA was subsequently analyzed with the Agilent Bioanalyzer 2100 (Agilent, Santa Clara, CA, USA).
Enrichment of DNA hydroxymethylation by means of immunoprecipitation was visualized by taking advantage of the ‘fingerprint’ feature implemented in deepTools [Citation32]. We employed this feature to count reads per 1kb bin, to sort all bins depending on read counts and to plot the cumulative read coverages for a comparison of one randomly selected ChIP experiment and one Input. deepTools was also used to calculate Pearson correlation of bam.files derived from biological replicate experiments (1kb bins). We further compared our data with public data on DNA hydroxymethylation of a human lymphoblastoid cell line (SRR1781972) [Citation68], which we have downloaded as FASTQ files from SRA and processed the very same way as the samples of this study. Comparative analysis of hydroxymethylation peak frequencies with respect to promoters, exons, introns, UTRs and intergenic regions was also performed for these two datasets with ChIPseeker as described above. A p-value < 0.05 was considered significant for all statistical tests.
Availability of sequencing data
Sequencing data discussed in this publication have been deposited in NCBI’s Gene Expression Omnibus [Citation69] and are accessible through GEO Series accession number GSE111437.
Proliferation assay
Irradiation induced changes of cell-proliferation were monitored 6, 24, 48 and 120 h after exposure with 0.5 and 2 Gy X-ray irradiation, respectively, by means of a colorimetric assay (CellTiter 96®AQueous One Solution Cell Proliferation Assay, Promega Corporation, Madison, WI USA; protocol TB245, revised 12/12, Cat.-No. G3580). Changes of proliferation rate were not measured 1 h after irradiation as this assay is based on the metabolization of a tetrazolium compound for 4 h. For each sample we analyzed 20000 cells in 21 replicates. In addition three positive controls (cells treated with 50 µM DMSO) and three negative controls (medium without cells) were included in the analysis. Read out of absorbance at 490 nm was done with a Multiskan FC plate reader (Thermo Scientific, Waltham (MA)). Student´s t test was used for calculating significance (Sigma Plot 12.5; Systat Software Inc., Erkrath, Germany). A p-value <0.05 was assumed significant.
Supplemental Material
Download Zip (1 MB)Acknowledgments
We are grateful for the technical assistance of Palnek A, Couson B and Chen Y.
Disclosure statement
No potential conflict of interest was reported by the authors.
Supplementary Material
Supplemental data for this article can be accessed here.
Related Research Data
References
- Bochtler M, Kolano A, Xu GL. DNA demethylation pathways: additional players and regulators. BioEssays. 2017;39(1):1–13.
- Inoue A, Zhang Y. Replication-dependent loss of 5-hydroxymethylcytosine in mouse preimplantation embryos. Science. 2011;334(6053):194.
- Ji D, Lin K, Song J, et al. Effects of Tet-induced oxidation products of 5-methylcytosine on Dnmt1-and DNMT3a-mediated cytosine methylation. Mol Biosyst. 2014;10(7):1749–1752.
- Valinluck V, Sowers LC. Endogenous cytosine damage products alter the site selectivity of human DNA maintenance methyltransferase DNMT1. Cancer Res. 2007;67(3):946–950.
- Ito S, D’alessio AC, Taranova OV, et al. Role of Tet proteins in 5mC to 5hmC conversion, ES-cell self-renewal and inner cell mass specification. Nature. 2010;466(7310):1129.
- Tahiliani M, Koh KP, Shen Y, et al. Conversion of 5-methylcytosine to 5-hydroxymethylcytosine in mammalian DNA by MLL partner TET1. Science. 2009;324(5929):930–935.
- Ito S, Shen L, Dai Q, et al. Tet proteins can convert 5-methylcytosine to 5-formylcytosine and 5-carboxylcytosine. Science. 2011;333(6047):1300–1303.
- He Y-F, Li B-Z, Li Z, et al. Tet-mediated formation of 5-carboxylcytosine and its excision by TDG in mammalian DNA. Science. 2011;333(6047):1303–1307.
- Dao T, Cheng R, Revelo M, et al. Hydroxymethylation as a novel environmental biosensor. Curr Environ Health Rep. 2014;1(1):1–10.
- Wen L, Li X, Yan L, et al. Whole-genome analysis of 5-hydroxymethylcytosine and 5-methylcytosine at base resolution in the human brain. Genome Biol. 2014;15(3):R49.
- Jeong M, Sun D, Luo M, et al. Large conserved domains of low DNA methylation maintained by Dnmt3a. Nat Genet. 2014;46(1):17.
- Shukla A, Sehgal M, Singh TR. Hydroxymethylation and its potential implication in DNA repair system: a review and future perspectives. Gene. 2015;564(2):109–118.
- Kantidze OL, Razin SV. 5-hydroxymethylcytosine in DNA repair: a new player or a red herring? Cell Cycle. 2017;16(16):1499–1501.
- Ancey P-B, Ecsedi S, Lambert M-P, et al. TET-catalyzed 5-hydroxymethylation precedes HNF4A promoter choice during differentiation of bipotent liver progenitors. Stem Cell Reports. 2017;9(1):264–278.
- Iurlaro M, Ficz G, Oxley D, et al. A screen for hydroxymethylcytosine and formylcytosine binding proteins suggests functions in transcription and chromatin regulation. Genome Biol. 2013;14(10):R119.
- Spruijt CG, Gnerlich F, Smits AH, et al. Dynamic readers for 5-(hydroxy) methylcytosine and its oxidized derivatives. Cell. 2013;152(5):1146–1159.
- Impey S, Pelz C, Tafessu A, et al. Proton irradiation induces persistent and tissue-specific DNA methylation changes in the left ventricle and hippocampus. BMC Genomics. 2016;17(1):1.
- Camarena V, Sant DW, Huff TC, et al. cAMP signaling regulates DNA hydroxymethylation by augmenting the intracellular labile ferrous iron pool. Elife. 2017;6:e29750.
- Abilmazhinova A, Zhabagin M, Rakhimova S, et al. Gene expression and methylation profiles as a biomarker for human radiation exposure. 2014.
- Maierhofer A, Flunkert J, Dittrich M, et al. Analysis of global DNA methylation changes in primary human fibroblasts in the early phase following X-ray irradiation. PLoS One. 2017;12(5):e0177442.
- Rithidech KN, Jangiam W, Tungjai M, et al. Induction of chronic inflammation and altered levels of DNA hydroxymethylation in somatic and germinal tissues of CBA/CaJ mice exposed to 48Ti ions. Front Oncol. 2016;6:155.
- Silva M, Melo A, Costa L, et al. Global and gene-specific DNA methylation and hydroxymethylation in human skin exposed and not exposed to sun radiation. An Bras Dermatol. 2017;92(6):793–800.
- Fu S, Wu H, Zhang H, et al. DNA methylation/hydroxymethylation in melanoma. Oncotarget. 2017;8(44):78163.
- Jin S-G, Jiang Y, Qiu R, et al. 5-Hydroxymethylcytosine is strongly depleted in human cancers but its levels do not correlate with IDH1 mutations. Cancer Res. 2011;71(24):7360–7365.
- Liu C, Liu L, Chen X, et al. Decrease of 5-hydroxymethylcytosine is associated with progression of hepatocellular carcinoma through downregulation of TET1. PLoS One. 2013;8(5):e62828.
- Orr BA, Haffner MC, Nelson WG, et al. Decreased 5-hydroxymethylcytosine is associated with neural progenitor phenotype in normal brain and shorter survival in malignant glioma. PLoS One. 2012;7(7):e41036.
- Pfeifer GP, S-G J, Kadam S. 5-hydroxymethylcytosine and its potential roles in development and cancer. Epigenetics Chromatin. 2013;6(1):10.
- Spans L, Van Den Broeck T, Smeets E, et al. Genomic and epigenomic analysis of high-risk prostate cancer reveals changes in hydroxymethylation and TET1. Oncotarget. 2016;7(17):24326.
- Chouliaras L, Mastroeni D, Delvaux E, et al. Consistent decrease in global DNA methylation and hydroxymethylation in the hippocampus of Alzheimer’s disease patients. Neurobiol Aging. 2013;34(9):2091–2099.
- Coppieters N, Dieriks BV, Lill C, et al. Global changes in DNA methylation and hydroxymethylation in Alzheimer’s disease human brain. Neurobiol Aging. 2014;35(6):1334–1344.
- Wang F, Yang Y, Lin X, et al. Genome-wide loss of 5-hmC is a novel epigenetic feature of Huntington’s disease. Hum Mol Genet. 2013;22(18):3641–3653.
- Ramírez F, Dündar F, Diel S, et al. deepTools: a flexible platform for exploring deep-sequencing data. Nucl Acids Res. 2014;42(1):187–191.
- Li J, Wu X, Zhou Y, et al. Decoding the dynamic DNA methylation and hydroxymethylation landscapes in endodermal lineage intermediates during pancreatic differentiation of hESC. Nucleic Acids Res. 2018;46(6):2883–2900.
- Lister R, Pelizzola M, Dowen RH, et al. Human DNA methylomes at base resolution show widespread epigenomic differences. Nature. 2009;462(7271):315–322.
- Khan A, Zhang X. dbSUPER: a database of super-enhancers in mouse and human genome. Nucleic Acids Res. 2015;44(D1):D164–D171.
- Favorov A, Mularoni L, Cope LM, et al. Exploring massive, genome scale datasets with the GenometriCorr package. PLoS Comput Biol. 2012;8(5):e1002529.
- Ehrlich M, Ehrlich KC. DNA cytosine methylation and hydroxymethylation at the borders. Epigenomics. 2014;6(6):563–566.
- Wu H, D’Alessio AC, Ito S, et al. Genome-wide analysis of 5-hydroxymethylcytosine distribution reveals its dual function in transcriptional regulation in mouse embryonic stem cells. Genes Dev. 2011;25(7):679–684.
- Huang Y, Chavez L, Chang X, et al. Distinct roles of the methylcytosine oxidases Tet1 and Tet2 in mouse embryonic stem cells. Proc Nat Acad Sci. 2014;111(4):1361–1366.
- Pang AP, Sugai C, Maunakea AK. High-throughput sequencing offers new insights into 5-hydroxymethylcytosine. Biomol Concepts. 2016;7(3):169–178.
- Ponnaluri VC, Ehrlich KC, Zhang G, et al. Association of 5-hydroxymethylation and 5-methylation of DNA cytosine with tissue-specific gene expression. Epigenetics. 2017;12(2):123–138.
- Bocker MT, Tuorto F, Raddatz G, et al. Hydroxylation of 5-methylcytosine by TET2 maintains the active state of the mammalian HOXA cluster. Nat Commun. 2012;3:818.
- Sérandour AA, Avner S, Oger F, et al. Dynamic hydroxymethylation of deoxyribonucleic acid marks differentiation-associated enhancers. Nucleic Acids Res. 2012;40(17):8255–8265.
- Terragni J, Zhang G, Sun Z, et al. Notch signaling genes: myogenic DNA hypomethylation and 5-hydroxymethylcytosine. Epigenetics. 2014;9(6):842–850.
- Tsumagari K, Baribault C, Terragni J, et al. Early de novo DNA methylation and prolonged demethylation in the muscle lineage. Epigenetics. 2013;8(3):317–332.
- Dubois-Chevalier J, Oger F, Dehondt H, et al. A dynamic CTCF chromatin binding landscape promotes DNA hydroxymethylation and transcriptional induction of adipocyte differentiation. Nucleic Acids Res. 2014;42(17):10943–10959.
- Feldmann A, Ivanek R, Murr R, et al. Transcription factor occupancy can mediate active turnover of DNA methylation at regulatory regions. PLoS Genet. 2013;9(12):e1003994.
- Teif VB, Beshnova DA, Vainshtein Y, et al. Nucleosome repositioning links DNA (de)methylation and differential CTCF binding during stem cell development. Genome Res. 2014 Aug;24(8):1285–1295.
- Sun Z, Terragni J, Borgaro JG, et al. High-resolution enzymatic mapping of genomic 5-hydroxymethylcytosine in mouse embryonic stem cells. Cell Rep. 2013;3(2):567–576.
- Wang D, Huang J-H, Zeng Q-H, et al. Increased 5-hydroxymethylcytosine and ten-eleven translocation protein expression in ultraviolet B-irradiated HaCaT Cells. Chin Med J (Engl). 2017;130(5):594.
- Li H. Aligning sequence reads, clone sequences and assembly contigs with BWA-MEM. arXiv preprint arXiv:13033997. 2013:1–3.
- Li H, Handsaker B, Wysoker A, et al. The sequence alignment/map format and SAMtools. Bioinformatics. 2009;25(16):2078–2079.
- Zhang Y, Liu T, Meyer CA, et al. Model-based analysis of ChIP-Seq (MACS). Genome Biol. 2008;9(9):R137.
- Yu G, Wang L-G, He Q-Y. ChIPseeker: an R/Bioconductor package for ChIP peak annotation, comparison and visualization. Bioinformatics. 2015;31(14):2382–2383.
- Team RC. R: a language and environment for statistical computing. R Foundation for Statistical Computing, Vienna, Austria. 2013. 2014.
- Carlson M org. Hs. eg. db: Genome Wide Annotation for Human (R package version 3.0. 0). 2014.
- Consortium EP. An integrated encyclopedia of DNA elements in the human genome. Nature. 2012;489(7414):57–74.
- Qu H, Fang X. A brief review on the human encyclopedia of DNA elements (ENCODE) project. Genomics Proteomics Bioinformatics. 2013;11(3):135–141.
- Thorvaldsdóttir H, Robinson JT, Mesirov JP. Integrative Genomics Viewer (IGV): high-performance genomics data visualization and exploration. Brief Bioinform. 2013;14(2):178–192.
- Dobin A, Davis CA, Schlesinger F, et al. STAR: ultrafast universal RNA-seq aligner. Bioinformatics. 2013;29(1):15–21.
- Love MI, Anders S, Kim V, et al. RNA-Seq workflow: gene-level exploratory analysis and differential expression. F1000Res. 2015;4:1–41.
- Patro R, Duggal G, Love MI, et al. Salmon provides fast and bias-aware quantification of transcript expression. Nat Methods. 2017;14(4):417.
- Wang L, Wang S, Li W. RSeQC: quality control of RNA-seq experiments. Bioinformatics. 2012;28(16):2184–2185.
- Soneson C, Love MI, Robinson MD. Differential analyses for RNA-seq: transcript-level estimates improve gene-level inferences. F1000Res. 2015;4:1–19.
- Love MI, Huber W, Anders S. Moderated estimation of fold change and dispersion for RNA-seq data with DESeq2. Genome Biol. 2014;15(12):550.
- Huntley MA, Larson JL, Chaivorapol C, et al. ReportingTools: an automated result processing and presentation toolkit for high-throughput genomic analyses. Bioinformatics. 2013;29(24):3220–3221.
- Mi H, Huang X, Muruganujan A, et al. PANTHER version 11: expanded annotation data from gene ontology and reactome pathways, and data analysis tool enhancements. Nucleic Acids Res. 2016;45(D1):D183–D189.
- Chowdhury B, Seetharam A, Wang Z, et al. A study of alterations in DNA epigenetic modifications (5mC and 5hmC) and gene expression influenced by simulated microgravity in human lymphoblastoid cells. PLoS One. 2016;11(1):e0147514.
- Edgar R, Domrachev A, Lash AE. Gene Expression Omnibus: NCBI gene expression and hybridization array data repository. Nucl Acids Res. 2002;30(1): 207–210.