
ABSTRACT
Enhancer of zeste homolog 2 (EZH2), a component of the PRC2 complex, trimethylates H3K27, a transcriptionally repressive histone mark. EZH2 is encoded by a dormant maternal mRNA and inhibiting the maturation-associated increase in EZH2 activity using either a combined siRNA/morpholino approach or a small molecule inhibitor (GSK343) inhibits development of diploidized parthenotes to the blastocyst stage but not inseminated eggs, with longer GSK343 treatments leading to progressively greater inhibition of development. GSK343 treatment also results in a decrease in H3K27me3 and a decrease in global transcription in 2-cell parthenotes but not 2-cell embryos derived from inseminated eggs. RNA-sequencing revealed the relative abundance of ~100 zygotically-expressed transcripts is decreased by GSK treatment in parthenotes, but not in embryos, with many of the affected transcripts encoding proteins involved in transcription. A previous study found that parthenotes deficient in maternal Ezh2 readily develop to the blastocyst stage. To reconcile these differences we propose that the H3K27me3 state present in the zygote needs to be faithfully propagated following DNA replication in at least one pronucleus, otherwise development is compromised.
Introduction
The oocyte-to-embryo transition (OET) in mouse entails not only genome activation – the full-grown oocyte is transcriptionally quiescent [Citation1] – but also an associated dramatic reprogramming of gene expression that mainly occurs during the 2-cell stage [Citation2–Citation6]. Although 1-cell embryos are transcriptionally active [Citation7], transcription appears promiscuous [Citation8,Citation9] and intron-containing expressed transcripts are not efficiently spliced [Citation8,Citation9]. Reprograming gene expression, which is likely critical for transforming a highly differentiated oocyte into totipotent 2-cell blastomeres, appears driven by epigenetic changes, in particular post-translational histone modifications [Citation10–Citation12]. For example, H3K4me3, an activating mark [Citation13] and H3K27me3, a repressive mark [Citation14], undergo dramatic changes in their genomic localization during OET [Citation15–Citation19] and these changes appear coupled to changes in promoter accessibility, i.e., chromatin structure [Citation9,Citation20].
In mouse, changes in abundance of H3K27me2/3 occur shortly following fertilization [Citation21–Citation23], with delayed immunostaining of the paternal pronucleus (PN) for H3K27me2/3 attributed to preferential recruitment of the Polycomb repressor complex 2 (PRC2) to the maternal pronucleus [Citation22]. EZH2 (enhancer of zeste 2), a core component of PRC2, di- and trimethylates H3K27 [Citation24]; H3K27me3 is a docking site for Polycomb repressor complex 1 (PRC1) and typically mediated by the CBX component of the PCR1 complex [Citation24,Citation25]. EZH2, which is essential for development [Citation26], is encoded by a dormant maternal mRNA recruited during oocyte maturation [Citation27 and see below] and conditionally deleting Ezh2 in oocytes using Zp3-Cre results in oocytes with little, if any, detectable H3K27me2/3 [Citation21]; Ezh2 expression from the paternal genome is observed in 4-cell embryos.
Although parthenotes derived from Ezh2-deficient oocytes develop to the blastocyst stage [Citation21], the role, if any, of maternally-recruited EZH2 in reprogramming gene expression during OET is not known. Accordingly, we inhibited the maturation-associated increase in EZH2 using a combined siRNA/morpholino approach or inhibited EZH2’s enzymatic activity with GSK343, a small molecule inhibitor [Citation28]. In contrast to results obtained with Ezh2-deficient oocytes, we find that either of these treatments inhibits cleavage beyond the 2-cell stage of parthenotes but not of biparental embryos. As expected, inhibiting EZH2’s enzymatic activity during activation or post-insemination reduces the intensity of H3K27me3 immunostaining in both 2-cell parthenotes and embryos. Unexpected, however, is that inhibiting EZH2 enzymatic activity results not only in a reduced level of global transcription but also expression of a subset of zygotically-activated genes in parthenotes but not embryos, with a large number of the affected transcripts encoding proteins involved in transcription and mRNA processing.
Results
Inhibiting the maturation-associated increase in EZH2 using a combined siRNA/morpholino approach inhibits development of diploid parthenotes
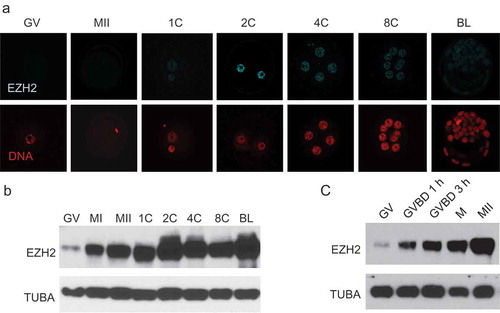
Prior to undertaking studies to examine the role of maternal EZH2 in preimplantation development, we assessed the temporal and spatial pattern of EZH2 in oocytes and preimplantation embryos (Figure 1(a,b)). EZH2 was present in GV oocytes and throughout preimplantation development, consistent with a previous report [Citation29]. A dramatic increase in the amount of EZH2 as detected by immunoblotting occurred during oocyte maturation, consistent with a previous report [Citation27], and was observed as early as 1 h following germinal vesicle breakdown (GVBD) ()). The maturation-associated increase in the amount EZH2 protein indicates that EZH2 is encoded by a dormant maternal mRNA, which is consistent with the presence of a cytoplasmic polyadenylation element (CPE; U4AU2) within 100 nucleotides of the polyadenylation signal sequence (A2UA3).
Figure 1. Temporal pattern of EZH2 expression during preimplantation development. (a) Immunofluorescence detection of EZH2. Upper panels show EZH2 staining at different stages of development, lower panels show presence of nucleus as detected by Hoechst staining. The experiment was performed 3 times and at least 20 oocytes/embryos were analyzed for each experiment. Similar results were obtained for each experiment and representative images are shown. (b) Immunoblot detection of EZH2. At least 50 oocytes/embryos were used for each lane, and experiment was conducted 3 times. TUBA was used as loading control. Similar results were obtained for each experiment and shown is a representative immunoblot. (c) Immunoblot showing rapid accumulation of EZH2 during oocyte maturation. GV, GV-intact oocyte; MI, metaphase I oocyte; MII, metaphase II arrested oocyte; 1C, 1-cell embryo; 2C, 2-cell embryo; 4C, 4-cell embryo; 8C, 8-cell embryo; BL, blastocyst stage embryo.
We initially took a combined siRNA/morpholino approach to inhibit the maturation-associated increase in EZH2; the morpholino would inhibit translation shortly after injection and the siRNA would lead to a time-dependent degradation of Ezh2 mRNA that would irreversibly prevent synthesis of EZH2 protein. This approach, which confirmed the specificity of the EZH2 antibody, effectively inhibited the maturation-associated increase in EZH2 as determined by either immunocytochemistry ()) or immunoblotting (), left panel); the reduction in the amount of EZH2 protein remained in effect until at least the 2-cell stage (), right panel). The combined siRNA/morpholino approach had no effect on the extent of maturation (Figure S1(a)), although PN formation was delayed following egg activation; the delayed cleavage of diploidized parthenotes to the 2-cell stage was consistent with delayed PN formation (Figure S1(b)).
Figure 2. Knockdown of EZH2 with siRNA/morpholino in parthenotes. (a) Immunofluorescence detection of EZH2 in 2-cell parthenotes. Upper panels show EZH2 staining, lower panels show presence of nucleus as detected by Hoechst staining. The experiment was performed 3 times and at least 20 oocytes/eggs/embryos were analyzed for each experiment. Similar results were obtained for each experiment and representative images are shown. (b) Immunoblot detection of EZH2 through oocyte maturation (left blot) and at the 2-cell parthenote embryo stage (right blot). Control si/morpho indicates injection of control siRNA/morpholino at the GV stage and Ezh2 si/morpho indicates injection of the siRNA/morpholino at the GV stage. TUBA was used as a loading control. (c) Immunocytochemical detection of H3K27me3 (top panels) and H3K9me3 (middle panels) in 2-cell parthenotes. Bottom panels show presence of nucleus as detected by Hoechst staining. The experiment was performed 3 times and at least 20 oocytes/eggs/embryos were analyzed for each experiment. Similar results were obtained for each experiment and representative images are shown. (d) Quantification of data shown in panel C. Asterisk represents significant (p < 0.05) decrease from control to EZH2 knockdown parthenotes (EZH2 KD). (e) Effect of EZH2 KD on development. Y-axis shows percentage of parthenotes that reached each given stage. Asterisk represents significant (p < 0.05) decrease compared to control. The experiment was performed 3 times and at least 20 oocytes/eggs/embryos were used for each group. Abbreviations as in with M representing morula.
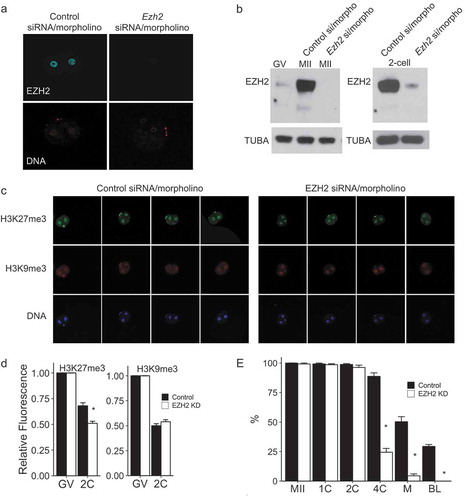
Inhibiting the maturation-associated increase in EZH2 protein resulted in a decrease in the intensity of the H3K27me3 immunofluorescence signal in 2-cell embryos compared to controls ((c), left panel; D), but no effect on the H3K9me3 signal (), right panel; D). The small, but significant, decrease in H3K27me3 is consistent with histone methylation marks being relatively stable [Citation30,Citation31] and the loss of H3K27me3 over promoters and distal domains [Citation17,Citation19]. Note that a decrease in signal intensity was observed in controls between the GV and 2-cell stages for both H3K27me3 and H3K9me3. In contrast to a previous study, however, in which oocytes depleted of maternal EZH2 readily developed to the blastocyst following maturation and activation [Citation21], development of diploidized parthenogenetic activated (PA) eggs beyond the 2-cell stage was seriously compromised when the maturation-associated increase in EZH2 was inhibited ()).
Inhibiting the catalytic activity of EZH2 inhibits development of diploid parthenotes
Loss of EZH2 protein could compromise development beyond the 2-cell by a non-catalytic mechanism because other components of the PRC2 complex could be the responsible factor(s) and loss of EZH2 could destabilize the PRC2 complex, e.g., loss of EZH2 results in failure of EED to localize to the nucleus [Citation21]. To ascertain whether compromised development was attributed to loss of EZH2’s catalytic activity and not EZH2 interacting with other proteins, we used GSK343, which is membrane-permeable, to inhibit reversibly EZH2’s histone methyltransferase activity [Citation28]. The 60-fold greater specificity of inhibition of GSK343 for EZH2 compared to EZH1 [Citation28], coupled the relative abundance of maternal Ezh2 is 17-fold greater than Ezh1 [Citation5] strongly suggests that any observed effects of GSK343 on development are likely attributed to the catalytic activity of EZH2. A further advantage of using GSK343 was that it enabled inhibiting EZH2 enzymatic activity during different windows of development when compared to the combined siRNA/morpholino approach.
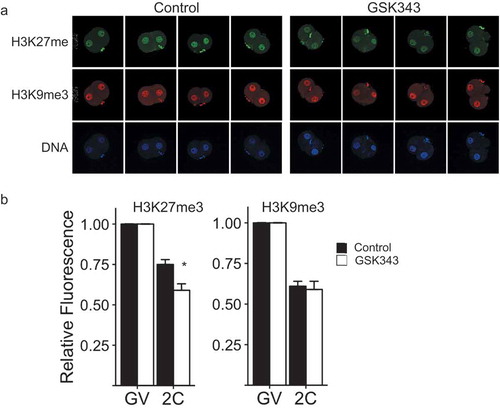
We first identified a concentration of GSK343 (5 µM) that phenocopied the effect of inhibiting the maturation-associated increase in EZH2 using the combined siRNA/morpholino approach on development beyond the 2-cell stage. GSK343 treatment also resulted in a decrease in signal intensity of H3K27me3, but not H3K9me3, in 2-cell embryos derived from diploidized activated eggs (). The decrease in the signal intensity of H3K27me3 is unlikely due to a global decrease in the amount of histone H3 because GSK343 treatment did not alter the signal intensity of H3 (Figure S2(a,b)), a result also consistent with no effect of GSK343 on the signal intensity of H3K9me3. Of particular note is that the inhibitory effect of GSK343 on H3K27me3 was reversible. Whereas continuous GSK343 treatment resulted in a time-dependent decrease in H3K27me3 signal intensity, an increase H3K27me3 signal intensity was observed after GSK343-treated embryos were transfered to GSK343-free medium (Figure S2(a,c)).
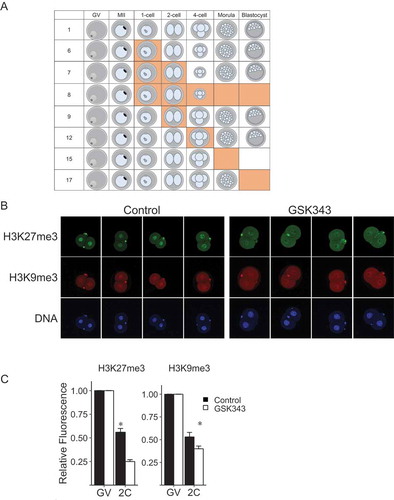
Figure 3. Effect of GSK343 treatment on H3K27me3 and H3K9me3 in parthenotes. (a) Immunofluorescence detection of H3K27me3 (top panels) and H3K9me3 (middle panels) in 2-cell parthenogenetic embryos. Bottom panels show presence of nucleus as detected by Hoechst staining. The experiment was performed 3 times and at least 20 oocytes/embryos were analyzed for each experiment. Similar results were obtained for each experiment and representative images are shown. (b) Quantification of data shown in panel A. Asterisk represents significant (p < 0.05) decrease compared to control. GV, GV-intact oocyte; 2C, 2-cell embryo.
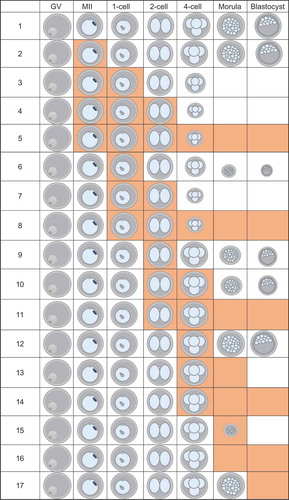
We then conducted experiments exposing diploidized parthenotes to 5 µM GSK343 for different times during preimplantation development to ascertain whether there was a sensitive-period of exposure that led to a reduced incidence of development to the blastocyst stage (Figure 4 and Table S1). As expected, continuous incubation in the presence of GSK343 starting with initiation of maturation resulted in none of the embryos developing to the blastocyst stage, with the majority of the embryos arresting at the 2-cell stage (line 5). Similarly, exposure of the embryos starting from the 2-cell (line 11) or 4-cell stage (line 14) effectively inhibited development to the blastocyst stage. Although exposure during maturation had a mild inhibitory effect on development to the blastocyst stage, no effect was observed on cleavage of 2-cell embryos to the 4-cell stage (line 2). Strikingly, treatment during maturation and PN stage (line 3) not only inhibited development to the blastocyst stage but also inhibited cleavage of 2-cell embryos. Similar results were obtained using oocytes that matured in vivo and were then activated (Table S2 and Figure S3), namely, early embryo exposure to GSK343 inhibited development to the blastocyst stage and resulted in a decrease in signal intensity of H3K27me3, but not H3K9me3, in 2-cell exposure also markedly inhibited development of activated, but not diploidized, eggs beyond the 2-cell stage (Table S3).
In light of the detrimental effect on development of GSK343 exposure during maturation and the 1-cell stage, we conducted a similar set of experiments using shorter windows of exposure to GSK343 ( and Table S1). Results of these experiments indicated that restricting exposure to the first 6 h following initiating the activation protocol had a dramatic inhibitory effect on the incidence of development to the blastocyst stage, with the majority of embryos arresting development at the 4-cell stage (line 6).
Figure 4. Summary of data of effect of different GSK343 treatments on development. Orange boxes indicate the presence of 5 µM GSK343 in culture media. Size of embryo represents percentage of parthenotes obtained following in vitro maturation and activation that developed to that stage for that treatment. Each experiment was performed 3 times and at least 20 oocytes/embryos were analyzed for each experiment. See Table S1 for data. GV, GV-intact oocyte; MII, metaphase II-arrested egg.
Inhibiting the catalytic activity of EZH2 does not inhibit development of inseminated eggs
There are very dramatic differences in histone modifications between male and female pronuclei [Citation10,Citation11]. For example, whereas the female PN always immunostains for H3K27me3 the male PN acquires such staining later and the staining is pericentric-enriched [Citation22]. Accordingly, we examined the effect of inhibiting EZH2 using GSK343 on inseminated eggs. In stark contrast to the inhibitory effect of early GSK343 exposure on development beyond the 2-cell stage of parthenotes, essentially no inhibitory effect was observed in treated inseminated eggs during the same time windows used when parthenotes were treated () and Table S4). As expected, continuous exposure of inseminated eggs to GSK343 inhibited development to the blastocyst stage. Similar to diploidized activated eggs, GSK343 treatment of fertilized eggs also resulted in a decreased immunofluorescent signal intensity of H3K27me3 in 2-cell embryos but a small decrease was also observed for H3K9me3 ().
Figure 5. Effect of GSK343 treatment on biparental embryo development, and H3K27me3 and H3K9me3 of in vivo matured and in vitro fertilized embryos. (a) Summary of data of effect of different GSK343 treatments on development. Orange boxes indicate the presence of 5 µM GSK343 in culture media. Size of embryo represents percentage of embryos that developed to that stage given that treatment. Each experiment was performed 3 times and at least 20 oocytes/embryos were analyzed for each experiment. See Table S4 for data. (b) Immunofluorescence detection of H3K27me3 (top panels) and H3K9me3 (middle panels) in 2-cell biparental embryos. Bottom panels show presence of nucleus as detected by Hoechst staining. The experiment was performed 3 times and at least 20 oocytes/embryos were analyzed for each experiment. Similar results were obtained for each experiment and representative images are shown. (c) Quantification of data shown in panel B. Asterisk represents significant (p < 0.05) decrease compared to control. GV, GV-intact oocyte; MII, metaphase II-arrested egg; 2C, 2-cell embryo.
Inhibiting the catalytic activity of EZH2 reduces global transcription and expression of a subset of zygotically-expressed genes in diploid parthenotes but not control embryos
We next examined the effect of GSK343 treatment on global transcription. Contrary to expectation, global transcription was reduced in GSK343-treated 2-cell diploid parthenotes when compared to control but not in 2-cell embryos derived from inseminated eggs (). The decreased H3K27me3 fluorescent signal observed for GSK343-treated 2-cell diploid parthenotes would have suggested GSK343 treatment would result in an increase in global transcription.
Figure 6. Effect of GSK343 on global transcription. Biparental embryos (Fertilized) were fertilized in vivo and parthenotes (PA) were in vivo matured and parthenogenetically activated. Both groups were cultured in control medium or medium containing GSK343 or α-amanitin. EU incorporation was assayed in 2-cell embryos. The experiment was performed 3 times, and at least 20 embryos were analyzed for each experiment. Asterisk represents significant (p < 0.05) decrease from control.
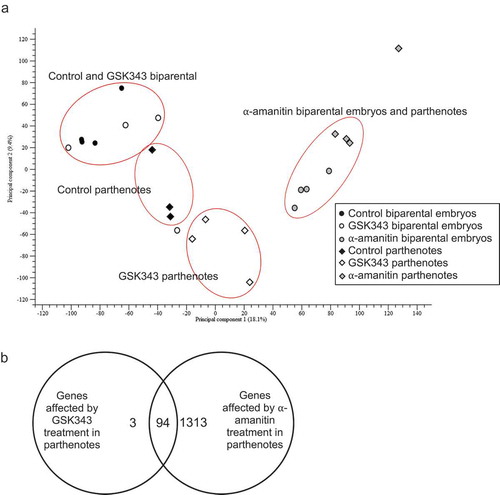
To ascertain whether the decrease in global transcription was attributed to all or a subset of zygotically-expressed genes in 2-cell diploid parthenotes, RNA-seq was performed. α-Amanitin was used to define the set of zygotically-expressed genes in control and 2-cell diploid parthenotes. Principal component analysis (PCA) indicated that as expected, the α-amanitin-treated 2-cell diploid parthenote and embryos clustered together but separately from their control counterparts ()). PCA analysis also indicated that GSK343-treated 2-cell diploid parthenotes clustered separately from their control counterparts, whereas GSK343-treated 2-cell embryos clustered with their control counterparts, although fewer α-amanitin-sensitive transcripts were detected in 2-cell diploid parthenotes when compared to control embryos ()). Furthermore, the small set of zygotically-expressed and affected transcripts in GSK343-treated 2-cell diploid parthenotes was also zygotically-expressed in control embryos. Analysis of the miss-expressed transcripts in response to GSK343-treatment in 2-cell diploid parthenotes revealed that many were involved directly or indirectly in transcription and mRNA processing, as well as cell cycle regulation (Table S5 and Discussion), which could underlie the observed compromised development of these embryos beyond the 2-cell stage. In addition, the relative abundance of a small number of transcripts that are in general not α-amanitin-sensitive was increased in both GSK343-treated parthenotes and embryos (Table S6). The increase in relative abundance of these transcripts may reflect precocious expression in light of the decrease in the repressive H3K27me3 mark. A list of all differentially expressed α-amanitin-sensitive genes in GSK343-treated and untreated embryos is found in Table S7.
Figure 7. Effect of GSK343 treatment on transcriptome. RNA-seq was conducted using 2-cell biparental embryos that were in vivo fertilized or parthenotes that were in vivo matured and parthenogenetically activated. Both groups were then cultured in control medium or medium containing GSK343 or α-amanitin. (a) Principal component analysis (PCA). Four replicates were performed, and at least 20 embryos were used for each sample. The graph was created using CLC Genomics Workbench (CLC Bio, Denmark). (b) Venn diagram comparison of transcripts whose relative abundance was decreased (FDR p-value<0.05) in parthenotes treated with GSK343 or α-amanitin compared to parthenotes cultured in control media.
Discussion
We provide evidence that the enzymatic activity of EZH2 is required for early development of parthenotes as manifested by compromised development beyond the 2-cell stage when either the maturation-associated increase in EZH2 is inhibited or its catalytic activity is directly inhibited. An increase in EZH2 enzymatic activity presumably occurs during oocyte maturation because EZH2 is encoded by a dormant maternal mRNA, i.e., an mRNA that is not translated or poorly translated in the oocyte but whose translation increases during maturation. A hallmark of dormant maternal mRNAs is that their transcript abundance is quite high in the oocyte, which ensures rapid accumulation of the encoded protein during maturation, and that they contain a cytoplasmic polyadenylation element (CPE) that is essential for their recruitment [Citation32]. Ezh2 mRNA meets these requirements [Citation5], with EZH2 protein accumulation detected within 1 h following GVBD, which is quite early when compared to other recruited mRNAs, e.g., Dcp1a, Dcp2, Cnot7, Sin3a, whose increase in protein abundance is first observed around MI, if not by MII ([Citation33–Citation35]. In fact, EED and SUZ12, two other components of the PCR2 complex are likely encoded by dormant maternal mRNAs, based on changes in their relative transcript abundance [Citation5] and presence of a CPE in close proximity to a polyadenylation signal sequence.
Dormant maternal mRNAs typically encode proteins critical for a biological process for which there will be a demand following fertilization, e.g., DNA replication [Citation36]. From this perspective, the impending round of DNA replication following fertilization/activation would require maintaining the maternal H3K27me3 mark deposited during oocyte growth at loci critical for development. The need for EZH2 activity during oocyte growth to establish the maternal mark may be low because oocyte development occurs over an extended period of time (i.e., about 2.5 weeks) in the absence of DNA replication. In contrast, maturation and initiation of development occur over the course of a few hours thereby placing an increase demand on EZH2 activity.
The central and unexpected finding reported here is that whereas there is no discernable effect on development to the blastocyst stage of parthenotes deficient in maternal EZH2 [Citation21], development of parthenotes to the blastocyst stage is highly compromised when the activity of maternally-recruited EZH2 is inhibited. To reconcile these differences, we propose that the epigenetic state present in the zygote, before DNA replication must be faithfully propagated following DNA replication, otherwise development is compromised. Oocytes deficient in maternal EZH2 lack the H3K27me3 mark, which is recognized as the ground-state by the zygote. Accordingly, parthenotes readily develop to the blastocyst stage because there is no need to maintain the mark given its absence. In contrast, the H3K27me3 mark is present in wild-type oocytes and inhibiting EZH2 enzymatic activity in parthenotes results in failure of the zygote to maintain the mark following DNA replication and compromises development to the blastocyst stage, with prolonged inhibition leading to a more pronounced inhibition of development (Figure 8).
Why does transient inhibition of EZH2 not inhibit development of zygotes? ChIP-seq data indicate that the H3K27me3 mark retained on sperm chromatin is erased following fertilization and replaced with de novo H3K27me3 marks mainly located in either gene deserts or inactive genes [Citation19]. Inhibiting EZH2 activity following fertilization will prevent formation of the de novo H3K27me3 mark, resulting in a paternal genome essentially devoid of the mark and now recognized as the ground-state. Presence of one unmarked parental genome appears sufficient to support development to the blastocyst stage, although the developmental competence of these blastocysts is unknown (). It is possible that development to term is not compromised but post-natal developmental problems arise, noting that fertilization of eggs deficient in maternal EZH2 with wild-type sperm results in development to term but the offspring exhibit growth retardation [Citation21].
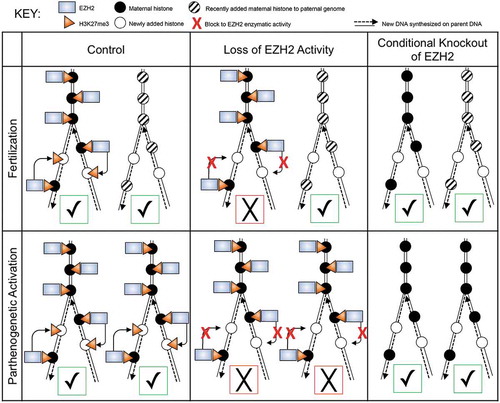
Figure 8. Schematic diagram depicting effect of inhibiting EZH2 function on propagation of H3K27me3 mark in diploid parthenotes and biparental embryos during DNA replication. Top row represents biparental embryos and bottom row diplodized parthenotes, with maternal chromosomes on the left and paternal chromosomes on the right in each box. Black circles represent maternal histones deposited on maternal chromosomes during oocyte growth, whereas striped circles represent histones that are deposited onto the paternal genome after fertilization and lack the mark, which appears in the late 1-cell stage and following initial formation of H3K27me1 and 2. Empty circles represent histones that are deposited during DNA replication. In the ‘Control’ column (far left), EZH2 (blue rectangle) is present and able to propagate the maternal H3K27me3 mark (orange triangle) onto newly deposited histones during DNA replication of maternal chromosomes. In contrast, paternal chromosomes will remain devoid of the mark. In the ‘Loss of EZH2 Activity’ column (center), the enzymatic activity of EZH2 is inhibited (red X) due to GSK343 treatment. Therefore the maternal H3K27me3 mark fails to be propagated onto newly deposited histones on maternal chromosomes and the mark fails to appear on replicated paternal chromosomes. In the ‘Conditional Knockout of EZH2’ column (far right), maternal EZH2 is not present, leading to loss of H3K27me3 on maternal chromosomes as well as on paternal chromosomes. For parthenotes, the maternal H3K27me3 mark is not maintained following DNA replication when EZH2 is inhibited. In contrast, depleting maternal EZH2 results in maternal chromosomes not harboring the mark and therefore the chromosomes fail to acquire the mark following activation and DNA replication. Check marks in green squares represent ‘successful’ and X’s in red squares represent ‘unsuccessful’ with respect to inheriting the initial epigenetic ground-state in the zygote across DNA replication. The results suggest that development to the blastocyst stage requires at least one of the parental genomes maintain the epigenetic landscape present in the zygote prior to DNA replication.
ChIP-seq data reveal that H3K27me3 is initially located over promoters in MII eggs but is essentially absent by the late 2-cell stage [Citation17], when the major wave of genome activation and reprogramming gene expression occurs. In addition, broad domains of H3K27me3 are found in regions distal to the transcription unit in MII eggs and these domains are substantially reduced by the late 2-cell stage. These findings are consistent with the observed decrease in H3K27me3 immunofluorescence staining between the GV and 2-cell stages. Loss of this repressive mark, in particular over promoters and replacement with H3K27ac [Citation15], an activating mark, would be expected to result in an increase in transcription. In contrast, we find that inhibiting either the maturation-associated increase in EZH2 or its catalytic activity, which results in a further significant reduction of H3K27me3 immunofluorescence, leads to a reduction in global transcription in parthenotes (but not in embryos derived from inseminated eggs) and this decrease is associated with decreased transcript abundance of a small subset of zygotically-expressed genes, i.e., α-amanitin-sensitive, in parthenotes but not embryos derived from inseminated eggs. Many of the affected transcripts encode for proteins involved directly or indirectly in transcription that could in turn result in a decrease in transcription. For example, CDK9 (in collaboration with CCNT1/2) phosphorylates S2 on the carboxyl-terminal domain (CTD) of RNA polymerase II, converting it to the elongating form [Citation37], noting that CDK9/CCNT1/2 activity appears critical for genome activation [Citation38]. In addition, when EZH2 function is inhibited, the failure to faithfully reprogram gene expression in parthenotes likely contributes to compromised development beyond the 2-cell stage. The ability to conduct ChIP-seq [Citation15,Citation17,Citation18] combined with ATAC-seq [Citation9] with small numbers of preimplantation embryos will likely provide insights into how perturbing EZH2 activity prior to major genome activation leads to the observed phenotype.
Materials and methods
Oocyte/egg collection
Full-grown, germinal vesicle-intact oocytes (GV) obtained from cumulus cell-oocyte complexes were collected from 6-wk-old CF-1 female mice (Harlan, Indianapolis, IN) primed with 5IU eCG for 44–48 h prior to isolation. Bicarbonate-free minimal essential medium (Earle’s salts) supplemented with 3 mg/ml of polyvinylpyrrolidone (PVP) and 25 mM Hepes (pH 7.3) (MEM/PVP) was used for the collection medium, and 2.5 μM milrinone was added to prevent resumption of meiosis [Citation39]. In vivo matured metaphase II (MII) oocytes were collected from eCG-primed CF-1 female mice 13–16 h following hCG administration; in vitro matured MII oocytes were obtained following culture for 16–18 h at 37°C in 5% CO2 in air after transferring full-grown GV oocytes to milrinone-free Chatot Ziomek Brinster (CZB) medium [Citation40] as previously described [Citation33]. All animal experiments and procedures were approved by the Institutional Animal Care and Use Committee and consistent with NIH guidelines.
Egg activation, in vitro fertilization, and embryo culture
To generate parthenogenetic activated (PA) diploidized embryos, MII eggs were activated for 3 h in Ca2+-, Mg2+-free CZB medium containing 10 mM SrCl2 and 5 µg/mL cytochalasin B, followed by culture for 3 h in CZB medium containing 5 µg/mL cytochalasin B. To generate in vitro fertilized (IVF) embryos, in vivo matured MII eggs were inseminated using fresh capacitated epididymal sperm (5x10⁵ sperm/ml) of B6D2F1/J male mice (Jackson Lab, Bar Harbor, ME) in TYH medium [Citation41] with 4 mg/mL BSA for 3–6 h; sperm were capacitated for 1.5 h prior to use. After PA and IVF, the 1-cell embryos were cultured in KSOM medium containing amino acids (KSOM/AA) [Citation42,Citation43] at 37°C and 5% CO2 until blastocyst stage.
In vivo zygote collection
Eight-week old female mice were primed with 5 IU eCG, followed by 5 IU hCG 46–48 h later. Female mice were then placed with males, left overnight and checked for plugs the following morning. Zygotes containing two visible pronuclei were collected from the oviduct and cultured as described above.
EZH2 knockdown and inhibiting EZH2 enzymatic activity
Denuded GV oocytes were microinjected with approximately 5 pL of an siRNA/morpholino mix in MEM/PVP containing 2.5 μM milrinone as previously described [Citation44]. The Ezh2 (SI00997801; Qiagen and 4390771; Ambion) and control Luciferase siRNA (D-001100–01-05; Dharmacon) were both injected at a concentration of 25 μM. The concentration of the Ezh2 (5ʹ-ATTTCTTCCCAGTCTGGCCCATGAT-3ʹ; GeneTools) and standard control morpholinos (GeneTools) was 1 mM. Following microinjection, the oocytes were cultured in CZB medium containing 2.5 μM milrinone under 5% CO2 in air at 37°C for 1 h, transferred to milrinone-free CZB medium and allowed to mature to MII, and then activated and cultured in KSOM/AA to monitor development. To inhibit EZH2 histone methyl transferase activity, oocytes or embryos were cultured in CZB or KSOM/AA medium containing 5 µM GSK343, a reversible inhibitor of EZH2 enzymatic activity [Citation28] for the times noted in the text.
Immunoblot analysis
Immunoblotting was performed as previously described [Citation33]. Briefly, protein extracts from samples were solubilized in Laemmli sample buffer and resolved by SDS-PAGE, then transferred to a PVDF membrane. The membrane was blocked in blocking reagent and incubated overnight with the primary antibody in blocking solution. The membrane was then washed and incubated with a secondary antibody conjugated with horseradish peroxidase. The signal was detected with the Amersham ECL Select Western blot detection reagent (GE Healthcare) according to the manufacturer’s instructions. Antibodies and dilutions for immunoblotting and immunofluorescence are listed below.
Immunofluorescence
Immunofluorescence was performed as previously described with slight modifications [Citation45]. Briefly, oocytes and embryos were fixed in 4% paraformaldehyde for 20 min at room temperature, permeabilized with 0.2% Triton X-100 in PBS solution for 10 min, and then blocked in PBS containing 0.1% BSA and 0.01% Tween-20 for 1 h. The cells were then incubated with primary antibodies overnight at 4°C, followed by incubation with the appropriate secondary antibody for 1 h. DNA was stained with 10 μg/ml Hoechst 33342. The cells were then washed and mounted under a coverslip with gentle compression in ProLong Gold Antifade Mountant solution (Life Technologies). Fluorescence was detected on a Leica TCS SP laser-scanning confocal microscope. For each experiment, all samples were processed in parallel and the intensity of fluorescence was quantified with NIH imageJ software. The laser power was adjusted so that the signal intensity was below saturation for the developmental stage that displayed the highest intensity and all images were then scanned at that laser power.
The intensity of fluorescence was quantified using NIH Image J software. Briefly, nuclear signal was outlined and mean fluorescence intensity was measured. This same encircled region was dragged to the cytoplasm of the same cell, and background fluorescence was measured. The specific signal was calculated by dividing nuclear values by cytoplasmic values.
Antibodies
The following antibodies and dilution for immunoblotting (IB) or immunofluorescence (IF) were used:
Anti-EZH2 rabbit polyclonal antibody (AC22, Cell Signaling Technology, IF, 1:400; WB,1:2000)
Anti-Histone H3 (trimethyl K27) rabbit polyclonal (ABE44; Millipore, IF, 1:400)
Anti-Histone H3 (trimethyl K27) mouse monoclonal antibody (ab6002; Abcam, IF, 1:400)
Anti-Histone H3 (trimethyl K9) rabbit polyclonal antibody (ab8898; Abcam, IF, 1:400)
Anti-Histone H3 (trimethyl K9) mouse monoclonal (ab71604, Abcam, IF, 1:400)
Anti-Histone H3 rabbit polyclonal antibody (ab1791; Abcam, IF, 1:400)
Donkey anti-Mouse IgG secondary antibody (A10037; ThermoFisher, IF, 1:400)
Donkey anti-Rabbit IgG (H + L) secondary antibody (A21206; ThermoFisher,IF,1:400)
Global transcription assay
The Click-iT RNA Imaging kit (C10329, Invitrogen) was used to assay global transcription. Briefly, 2-cell embryos were cultured with 2 mM EU in KSOM medium for 1 h before fixation in 2.5% paraformaldehyde for 20 min at room temperature. After washing and membrane permeabilization, incorporated EU was detected according to the manufacturer’s instructions. The samples were mounted in VECTASHIELD medium containing Hoechst 33342 (10 µg/mL) to visualize the DNA. DNA and EU were visualized using a Leica TCS SP laser-scanning confocal microscopy. The intensity of the fluorescence was quantified using ImageJ software as previously described [Citation7].
RNA isolation, cDNA library preparation, and RNA sequencing
Two-cell embryos (16–20) were washed three times in PBS+PVA and transferred to a PCR tube that was then frozen in liquid nitrogen. Samples were stored at −80°C until processed for RNAseq. Total RNA, isolated with an ARCTURUS® PicoPure RNA Isolation Kit (Thermo Fisher Scientific, catalog #KIT0204) according to the manufacturer’s instructions, was used for library preparation using the Ovation® SoLo RNA-Seq Systems (NuGEN catalog #0501) according to the manufacturer’s instructions. cDNA libraries were quantified and evaluated using a 2100 Bioanalyzer (Aligent Technologies). Libraries were pooled, and sequencing was performed using NextSeq single end 75 base pairs. The sequenced samples contained 8 to 37 million reads.
Reads from each sample were trimmed (first 5 bp removed) and individually mapped to the annotated transcripts in the mouse reference genome using the RNA-Seq tool in CLC Genomics Workbench (CLC Bio, Denmark), which calculated gene expression levels as RPKM. PCA was generated using the PCA tool on gene expression RPKM values. Expression analysis was then run to compare groups.
Genes were considered significantly different if the fold-change was >2 and had an FDR p-value<0.05. NCBI David Functional Annotation was used to identify processes implicated by the differentially expressed transcripts; processes were only considered if p-value <0.05.
Statistical analysis
All experiments were replicated at least three times. One-way ANOVA were used to evaluate the differences between groups using IBM SPSS Statistics 19.0. A level of P < 0.05 was considered significant.
Supplemental Material
Download MS Word (11.5 MB)Acknowledgments
The authors thank Richard Jimenez and Eduardo Melo for performing the initial immunoblots detecting the maturation-associated increase in EZH2 and Sergey Medvedev for conducting the immunoblot shown in ).
Disclosure statement
No potential conflict of interest was reported by the authors.
Supplementary material
Supplementary data can be accessed here.
Additional information
Funding
Related Research Data
References
- Moore GP, Lintern-Moore S. Transcription of the mouse oocyte genome. Biol Reprod. 1978 Jun;18(5):865–870. PubMed PMID: 667267.
- Hamatani T, Carter MG, Sharov AA, et al. Dynamics of global gene expression changes during mouse preimplantation development. Dev Cell. 2004 Jan;6(1):117–131. PubMed PMID: 14723852.
- Park SJ, Komata M, Inoue F, et al. Inferring the choreography of parental genomes during fertilization from ultralarge-scale whole-transcriptome analysis. Genes Dev. 2013 Dec 15;27(24):2736–2748. PubMed PMID: 24352427; PubMed Central PMCID: PMC3877761.
- Wang QT, Piotrowska K, Ciemerych MA, et al. A genome-wide study of gene activity reveals developmental signaling pathways in the preimplantation mouse embryo. Dev Cell. 2004 Jan;6(1):133–144. PubMed PMID: 14723853.
- Zeng F, Baldwin DA, Schultz RM. Transcript profiling during preimplantation mouse development. Dev Biol. 2004 Aug 15;272(2):483–496. PubMed PMID: 15282163.
- Zeng F, Schultz RM. RNA transcript profiling during zygotic gene activation in the preimplantation mouse embryo. Dev Biol. 2005 Jul 1;283(1):40–57. PubMed PMID: 15975430.
- Aoki F, Worrad DM, Schultz RM. Regulation of transcriptional activity during the first and second cell cycles in the preimplantation mouse embryo. Dev Biol. 1997 Jan 15;181(2):296–307. PubMed PMID: 9013938.
- Abe K, Yamamoto R, Franke V, et al. The first murine zygotic transcription is promiscuous and uncoupled from splicing and 3ʹ processing. Embo J. 2015 Jun 3;34(11):1523–1537. PubMed PMID: 25896510; PubMed Central PMCID: PMCPMC4474528.
- Wu J, Huang B, Chen H, et al. The landscape of accessible chromatin in mammalian preimplantation embryos. Nature. 2016 Jun 30;534(7609):652–657. PubMed PMID: 27309802.
- Beaujean N. Histone post-translational modifications in preimplantation mouse embryos and their role in nuclear architecture. Mol Reprod Dev. 2014 Feb;81(2):100–112. PubMed PMID: 24150914.
- Burton A, Torres-Padilla ME. Chromatin dynamics in the regulation of cell fate allocation during early embryogenesis. Nat Rev Mol Cell Biol. 2014 Nov;15(11):723–734. PubMed PMID: 25303116.
- Eckersley-Maslin MA, Alda-Catalinas C, Reik W. Dynamics of the epigenetic landscape during the maternal-to-zygotic transition. Nat Rev Mol Cell Biol. 2018 Jul;19(7):436–450. PubMed PMID: 29686419.
- Ruthenburg AJ, Allis CD, Wysocka J. Methylation of lysine 4 on histone H3: intricacy of writing and reading a single epigenetic mark. Mol Cell. 2007 Jan 12;25(1):15–30. PubMed PMID: 17218268.
- Bogliotti YS, Ross PJ. Mechanisms of histone H3 lysine 27 trimethylation remodeling during early mammalian development. Epigenetics. 2012 Sep;7(9):976–981. PubMed PMID: 22895114; PubMed Central PMCID: PMCPMC3515017.
- Dahl JA, Jung I, Aanes H, et al. Broad histone H3K4me3 domains in mouse oocytes modulate maternal-to-zygotic transition. Nature. 2016 Sep 22;537(7621):548–552. PubMed PMID: 27626377.
- Jung YH, Sauria MEG, Lyu X, et al. Chromatin States in mouse sperm correlate with embryonic and adult regulatory landscapes. Cell Rep. 2017 Feb 7;18(6):1366–1382. PubMed PMID: 28178516; PubMed Central PMCID: PMCPMC5313040.
- Liu X, Wang C, Liu W, et al. Distinct features of H3K4me3 and H3K27me3 chromatin domains in pre-implantation embryos. Nature. 2016 Sep 22;537(7621):558–562. PubMed PMID: 27626379.
- Zhang B, Zheng H, Huang B, et al. Allelic reprogramming of the histone modification H3K4me3 in early mammalian development. Nature. 2016 Sep 22;537(7621):553–557. PubMed PMID: 27626382.
- Zheng H, Huang B, Zhang B, et al. Resetting epigenetic memory by reprogramming of histone modifications in mammals. Mol Cell. 2016 Sep 15;63(6):1066–1079. PubMed PMID: 27635762.
- Lu F, Liu Y, Inoue A, et al. Establishing chromatin regulatory landscape during mouse preimplantation development. Cell. 2016 Jun 2;165(6):1375–1388. PubMed PMID: 27259149.
- Erhardt S, Su IH, Schneider R, et al. Consequences of the depletion of zygotic and embryonic enhancer of zeste 2 during preimplantation mouse development. Development. 2003 Sep;130(18):4235–4248. PubMed PMID: 12900441.
- Santos F, Peters AH, Otte AP, et al. Dynamic chromatin modifications characterise the first cell cycle in mouse embryos. Dev Biol. 2005 Apr 1;280(1):225–236. PubMed PMID: 15766761.
- van der Heijden GW, Dieker JW, Derijck AA, et al. Asymmetry in histone H3 variants and lysine methylation between paternal and maternal chromatin of the early mouse zygote. Mech Dev. 2005 Sep;122(9):1008–1022. PubMed PMID: 15922569.
- Margueron R, Reinberg D. The Polycomb complex PRC2 and its mark in life. Nature. 2011 Jan 20;469(7330):343–349. PubMed PMID: 21248841; PubMed Central PMCID: PMC3760771.
- Simon JA, Kingston RE. Mechanisms of polycomb gene silencing: knowns and unknowns. Nat Rev Mol Cell Biol. 2009 Oct;10(10):697–708. PubMed PMID: 19738629.
- O’Carroll D, Erhardt S, Pagani M, et al. The polycomb-group gene Ezh2 is required for early mouse development. Mol Cell Biol. 2001 Jul;21(13):4330–4336. PubMed PMID: 11390661; PubMed Central PMCID: PMC87093.
- Puschendorf M, Terranova R, Boutsma E, et al. PRC1 and Suv39h specify parental asymmetry at constitutive heterochromatin in early mouse embryos. Nat Genet. 2008 Apr;40(4):411–420. PubMed PMID: 18311137.
- Verma SK, Tian X, LaFrance LV, et al. Identification of potent, selective, cell-active inhibitors of the histone lysine methyltransferase EZH2. ACS Med Chem Lett. 2012 Dec 13;3(12):1091–1096. PubMed PMID: 24900432; PubMed Central PMCID: PMC4025676.
- Huang XJ, Wang X, Ma X, et al. EZH2 is essential for development of mouse preimplantation embryos. Reprod Fertil Dev. 2014 Oct;26(8):1166–1175. PubMed PMID: 24153105.
- Bannister AJ, Kouzarides T. Reversing histone methylation. Nature. 2005 Aug 25;436(7054):1103–1106. PubMed PMID: 16121170.
- Zee BM, Levin RS, Xu B, et al. In vivo residue-specific histone methylation dynamics. J Biol Chem. 2010 Jan 29;285(5):3341–3350. PubMed PMID: 19940157; PubMed Central PMCID: PMCPMC2823435.
- Groppo R, Richter JD. Translational control from head to tail. Curr Opin Cell Biol. 2009 Jun;21(3):444–451. PubMed PMID: 19285851; PubMed Central PMCID: PMCPMC4354865.
- Jimenez R, Melo EO, Davydenko O, et al. Maternal SIN3A regulates reprogramming of gene expression during mouse preimplantation development. Biol Reprod. 2015 Oct;93(4):89. PubMed PMID: 26353893; PubMed Central PMCID: PMC4711907.
- Ma J, Flemr M, Strnad H, et al. Maternally recruited DCP1A and DCP2 contribute to messenger RNA degradation during oocyte maturation and genome activation in mouse. Biol Reprod. 2013 Jan;88(1):11. PubMed PMID: 23136299; PubMed Central PMCID: PMCPMC4434936.
- Ma J, Fukuda Y, Schultz RM. Mobilization of dormant Cnot7 mRNA Promotes deadenylation of maternal transcripts during mouse oocyte maturation. Biol Reprod. 2015 Aug;93(2):48. PubMed PMID: 26134871; PubMed Central PMCID: PMCPMC4706299.
- Svoboda P, Franke V, Schultz RM. Sculpting the transcriptome during the oocyte-to-embryo transition in mouse. Curr Top Dev Biol. 2015;113:305–349. PubMed PMID: 26358877.
- Phatnani HP, Greenleaf AL. Phosphorylation and functions of the RNA polymerase II CTD. Genes Dev. 2006 Nov 1;20(21):2922–2936. PubMed PMID: 17079683.
- Oqani RK, Kim HR, Diao YF, et al. The CDK9/cyclin T1 subunits of P-TEFb in mouse oocytes and preimplantation embryos: a possible role in embryonic genome activation. BMC Dev Biol. 2011 Jun;3(11):33. PubMed PMID: 21639898; PubMed Central PMCID: PMCPMC3127986.
- Tsafriri A, Chun S-Y, Zhang R, et al. Oocyte maturation involves compartmentalization and opposing changes in cAMP levels in follicular somatic and germ cells: studies using selective phosphodiesterase inhibitors. DevBiol. 1996;178:393–402.
- Chatot CL, Ziomek CA, Bavister BD, et al. An improved culture medium supports development of random-bred 1-cell mouse embryos in vitro. J Reprod Fertil. 1989 Jul;86(2):679–688. PubMed PMID: 2760894; eng.
- Hamano S, Naito K, Fukuda Y, et al. In vitro capacitation of boar ejaculated spermatozoa: effect of conditioned media prepared from preincubated sperm suspension. Gamete Res. 1989 Dec;24(4):483–489. PubMed PMID: 2591865.
- Erbach GT, Lawitts JA, Papaioannou VE, et al. Differential growth of the mouse preimplantation embryo in chemically defined media. Biol Reprod. 1994 May;50(5):1027–1033. PubMed PMID: 8025158.
- Ho Y, Wigglesworth K, Eppig JE, et al. Preimplantation development of mouse embryos in KSOM: augmentation by amino acids and analysis of gene expression. Mol Reprod Dev. 1995;41:232–238.
- Kurasawa S, Schultz RM, Kopf GS. Egg-induced modifications of the zona pellucida of mouse eggs: effects of microinjected inositol 1,4,5-trisphosphate. Dev Biol. 1989;133:295–304.
- Balboula AZ, Stein P, Schultz RM, et al. Knockdown of RBBP7 unveils a requirement of histone deacetylation for CPC function in mouse oocytes. Cell Cycle. 2014;13(4):600–611. PubMed PMID: 24317350; PubMed Central PMCID: PMCPMC5896761.