
ABSTRACT
Aquaporin-1 (AQP1) is a homo-tetrameric transmembrane protein that facilitates rapid movement of water and ions across cell membranes. The clinical significance of AQP1 expression in colorectal carcinoma (CRC) is controversial. The aim of this study was to investigate the prognostic significance of AQP1 transcript expression and the association between expression and promoter methylation in normal colonic mucosa, CRC tissues and cell lines. Analysis of publicly available datasets from The Cancer Genome Atlas revealed that AQP1 expression was significantly decreased in CRC compared to normal mucosa (12.7 versus 33.3 respectively, P < 0.0001). However, expression increased with advanced disease, being significantly higher in stage IV (17.6) compared to either stage I (11.8, P = 0.0039) or II (10.9; P = 0.0023), and in patients with lymph node metastasis compared to those without (13.9 versus 11.3 respectively, P = 0.0023). Elevated expression was associated with decreased overall survival with univariate (Cox Proportional Hazard Ratio 1.60, 95% confidence interval 1.05–2.42, P = 0.028), but not multivariable analysis when considering the confounders stage and age. Analysis of HumanMethylation450 data demonstrated that AQP1 promoter methylation was significantly increased in CRC compared to normal mucosa. Analysis of CRC tissues and cell lines strongly suggested that methylation was associated with decreased expression. BRAFV600E mutation alone did not explain the increase in methylation. In conclusion, AQP1 transcript expression was decreased in CRC compared to normal mucosa, and this was associated with AQP1 promoter hypermethylation. AQP1 transcript expression increased with advanced disease but was not an independent prognostic indicator.
Introduction
Globally, colorectal carcinoma (CRC) is one of the most commonly diagnosed cancers and is a leading cause of cancer-related deaths [Citation1]. At diagnosis, up to 25% of patients present with metastatic disease (stage IV). Additionally, up to 25% of patients diagnosed with early localized disease (stage I or II) and 50% with locally advanced CRC (stage III) eventually relapse with overt metastatic disease following surgery with curative intent [Citation2]. Despite recent advances in treatment, patients with metastatic disease currently have 5-year survival rates of less than 15%, and a median overall survival of approximately 30 months [Citation3,Citation4]. There is a need to improve staging and treatment of CRC.
Aquaporin-1 (AQP1) forms a homo-tetrameric transmembrane channel that facilitates the rapid movement of water and ions across cell membranes in response to osmotic gradients [Citation5]. Increased expression has been reported in numerous cancer types including brain, breast, cervical, lung, renal, and CRC [Citation6]. Previous studies have suggested that AQP1 is involved in enhancing cancer cell migration and invasion (reviewed in [Citation6]). Studies comparing AQP1-null and wildtype mice suggest that AQP1 promotes tumour growth by enhancing endothelial cell migration and angiogenesis [Citation7]. Whilst the relevance of AQP1 expression has been investigated in numerous cancer types, only a small number of studies have investigated the prognostic significance of AQP1 protein expression in CRC, and these have yielded conflicting results [Citation8–Citation10].
Changes in DNA methylation are frequent, early events in carcinogenesis [Citation11]. DNA methylation is of clinical interest because it might lead to biomarkers for early detection, diagnosis, prognostication, therapeutic stratification, and post-therapeutic monitoring. Promoter methylation plays a role in mediating gene expression, as evidenced by studies showing that methylation of gene promoter regions varies considerably depending on the cell type, with more methylation correlating with low or no transcription [Citation12]. This has been highlighted in cancer, as experimentally shown by some research groups, which show that hypermethylation occurs in cancer at promoters of genes already transcriptionally repressed [Citation13,Citation14]. However, studies on the association between AQP1 promoter methylation and gene expression are currently limited to glioblastoma multiform, normal salivary gland and salivary gland adenoid cystic carcinoma [Citation15–Citation17], and have not been reported for other carcinomas including CRC.
The aim of this study was to investigate the prognostic significance of AQP1 transcript expression and the association between expression and promoter methylation in colon cancer cell lines, normal colonic mucosa and CRC tissues.
Results
Expression of AQP1 was reduced in colorectal carcinoma compared to normal mucosa
Expression of AQP1 transcript was analyzed in the combined The Cancer Genome Atlas (TCGA) colon (TCGA-COAD) and rectal adenocarcinoma (TCGA-READ) datasets. Transcript expression data, reported as the median number of fragments per kilobase of exon per million reads (FPKM), were available for 590 patients with confirmed CRC, 47 of which had matched normal colonic mucosa (summary of clinicopathological features in Table S1). There was no significant difference in the median age of the 590 CRC patients (68 y, range 31–90) compared to those with normal mucosa (73 y, range 40–90; P = 0.0585). Expression of AQP1 was significantly higher in normal mucosa (median 33.3, range 11.2–146.4) compared to either all CRC (median 12.7, range 0.8–175.9, P < 0.0001) or to patient matched CRC (median 15.8, range 3.9–126.7, P < 0.0001). Expression was higher in the normal mucosa compared to CRC for 40 of 47 patients (85%). Analysis of publicly available datasets deposited in Oncomine (www.oncomine.org) provided further supportive evidence that AQP1 transcript expression was significantly higher in normal mucosa compared to either CRC or adenoma (Table S2). Together, these data strongly suggest that AQP1 transcript expression was significantly decreased in CRC compared to normal mucosa.
Analysis of the TCGA datasets by disease stage revealed that expression was significantly higher in normal mucosa compared to either stage I (median 11.8, range 0.8–138.5, P < 0.0001), II (median 10.9, range 2.0–126.7, P < 0.0001), III (median 13.9, range 2.2–175.9, P < 0.0001), or IV (median 17.6, range 2.0–153.7, P = 0.0003) CRC (). Expression increased with advanced stage, being significantly higher in stage IV compared to either stage I (P = 0.0039) or II (P = 0.0023), and in patients with lymph node metastasis (stage III) compared to those without (stage I-II, median 13.9, range 2.2–175.9, P = 0.0039). Expression was significantly less in right-sided compared to left-sided CRC (median 11.4, range 0.8–175.9 versus median 13.4, range 2.0–153.7 respectively, P = 0.0284). It was not significantly different for gender, age, morphology, or BRAF mutation status.
Table 1. AQP1 transcript expression in tissues from the combined TCGA-COAD and TCGA-READ datasets by clinicopathological characteristics.
Reduced AQP1 expression was associated with increased overall survival in univariate but not multivariable analysis
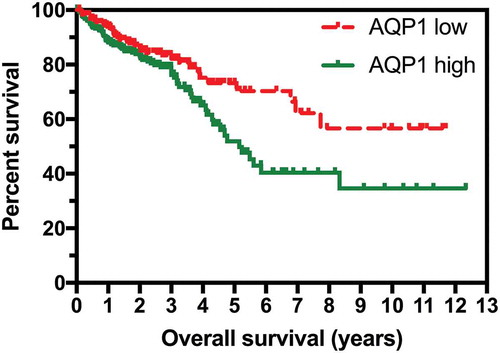
Kaplan-Meier analysis of the overall survival (OS) for the 590 patients represented in the combined TCGA datasets demonstrated that elevated AQP1 expression (defined as a FPKM ≥ 11.4) was associated with significantly poorer OS (P = 0.0142; ). A subset analysis was performed on 453 of the 590 patients with complete clinical data. Elevated AQP1 transcript expression was associated with poorer OS in the univariate (; hazard ratio (HR) 1.60, 95% confidence interval (CI) 1.05–2.42, P = 0.028) but not the multivariable model (HR 1.15, 95% CI 0.75–1.77, P = 0.523). Age and stage of cancer remained significant, independent predictors of OS in the multivariable model: in summary, each 1 y increase in age was associated with a 4% increase in risk of dying; when compared to patients with stage I-II cancer, the risk of dying was 2.6 times higher amongst patients with stage III and 7.66 times higher amongst those with stage IV cancer.
Table 2. Overall survival for the 453 patients with complete clinical data in the combined TCGA-COAD and TCGA-READ datasets.
Figure 1. High expression of AQP1 was associated with shorter overall survival in colorectal carcinoma. RNA sequencing data reported as median number of fragments per kilobase of exon per million reads (FPKM) and survival data for the 590 patients in the combined TCGA-COAD and TCGA-READ datasets were obtained from TCGA Research Network (http://cancergenome.nih.gov/). Low AQP1 transcript expression (n = 261) was defined as FPKM < 11.4, and high (n = 329) as FPKM ≥ 11.4.
AQP1 promoter was frequently hypermethylated in CRC compared to normal mucosa
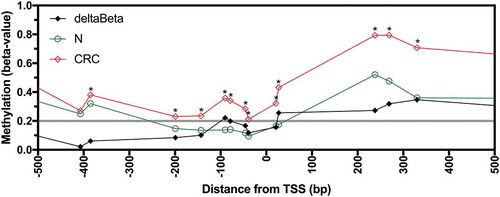
Having identified that AQP1 transcript expression was decreased in CRC compared to normal mucosa, we examined if the reduced expression was associated with AQP1 DNA methylation. Infinium HumanMethylation450 BeadChip (HM450) DNA methylation data were available for 317 of the 590 CRC patients (225 from TCGA-COAD and 92 from TCGA-READ), 32 of which had patient matched normal mucosa. Methylation data, expressed as beta-values, for AQP1 were available for 21 CpG probesets, of which 10 were located −5,000 to −1 bp upstream of the transcription start site (TSS), eight were in the gene body defined as +1 to +13,824 bp downstream of the TSS, and two were in the distal intergenic region within 10,000 bp of the end of the gene body. There were no overt differences in methylation of these probesets between colon and rectal carcinoma. Statistically significant differences in average beta-values between normal mucosa and CRC were observed for 16 of the 21 probesets (, Figure S1 and Figure S2; Bonferroni adjusted P < 0.05). For the eight probesets located between −200 and +200 bp of the TSS the average beta-values for normal mucosa were < 0.2 and were significantly less than the average beta-values for CRC (). Methylation was significantly higher (hypermethylated) in CRC compared to normal mucosa for all 13 probesets in the region −385 to +1,653 bp of the TSS and for the probeset at −658 bp ( and Figure S2; Bonferroni adjusted P < 0.05). In contrast, for the 2 probesets located in the distal intergenic region, at +13,977 and +21,814 bp, methylation was significantly lower in CRC compared to normal mucosa. No significant differences were observed for the probesets at −4,832, −407, +3,051, +9,315 and +12,504 bp. Differential methylation (deltaBeta, defined as a difference in average beta-values for normal mucosa subtracted from CRC of > 0.2) was observed for 6 of 18 probesets (33.3%) located within region from −658 bp to the end of the gene body ( and Figure S1). This data clearly demonstrates that the AQP1 promoter was hypermethylated in CRC compared to normal mucosa.
Figure 2. Methylation of AQP1 in normal mucosa and colorectal carcinoma from patients in the combined TCGA-COAD and TCGA-READ datasets. Average beta-values for all available individual probesets located in the region −500 to +500 bp from the AQP1 transcription start site (TSS) for normal mucosa (N, n = 32) and colorectal carcinoma (CRC, n = 317). Differential methylation (deltaBeta) was calculated by subtracting the average beta-value of N from CRC. Comparisons between N and CRC were considered statistically significant when the adjusted P value (adj. P) for the unpaired Welch’s t-test with Bonferroni correction for multiple comparisons was < 0.05. * adj. P < 0.05.
Reduced AQP1 expression correlated with promoter methylation in colorectal carcinoma tissues and colon cancer cell lines
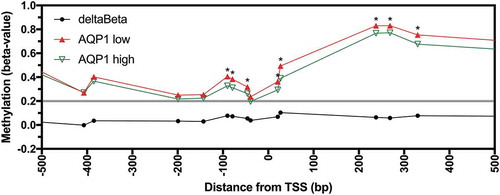
We investigated if AQP1 promoter methylation was associated with decreased expression in CRC tissues and cell lines. Expression and methylation data were available for the 317 CRC samples from the combined TCGA datasets. Statistically significant inverse correlations were observed for 15 of 16 probesets located in the region −658 to +3,051 bp from the TSS (Figure S3, Bonferroni adjusted P < 0.05). When the CRC samples were stratified based on low (FPKM < 11.4) or high (FPKM ≥ 11.4) AQP1 expression, low expression was associated with significant increases in methylation for 8 of 9 probesets located in the region −90 to +3,051 bp of the TSS and for the probeset at −658 bp ( and Figure S4; Bonferroni adjusted P < 0.05). This data suggest that AQP1 promoter methylation was associated with reduced transcript expression in CRC tissues.
Figure 3. Methylation of AQP1 in low and high AQP1 expressing colorectal carcinoma from patients in the combined TCGA-COAD and TCGA-READ datasets. Average beta-values for all available individual probesets located in the region −500 to +500 bp from the AQP1 transcription start site (TSS) for AQP1 low (n = 127) and high (n = 190) expressing colorectal carcinoma. Differential methylation (deltaBeta) was calculated by subtracting the average beta-value of AQP1 high from AQP1 low expressing CRC. Comparisons between AQP1 low and AQP1 high were considered statistically significant when the adjusted P value (adj. P) for the unpaired Welch’s t-test with Bonferroni correction for multiple comparisons was < 0.05. * adj. P < 0.05.
Next, we examined if reduced expression of AQP1 was associated with promoter methylation in colon cancer cell lines. Analysis of microarray gene expression datasets for cell lines that constitute the National Cancer Institute’s NCI60 panel, representing breast, central nervous system, colon, leukemia, melanoma, non-small cell lung cancer, ovarian, prostate and renal tumours, revealed that typically the highest expression of AQP1 was observed in the colon cancer cell line COLO 205. Of the seven colon cancer cell lines represented in the NCI60 panel, expression was relatively high in COLO 205, moderate in HT-29 and HCC2998 and low in SW620, KM12, HCT 116 and HCT 15 ()). We independently validated these findings in COLO 205, HT-29 and HCT 116 using AQP1 TaqMan Gene Expression Assays ()). Expression of AQP1 was significantly higher in COLO 205 compared to HT-29 (P < 0.0001), and in HT-29 compared to HCT 116 (P < 0.0001).
Figure 4. Low AQP1 expression was associated with increased promoter methylation in the NCI60 colon cancer cell lines. (a) AQP1 transcript expression in colon cancer cell lines from the NCI60 panel. Microarray gene expression data for the NCI60 panel were downloaded from Gene Expression Omnibus Datasets (GEO) using accession numbers GSE32474 and GSE2003, and log2 data were expressed relative to the expression in COLO 205. Data for GSE32474 are the average of triplicate microarrays. (b) Relative quantitation of AQP1 transcript expression was determined by the comparative CT method (2− ΔΔCT) in colon cancer cell lines using duplex TaqMan Gene Expression Assays, with PMM1 as endogenous control. Data are relative to COLO 205. Each data point is the average of triplicate reactions for three biological replicates, with bars representing the mean with standard deviation. (c) AQP1 methylation in colon cancer cell lines from the NCI60 panel. Beta-values were downloaded using GEO accession number GSE49143. Average beta-values were calculated for the low (HCT 15, KM12, SW620 and HCT 116) and the high to moderate (high/mod.) AQP1 expressing colon cancer cell lines (COLO 205, HT-29, HCC2998). Differential methylation (deltaBeta) was calculated by subtracting the average beta-value of the high/mod. from the low expressing cell lines. Comparisons between low and high/mod. were considered statistically significant when the P value for the unpaired Welch’s t-test was < 0.05. * P < 0.05. (d) RNA-Seq data for HT-29 treated with 0, 5 or 10 µM 5-aza-dC for five days were downloaded using accession number GSE41586. Data are the mean with standard deviation of three biological replicates, expressed relative 0 µM 5-aza-dC. (e) Relative quantitation of AQP1 transcript expression in COLO 205, HT-29 and HCT 116 following five days of treatment with 5-aza-dC. Data are the mean with standard deviation of three biological replicates, expressed relative 0 µM 5-aza-dC.
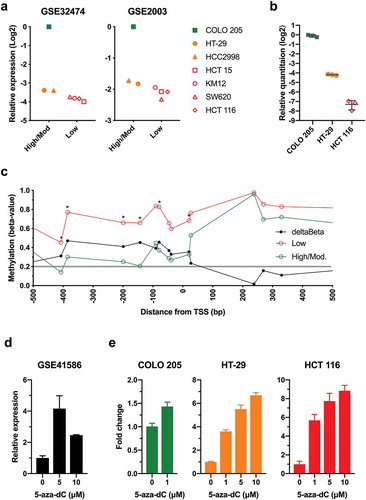
Analysis of the DNA methylation for the colon cancer cell lines stratified based on the level of AQP1 transcript expression suggested that low expression was associated with an increase in methylation for the probesets located near the TSS () and Figure S5; P < 0.05). Differences were observed for 5 of 10 probesets located within the promoter region between −5,000 and −1 bp upstream of the TSS, and in 1 of 9 probesets in the gene body. Differential methylation (deltaBeta > 0.2) calculated by subtracting the average beta-value of the high to moderate from the low expressing cell lines was observed in 13 of 21 probesets ()); all 10 probesets in the region from −407 to +27 bp and the three probesets in the region from +1653 to +9,315 bp.
Next, we analyzed the transcriptional response to the global demethylating agent 5-aza-2ʹ-deoxycytidine (5-aza-dC). Analysis of a publicly available dataset [Citation18] demonstrated that treatment of HT-29 with 5 and 10 µM 5-aza-dC for 5 d induced significant upregulation of AQP1 transcript expression (); P = 0.0004 and P = 0.0171, respectively). To confirm and expand on these findings, we measured changes in AQP1 expression in COLO 205, HT-29, and HCT 116, which display low, intermediate and high AQP1 promoter methylation respectively (Figure S5), treated with 5-aza-dC ()). Treatment of COLO 205 with 1 µM resulted in a slight (1.4-fold), statistically significant increase in AQP1 expression (P = 0.0031). In contrast, treatment of HT-29 and HCT 116 with either 1, 5 or 10 µM aza-dC resulted in marked (> 3.6-fold for all), significant increases in AQP1 expression (P < 0.0001 for all), with the magnitude of the changes being greater in HCT 116. Together, these data provide strong evidence that reduced AQP1 transcript expression was associated with promoter hypermethylation in CRC tissues and colon cancer cell lines.
The BRAFV600E mutation alone was not associated with AQP1 promoter hypermethylation
The mechanisms driving aberrant AQP1 promoter hypermethylation that was observed in CRC are unknown. The BRAFV600E mutation is known to be associated with high CpG island methylator phenotype (H-CIMP) in CRC. We investigated if the BRAFV600E mutation was associated with AQP1 methylation in tissues and cell lines. Of the 317 CRC with methylation data, 275 had wildtype BRAF, 26 had a BRAFV600E mutation, and 16 had other BRAF mutations. Differential methylation (deltaBeta > 0.2) between wildtype and BRAFV600E CRC was not observed for any of the probesets ()). Methylation was significantly greater in CRC that harboured the BRAFV600E mutation compared to wildtype for 1 of 21 probesets, located +1,653 bp from the AQP1 TSS (Figure S6; Bonferroni adjusted P < 0.05).
Figure 5. AQP1 methylation in colorectal carcinoma tissues and cell lines according to BRAFV600E mutation status. Average beta-values for all individual probesets located in the region from −5,000 to +25,000 bp of the AQP1 transcription start site (TSS) for (a) TCGA CRC tissues, and (b) the NCI60 panel of cell lines. Differential methylation (deltaBeta) was calculated by subtracting the average beta-value of samples with wildtype from samples with a BRAFV600E mutation.
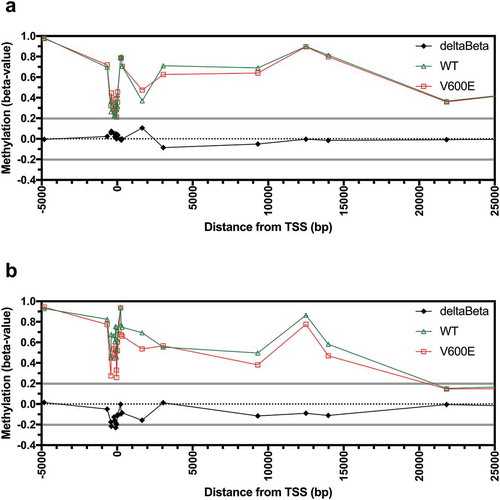
Finally, we investigated if the BRAFV600E mutation was associated with AQP1 promoter methylation in the NCI60 cell lines. Analysis of the mutation data deposited in the Catalogue of Somatic Mutation in Cancer database (COSMIC; http://cancer.sanger.ac.uk/cosmic [Citation19],) demonstrated that the BRAFV600E mutation was present in two of seven colon cancer (COLO 205 and HT-29) and seven of nine melanoma cell lines. Another two cell lines, the colon cancer line KM12 and the breast cancer line MDA-MB-231, had other mutations in BRAF. One of the 60 cell lines (NCI-ADR-RES) was excluded from the analysis because it was known to be contaminated with OVCAR-8. In contrast to CRC tissues, reduced differential methylation (deltaBeta < −0.2) was observed in the cell lines with the BRAFV600E mutation compared to wildtype for 3 of 21 probesets, located at −385, −90, and −39 bp from the TSS ()). However, differential methylation was not statistically significant for any of the 21 probesets analyzed (Figure S7).
Discussion
Our analysis of publicly available datasets revealed that AQP1 transcript expression was significantly decreased in CRC compared to normal mucosa. In CRC, expression increased with advanced disease, and was associated with a significant decrease in OS with univariate but not with multivariable analysis when the confounders stage and age were considered. AQP1 promoter methylation was significantly increased in CRC compared to normal mucosa, and analysis of CRC tissues and cell lines strongly suggested that AQP1 promoter hypermethylation was associated with decreased expression. The BRAFV600E mutation alone did not explain the increase in promoter methylation.
We report the novel findings that the AQP1 promoter was hypomethylated in normal colonic mucosa, hypermethylated in a significant proportion of CRC, and methylation was associated with decreased transcript expression in CRC patient tissues and colon cancer cell lines. Further, treatment of colon cancer cell lines with a global demethylating agent, 5-aza-dC, significantly increased AQP1 expression. To the best of our knowledge, regulation of AQP1 expression by promoter methylation has previously only been demonstrated in glioblastoma multiform, normal salivary tissue and an adenoid cystic carcinoma cell line (SACC83), and a hypomethylated promoter was associated with a relative increase in expression in a proportion of salivary gland adenoid cystic carcinomas [Citation15–Citation17]. Treatment of the SACC83 cell line with global demethylating agents, 5-aza-dC and trichostatin A, decreased AQP1 promoter methylation and upregulated expression, providing further supportive evidence that AQP1 promoter methylation was associated with a reduction in transcript expression [Citation16].
There are limited published data comparing AQP1 expression in normal colonic mucosa to CRC. Imaizumi et al reported that AQP1 protein was not detected in the normal epithelial cells but was expressed in 112 of 268 (41.8%) of stage 0 to IV CRC [Citation10]. Mobasheri et al evaluated the relative abundance and distribution of AQP1 protein using immunohistochemistry and quantitative histomorphometric analysis of tissue microarrays. They reported that AQP1 was expressed in capillary endothelia of normal tissues, and expression was higher in the microvascular structures of CRC. AQP1 was observed in some neoplastic tumour cells, however they did not comment on expression in normal colonic mucosa [Citation20]. Moon et al using in situ hybridization reported strong AQP1 transcript expression in the colon cancers and adenomas from 12 patients, with almost no expression in adjacent normal mucosa [Citation21]. In contrast, we had previously reported using TaqMan PCR that AQP1 transcript expression was higher in patient matched normal colonic mucosa compared to CRC for 35 of 57 (61%) patients [Citation22]. Confirming our previous findings, we report here that AQP1 transcript expression was significantly greater in normal mucosa compared to CRC for 40 of 47 (85%) patient matched samples available in combined TCGA datasets. Furthermore, analysis of multiple publicly available datasets in Oncomine provided further supportive evidence that transcript expression was significantly greater in normal mucosa compared to CRC. However, a limitation of these studies that assessed AQP1 transcript expression is that we cannot be certain that transcript expression was restricted to the epithelia, nor that transcript levels translated to protein expression.
Previous reports found that AQP1 protein was expressed in 40–60% of CRC. Yoshida et al reported expression in 56 of 120 (46.7%) patients with stage II and III colon cancer [Citation8]. Imaizumi et al reported expression in 112 of 268 (41.8%) patients with stage 0-IV CRC [Citation10]. In the largest study previously reported, Kang et al reported strong positive staining in 298 of 486 patients with stage I-III colon cancer (61.3%) [Citation9]. Our finding that AQP1 promoter methylation was associated with decreased transcript expression provides an explanation for the lack of expression in a significant proportion of CRC.
The clinical significance of AQP1 protein expression in CRC has yielded conflicting results. Yoshida et al reported that expression was associated with decreased OS and multivariable analysis suggested that AQP1 expression was an independent prognostic risk factor (Risk Ratio 2.593, 95% CI 1.057–6.439, P = 0.038) [Citation8]. The multivariable model consisted of the confounders age (≥ 75 y), site of primary, presence of bowel obstruction, depth of invasion, lymph node involvement, and elevated carcinoembryonic antigen. Expression was more common in left compared to right-sided tumours and was associated with lymph node involvement, lymphovascular and vascular invasion. More recently, Imaizumi et al reported that expression was associated with increased depth of invasion, lymph node metastasis, lymphatic invasion, and venous invasion [Citation10]. Positive expression was more common in left compared to right-sided tumours, and in moderately compared to well differentiated tumours. They did not report on OS. Expression was not associated with disease-free survival (DFS) in patients with stage II and III CRC following surgery with curative intent. Interestingly, amongst the 84 patients with stage II and III disease that received adjuvant chemotherapy, low AQP1 expression was associated with decreased DFS (HR 0.45, 95% CI 0.21–1.00, P = 0.05). In contrast to the other studies, Kang et el reported that strong positivity was associated with decreased lymph node metastasis [Citation9]. They did not report on expression by side. Expression did not correlate with either OS or DFS.
The reasons for the conflicting results between previous studies assessing protein expression are uncertain. It may be due to the lack of standardization between studies. The immunohistochemical staining protocol varied between studies. Each study used a different anti-AQP1 antibody and it was not clear if the antibodies had been validated. Different antigen retrieval protocols were used. The definition of AQP1-positivity and the scoring protocol varied between studies. Membranous and cytoplasmic staining of tumour cells was assessed in two studies [Citation9,Citation10], but it was not defined in the other study [Citation8]. These differences make direct comparisons between the studies and interpretation of the results difficult.
Previous studies suggest that AQP1 promotes tumour progression by enhancing cancer cell migration and metastasis, and by increasing endothelial migration and microvessel density (reviewed in [Citation6]). In vitro studies have demonstrated that knockdown of AQP1 reduced viability, migration and invasion and promoted apoptosis in ovarian cancer cells [Citation23], induced apoptosis and inhibited proliferation, adhesion and invasion in osteosarcoma cells [Citation24], significantly decreased migration and invasion of lung cancer cells [Citation25], reduced the migration capacity of melanoma [Citation26], colon cancer [Citation27], and endothelial cells [Citation26]. Overexpression of AQP1 has been shown to accelerate cell migration in vitro [Citation7,Citation27]. In vivo studies have demonstrated that overexpression of AQP1 in colon cancer cells increased pulmonary extravasation in a metastatic murine model [Citation27]. AQP1 knockdown by intratumoural injection of siRNA reduced tumour volume and microvessel density in a murine melanoma model [Citation28]. Furthermore, AQP1 knockout mice developed smaller tumours with reduced microvessel density and fewer metastases compared to wildtype mice [Citation7,Citation29].
The mechanisms leading to AQP1 promoter methylation in CRC are currently unclear. Mutations in BRAF are known to alter its kinase activity and subsequently impact on the activation of mitogen-activated protein pathway [Citation30]. In melanoma, BRAFV600E mutation was associated with an increase in AQP1 expression, and increased expression was associated with decreased progression-free and overall survival [Citation31]. In CRC, BRAFV600E mutation was associated with a high CpG island methylator phenotype (H-CIMP) [Citation32,Citation33]. However, we did not find a consistent association between BRAFV600E mutation and AQP1 promoter hypermethylation in CRC tissues and colon cancer cell lines. In CRC tissues, methylation of only one probeset, located at +1653 bp from the TSS, was significantly higher in tumours that harboured a BRAFV600E mutation compared to wildtype. In contrast, BRAFV600E colon cancer cell lines typically had lower AQP1 promoter methylation and expressed higher levels of AQP1 transcript compared to wildtype. Together, this suggests that a BRAFV600E mutation alone does not explain aberrant AQP1 promoter methylation.
In conclusion, AQP1 transcript expression was significantly decreased in CRC compared to normal colonic mucosa. Reduced expression was associated with AQP1 promoter hypermethylation and an increase in overall survival with univariate but not multivariable analysis. The BRAFV600E mutation did not appear to explain the aberrant AQP1 promoter methylation.
Materials and methods
In silico data
For tissues, RNA sequencing expression (median number of fragments per kilobase of exon per million reads, FPKM), Infinium HumanMethylation450 BeadChip (HM450) DNA methylation (beta-values), and BRAF mutation data were obtained from TCGA Research Network (http://cancergenome.nih.gov/). Expression data were available for a total of 597 CRC patients deposited in the combined TCGA-COAD (n = 438) and TCGA-READ (n = 159) datasets. Of these, seven samples were excluded because the site of primary diagnosis could not be confirmed as CRC; for four samples the site was not recorded, two were coded as malignant neoplasm of the connective and soft tissue of abdomen, and one was coded as malignant (primary) neoplasm, unspecified. A total of 590 CRC patients had AQP1 transcript expression data for subsequent analyzes (Additional file 1: Table S1).
For the NCI60 cancer cell lines, microarray gene expression were downloaded from Gene Expression Omnibus (GEO) Datasets using accession numbers GSE32474 [Citation34] and GSE2003 [Citation35]. HM450 data for the NCI60 were downloaded using GEO Datasets accession number GSE49143. BRAF mutation data were obtained COSMIC (http://cancer.sanger.ac.uk/cosmic) [Citation19].
For the RNA-Seq transcriptomic profiles generated from 5-aza-deoxycytidine treated HT-29 colon cancer cells, data were downloaded from GEO using the accession number GSE41586 [Citation18].
Cell lines
Colon cancer cell lines were obtained from American Type Culture Collection (ATCC, Manassas, VA, USA). Cell lines were maintained in either RPMI-1640 (COLO 205) or DMEM (HT-29 and HCT 116) supplemented with 10% foetal bovine serum, 1x Glutamax, 200 U/mL penicillin, and 200 mg/mL streptomycin (Thermo Fisher Scientific, Waltham, MA, USA) at 37°C in a humidified incubator with 5% CO2 in air.
Treatment with 5-aza-2ʹ-deoxycytidine
To study the effects of the global demethylating agent 5-aza-2ʹ-deoxycytidine (5-aza-dC), 2.5 × 10⁴ cells were seeded into triplicate wells of a 6-well plate. The following day, the media were replaced with fresh media supplemented with either 0, 1, 5 or 10 µM 5-aza-dC (Sigma-Aldrich, St Louis, MO, USA), as described previously [Citation36–Citation38], and the cells were treated for five days.
Analysis of AQP1 expression by quantitative PCR
Total RNA was isolated using the PureLink RNA Mini Kit (Thermo Fisher Scientific), and 200 ng was reverse transcribed using the iScript cDNA Synthesis Kit (Bio-Rad Laboratories, Hercules, CA, USA) in a final volume of 20 µL. Transcript expression was determined using duplex TaqMan Gene Expression Assays for AQP1 (Hs01028916_m1) and phosphomannose mutase 1 (PMM1; Hs00963625_m1; Thermo Fisher Scientific) using Sso Advanced Universal Probes Supermix (Bio-Rad Laboratories) as described previously [Citation39], using a ViiA7 Real-Time PCR System (Thermo Fisher Scientific). Results were calculated using the comparative CT method for relative quantitation (2− ΔΔCT).
Statistical analysis
Patients were stratified into high or low AQP1 transcript expression using the best separation of the combined TCGA RNA sequencing expression data. To choose the best FPKM cut-off for grouping the patients most significantly, all FPKM values from the 20th to 80th percentiles were used to group the patients, significant differences in the survival outcomes of the groups were examined by Kaplan-Meier survival estimators and the value yielding the lowest log-rank P value was selected. The prognosis of each group of patients was examined, and the survival outcomes of the two groups were compared by the log-rank test using Prism v7.0d for Mac OS X (GraphPad Software, Inc. La Jolla, CA, USA).
The association between AQP1 expression and overall survival was assessed using Cox Proportional Hazards models. Unadjusted hazard ratios are reported along with the hazard ratio adjusted for other significant and independent predictors of survival (age and stage). The analysis included all 453 patients with complete data on the outcome and predictor variables. All tests were two-tailed and assessed at the 5% alpha level. The analyzes were conducted using SAS v9.4 (SAS Institute Inc., Cary, NC, USA).
Comparisons of methylation (beta-values) between groups for individual probesets were assessed using unpaired Welch’s t-test. Correlations between AQP1 expression and methylation in CRC were assessed using the Spearman correlation coefficient. P values were adjusted for multiple comparisons using the Bonferroni correction. Comparison between relative quantitation of AQP1 transcript expression between cell lines and in response to 5-aza-dC treatment was determined using unpaired t-test and one-way analysis of variance with Dunnett’s multiple comparisons test. All tests were two-tailed and assessed at the 5% alpha level. The analyzes were conducted using Prism v7.0d for Mac OS X.
Availability of data and material
For tissues, RNAseq expression, HM450 DNA methylation, and BRAF mutation data were obtained from TCGA Research Network (http://cancergenome.nih.gov/). For the NCI60 cell lines, microarray gene expression and HM450 DNA methylation data were downloaded from GEO Datasets using accession numbers GSE32474, GSE2003, and GSE49143. BRAF mutation data for the cell lines was obtained COSMIC. For the HT-29 colon cancer cells treated with 5-aza-dC, RNA-Seq data were downloaded from GEO Datasets using the accession number GSE41586.
Authors’ contributions
ES and JEH conceived the paper. ES designed and performed the analysis for all the experiments, except SH performed univariate and multivariable Cox Proportional Hazards models. ES prepared the manuscript. All authors read, revised and approved the final manuscript.
Supplemental Material
Download Zip (21.7 MB)Acknowledgments
The results published here are in whole or part based upon data generated by TCGA Research Network: http://cancergenome.nih.gov/.
Disclosure statement
No potential conflict of interest was reported by the authors.
Supplementary material
Supplementary data for this article can be accessed on publisherʹs website.
Related Research Data
References
- Ferlay J, Soerjomataram I, Dikshit R, et al. Cancer incidence and mortality worldwide: sources, methods and major patterns in GLOBOCAN 2012. Int J Cancer. 2015 Mar 1;136(5):E359–E86. PubMed PMID: 25220842.
- Young PE, Womeldorph CM, Johnson EK, et al. Early detection of colorectal cancer recurrence in patients undergoing surgery with curative intent: current status and challenges. J Cancer. 2014;5(4):262–271. PubMed PMID: 24790654; PubMed Central PMCID: PMCPMC3982039.
- Siegel RL, Miller KD, Fedewa SA, et al. Colorectal cancer statistics, 2017. CA Cancer J Clin. 2017 May 6;67(3):177–193. PubMed PMID: 28248415.
- Van Cutsem E, Cervantes A, Adam R, et al. ESMO consensus guidelines for the management of patients with metastatic colorectal cancer. Ann Oncol. 2016 Aug;27(8):1386–1422. PubMed PMID: 27380959.
- Agre P, King LS, Yasui M, et al. Aquaporin water channels–from atomic structure to clinical medicine. J Physiol. 2002 July 1;542(Pt 1):3–16. PubMed PMID: 12096044; PubMed Central PMCID: PMCPMC2290382.
- Tomita Y, Dorward H, Yool AJ, et al. Role of aquaporin 1 signalling in cancer development and progression. Int J Mol Sci. 2017 Jan 29;18(2). DOI:10.3390/ijms18020299 PubMed PMID: 28146084.
- Saadoun S, Papadopoulos MC, Hara-Chikuma M, et al. Impairment of angiogenesis and cell migration by targeted aquaporin-1 gene disruption. Nature. 2005 Apr 07;434(7034):786–792. PubMed PMID: 15815633.
- Yoshida T, Hojo S, Sekine S, et al. Expression of aquaporin-1 is a poor prognostic factor for stage II and III colon cancer. Mol Clin Oncol. 2013 Nov 1;(6):953–958. DOI:10.3892/mco.2013.165 PubMed PMID: 24649276; PubMed Central PMCID: PMCPMC3916155.
- Kang BW, Kim JG, Lee SJ, et al. Expression of aquaporin-1, aquaporin-3, and aquaporin-5 correlates with nodal metastasis in colon cancer. Oncology. 2015;88(6):369–376. PubMed PMID: 25721378; eng.
- Imaizumi H, Ishibashi K, Takenoshita S, et al. Aquaporin 1 expression is associated with response to adjuvant chemotherapy in stage II and III colorectal cancer. Oncol Lett. 2018 May;15(5):6450–6456. PubMed PMID: 29725400; PubMed Central PMCID: PMCPMC5920209.
- Robertson KD. DNA methylation and human disease. Nat Rev Genet. 2005 Aug;6(8):597–610. PubMed PMID: 16136652.
- Suzuki MM, Bird A. DNA methylation landscapes: provocative insights from epigenomics. Nat Rev Genet. 2008 June;9(6):465–476. PubMed PMID: 18463664.
- Sproul D, Nestor C, Culley J, et al. Transcriptionally repressed genes become aberrantly methylated and distinguish tumors of different lineages in breast cancer. Proc Natl Acad Sci U S A. 2011 Mar 15;108(11):4364–4369. PubMed PMID: 21368160; PubMed Central PMCID: PMCPMC3060255.
- Fadda A, Gentilini D, Moi L, et al. Colorectal cancer early methylation alterations affect the crosstalk between cell and surrounding environment, tracing a biomarker signature specific for this tumor. Int J Cancer. 2018 Aug 15;143(4):907–920. PubMed PMID: 29542109.
- Tan M, Shao C, Bishop JA, et al. Aquaporin-1 promoter hypermethylation is associated with improved prognosis in salivary gland adenoid cystic carcinoma. Otolaryngol Head Neck Surg. 2014 May;150(5):801–807. PubMed PMID: 24493792; PubMed Central PMCID: PMCPMC4318231.
- Shao C, Sun W, Tan M, et al. Integrated, genome-wide screening for hypomethylated oncogenes in salivary gland adenoid cystic carcinoma. Clin Cancer Res. 2011 July 1;17(13):4320–4330. PubMed PMID: 21551254; PubMed Central PMCID: PMCPMC3131484. eng.
- Smith AA, Huang YT, Eliot M, et al. A novel approach to the discovery of survival biomarkers in glioblastoma using a joint analysis of DNA methylation and gene expression. Epigenetics. 2014 June;9(6):873–883. PubMed PMID: 24670968; PubMed Central PMCID: PMCPMC4065185.
- Xu X, Zhang Y, Williams J, et al. Parallel comparison of illumina RNA-Seq and affymetrix microarray platforms on transcriptomic profiles generated from 5-aza-deoxy-cytidine treated HT-29 colon cancer cells and simulated datasets. BMC Bioinformatics. 2013;14(Suppl 9):S1. PubMed PMID: 23902433; PubMed Central PMCID: PMCPMC3697991.
- Forbes SA, Beare D, Boutselakis H, et al. COSMIC: somatic cancer genetics at high-resolution. Nucleic Acids Res. 2017 Jan 4;45(D1):D777–D783. PubMed PMID: 27899578; PubMed Central PMCID: PMCPMC5210583.
- Mobasheri A, Airley R, Hewitt SM, et al. Heterogeneous expression of the aquaporin 1 (AQP1) water channel in tumors of the prostate, breast, ovary, colon and lung: a study using high density multiple human tumor tissue microarrays. Int J Oncol. 2005 May;26(5):1149–1158. PubMed PMID: 15809704; eng.
- Moon C, Soria JC, Jang SJ, et al. Involvement of aquaporins in colorectal carcinogenesis. Oncogene. 2003 Oct 02;22(43):6699–6703. PubMed PMID: 14555983; eng.
- Dorward HS, Du A, Bruhn MA, et al. Pharmacological blockade of aquaporin-1 water channel by AqB013 restricts migration and invasiveness of colon cancer cells and prevents endothelial tube formation in vitro. J Exp Clin Cancer Res. 2016 Feb;24(35):36. PubMed PMID: 26912239; PubMed Central PMCID: PMCPMC4765103. eng.
- Wang Y, Fan Y, Zheng C, et al. Knockdown of AQP1 inhibits growth and invasion of human ovarian cancer cells. Mol Med Rep. 2017 Oct;16(4):5499–5504. PubMed PMID: 28849036.
- Wu Z, Li S, Liu J, et al. RNAi-mediated silencing of AQP1 expression inhibited the proliferation, invasion and tumorigenesis of osteosarcoma cells. Cancer Biol Ther. 2015;16(9):1332–1340. PubMed PMID: 26176849; PubMed Central PMCID: PMCPMC4623513.
- Wei X, Dong J. Aquaporin 1 promotes the proliferation and migration of lung cancer cell in vitro. Oncol Rep. 2015 Sep;34(3):1440–1448. PubMed PMID: 26151179.
- Monzani E, Bazzotti R, Perego C, et al. AQP1 is not only a water channel: it contributes to cell migration through Lin7/beta-catenin. PLoS One. 2009 July 8;4(7):e6167. PubMed PMID: 19584911; PubMed Central PMCID: PMCPMC2701997.
- Jiang Y. Aquaporin-1 activity of plasma membrane affects HT20 colon cancer cell migration. IUBMB Life. 2009 Oct;61(10):1001–1009. PubMed PMID: 19787701; eng.
- Nicchia GP, Stigliano C, Sparaneo A, et al. Inhibition of aquaporin-1 dependent angiogenesis impairs tumour growth in a mouse model of melanoma. J Mol Med (Berl). 2013 May;91(5):613–623. PubMed PMID: 23197380.
- Esteva-Font C, Jin BJ, Verkman AS. Aquaporin-1 gene deletion reduces breast tumor growth and lung metastasis in tumor-producing MMTV-PyVT mice. FASEB J. 2014 Mar;28(3):1446–1453. PubMed PMID: 24334548; PubMed Central PMCID: PMCPMC3929666.
- Yao Z, Yaeger R, Rodrik-Outmezguine VS, et al. Tumours with class 3 BRAF mutants are sensitive to the inhibition of activated RAS. Nature. 2017 Aug 10;548(7666):234–238. PubMed PMID: 28783719; PubMed Central PMCID: PMCPMC5648058.
- Imredi E, Toth B, Doma V, et al. Aquaporin 1 protein expression is associated with BRAF V600 mutation and adverse prognosis in cutaneous melanoma. Melanoma Res. 2016 June;26(3):254–260. PubMed PMID: 26848795.
- Bond CE, Liu C, Kawamata F, et al. Oncogenic BRAF mutation induces DNA methylation changes in a murine model for human serrated colorectal neoplasia. Epigenetics. 2018;13(1):40–48. PubMed PMID: 29235923; PubMed Central PMCID: PMCPMC5836984.
- Kambara T, Simms LA, Whitehall VL, et al. BRAF mutation is associated with DNA methylation in serrated polyps and cancers of the colorectum. Gut. 2004 Aug;53(8):1137–1144. PubMed PMID: 15247181; PubMed Central PMCID: PMCPMC1774130.
- Pfister TD, Reinhold WC, Agama K, et al. Topoisomerase I levels in the NCI-60 cancer cell line panel determined by validated ELISA and microarray analysis and correlation with indenoisoquinoline sensitivity. Mol Cancer Ther. 2009 July;8(7):1878–1884. PubMed PMID: 19584232; PubMed Central PMCID: PMCPMC2728499.
- Ross DT, Scherf U, Eisen MB, et al. Systematic variation in gene expression patterns in human cancer cell lines. Nat Genet. 2000 Mar;24(3):227–235. PubMed PMID: 10700174.
- Smith E, Ruszkiewicz AR, Jamieson GG, et al. IGFBP7 is associated with poor prognosis in oesophageal adenocarcinoma and is regulated by promoter DNA methylation. Br J Cancer. 2014 Feb 4;110(3):775–782. PubMed PMID: 24357797; PubMed Central PMCID: PMCPMC3915137.
- Smith E, Drew PA, Tian ZQ, et al. Metallothionien 3 expression is frequently down-regulated in oesophageal squamous cell carcinoma by DNA methylation. Mol Cancer. 2005 Dec;13(4):42. PubMed PMID: 16351731; PubMed Central PMCID: PMCPMC1343579.
- Smith E, De Young NJ, Pavey SJ, et al. Similarity of aberrant DNA methylation in Barrett’s esophagus and esophageal adenocarcinoma. Mol Cancer. 2008 Oct;02(7):75. PubMed PMID: 18831746; PubMed Central PMCID: PMCPMC2567345.
- Smith E, Palethorpe HM, Tomita Y, et al. The purified extract from the medicinal plant bacopa monnieri, bacopaside II, inhibits growth of colon cancer cells in vitro by inducing cell cycle arrest and apoptosis. Cells. 2018 July 21;7(7). DOI:10.3390/cells7070081 PubMed PMID: 30037060.