
ABSTRACT
The POTE gene family consists of 14 homologous genes localized to autosomal pericentromeres, and a sub-set of POTEs are cancer-testis antigen (CTA) genes. POTEs are over-expressed in epithelial ovarian cancer (EOC), including the high-grade serous subtype (HGSC), and expression of individual POTEs correlates with chemoresistance and reduced survival in HGSC. The mechanisms driving POTE overexpression in EOC and other cancers is unknown. Here, we investigated the role of epigenetics in regulating POTE expression, with a focus on DNA hypomethylation. Consistent with their pericentromeric localization, Pan-POTE expression in EOC correlated with expression of the pericentromeric repeat NBL2, which was not the case for non-pericentromeric CTAs. POTE genomic regions contain LINE-1 (L1) sequences, and Pan-POTE expression correlated with both global and POTE-specific L1 hypomethylation in EOC. Analysis of individual POTEs using RNA-seq and DNA methylome data from fallopian tube epithelia (FTE) and HGSC revealed that POTEs C, E, and F have increased expression in HGSC in conjunction with DNA hypomethylation at 5’ promoter or enhancer regions. Moreover, POTEs C/E/F showed additional increased expression in recurrent HGSC in conjunction with 5’ hypomethylation, using patient-matched samples. Experiments using decitabine treatment and DNMT knockout cell lines verified a functional contribution of DNA methylation to POTE repression, and epigenetic drug combinations targeting histone deacetylases (HDACs) and histone methyltransferases (HMTs) in combination with decitabine further increased POTE expression. In summary, several alterations of the cancer epigenome, including pericentromeric activation, global and locus-specific L1 hypomethylation, and locus-specific 5’ CpG hypomethylation, converge to promote POTE expression in ovarian cancer.
Introduction
Epithelial ovarian cancer (EOC) is the deadliest gynecologic malignancy [Citation1]. High-grade serous EOC (HGSC), the most prevalent EOC subtype, is diagnosed at late stage and accounts for most EOC cases and deaths [Citation2,Citation3]. EOC is characterized by genetic and epigenetic alterations, the latter including DNA methylation changes [Citation2,Citation4-Citation6]. For example, some tumors display BRCA1 hypermethylation, which can disrupt DNA repair [Citation2]. In addition, a large group of EOC are characterized by global DNA hypomethylation, which may promote genomic instability [Citation7,Citation8].
POTE (Protein expressed in Prostate, Ovary, Testis, and Placenta) is a multigene family overexpressed in several human cancers [Citation9]. There are 14 POTEs, which are classified into three groups based on phylogeny, and are dispersed on seven chromosomes () [Citation10-Citation12]. POTEs originated from an ancestral version of ankyrin repeat domain 26 (ANKRD26) [Citation11], a gene mutated in familial thrombocytopenia 2 (THC2) [Citation13,Citation14]. Genomically, POTEs localize to pericentromeres or ancestral pericentromeres [Citation10] (), and contain a L1 element localized to the 3’ UTR [Citation10,Citation15]. The 3’ L1 may have promoted POTE dispersal through the primate genome via transposition. Interestingly, several POTEs contain a C-terminal in-frame fusion with Actin, resulting from L1 transposition [Citation10,Citation15]. Structurally, POTE proteins possess an N-terminal cysteine-rich region, central ankyrin repeats, and C-terminal spectrin-like α-helices, which suggests participation in protein-protein interactions and association with cell membranes [Citation15,Citation16]. In agreement, POTEs localize to the plasma membrane, and specific POTEs co-localize with actin filaments [Citation15,Citation17].
Table 1. POTE Gene Family.
Early studies of POTEs suggested that, based on expression, they should be classified as CTA genes [Citation9]. CTAs [also known as cancer-germline (CG) genes] are repressed in somatic tissues other than testis, fetal ovary, and placenta, but are expressed in cancer [Citation18,Citation19]. The formal definition of CTA genes is based on expression pattern but, importantly, some CTAs are immunogenic, which has spurred the development of CTA-targeted cancer immunotherapies [Citation18,Citation20]. A recent report suggests that CTA expression correlates with a beneficial clinical response to anti-PD1 immune checkpoint therapy [Citation21]. Notably, CTAs have additional importance in cancer biology because they promote oncogenic phenotypes [Citation22-Citation35].
Recently, we used RNA-seq data to determine the expression patterns of individual POTE genes in normal and tumor tissues, with a focus on ovarian cancer [Citation36]. Our analyses revealed that Group 1 & 2 POTEs (POTEs A/B/C/D) have a characteristic CTA expression profile, with significant expression limited to testis and cancer, while Group 3 POTEs (POTEs E/F/G/H/I/J/KP/M) are expressed in several normal tissues as well as in cancer (). Notably, the majority (10/13) of POTEs were overexpressed in HGSC, including all three groups, regardless of whether they were CTAs [Citation36].
The mechanisms responsible for increased POTE expression in cancer are unknown. In this context, several previous studies have implicated global and promoter-specific DNA hypomethylation as key mechanisms promoting CTA expression in cancer, including in EOC [Citation7,Citation18,Citation37-Citation46]. Related epigenetic mechanisms, including histone modifications and nucleosome occupancy, also regulate CTA genes, although these appear secondary to DNA methylation [Citation18,Citation42,Citation47-Citation51]. In addition, pericentromeric regions, on which POTEs reside, are epigenetically regulated [Citation52]. Here, we tested whether epigenetic alterations promote POTE expression in ovarian cancer, focusing on DNA hypomethylation. Our findings lay initial groundwork for understanding mechanisms of POTE gene regulation in normal tissues and cancer.
Results
Pan-POTE expression in EOC is associated with expression of the pericentromeric repeat NBL2
All POTEs are localized to current or ancestral pericentromeres () [Citation10,Citation11]. As pericentromeres are epigenetically regulated [Citation52], we hypothesized that POTE expression in EOC may reflect, in part, the activation state of pericentromeric DNA. As a biomarker for the epigenetic status of pericentromeres, we measured expression of the NBL2 repetitive element [Citation53-Citation55]. Pan-POTE expression is significantly elevated in EOC compared to normal ovary (NO) ()) [Citation36]. NBL2 showed increased expression in EOC vs. NO, but the difference was not significant ()). Notably, Pan-POTE and NBL2 expression showed a significant correlation in EOC ()). To assess the biological significance of this association, we determined NBL2 correlations with non-pericentromeric CTA gene expression. NBL2 did not correlate with non-pericentromeric CTAs, with one exception (). These data suggest that increased POTE expression in EOC correlates with epigenetic activation of pericentromeric DNA.
Table 2. Pan-POTE and CTA correlations with NBL2 expression in EOC.
Figure 1. Pan-POTE expression is associated with NBL2 expression in EOC. (a) PAN-POTE RNA expression in normal ovary (NO) and primary EOC. (b) NBL2 RNA expression in NO and primary EOC. (c) Pan-POTE RNA vs. NBL2 RNA in primary EOC. RNA expression was normalized to 18s rRNA. Panels A-B plot median values and two-tailed Mann-Whitney test results, and panel C shows Spearman correlation test results.
Pan-POTE expression in EOC is associated with global L1 and POTE-L1 DNA hypomethylation.
CTA expression correlates with global genomic DNA hypomethylation, which can be monitored using global L1 methylation [Citation8,Citation39,Citation56]. Because some POTEs have a CTA expression pattern () [Citation36], we hypothesized that Pan-POTE expression may correlate with global L1 hypomethylation in EOC; our data verified this hypothesis ()). To test this association with higher resolution, we used Affymetrix microarrays to profile POTE sub-group expression, as recently described [Citation36]. We used two groups of primary EOC samples showing divergent L1 methylation (n = 20/group). In agreement with Pan-POTE data, several POTE sub-groups showed significantly elevated expression in L1 hypomethylated EOC, and no sub-group was significantly down-regulated (Figure S1).
Figure 2. Pan-POTE expression is associated with LINE-1 (L1) DNA hypomethylation in EOC. (a) Pan-POTE RNA vs. global L1 methylation in primary EOC. (b) POTE (GHM) L1 methylation in NO and primary EOC. (c) Pan-POTE RNA vs. POTE (GHM) L1 in primary EOC. Panels A & C show Spearman correlation test results, and panel B shows two-tailed Mann-Whitney test results.
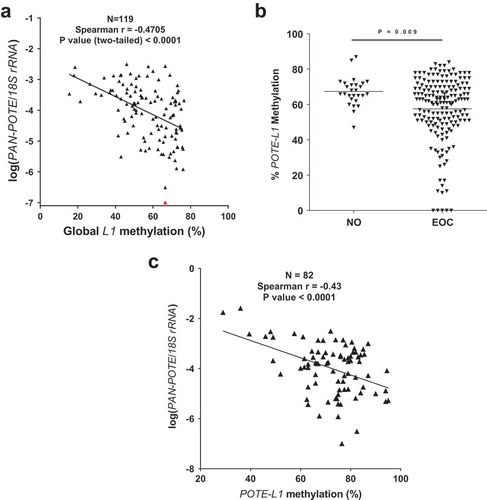
POTE genes were originally reported to contain a conserved L1 element in their 3’ UTRs [Citation10,Citation15]. Based on the inverse relationship between Pan-POTE expression and global L1 methylation, we hypothesized that DNA methylation of POTE-L1 sequences may also associate with POTE expression. To test this, we first analyzed POTE genes for L1 sequence composition using human genomic data. In addition to the previously reported 3’ L1 sequences in POTEs [Citation10], we observed several additional L1 sequences in POTE gene regions (Supplemental Information). Moreover, POTE genes were significantly enriched in L1 sequences compared to nuclear genes (Table S1). To test whether POTE-associated L1 methylation correlates with POTE expression, we designed a pyrosequencing assay specific for the 3’ UTR L1 region of a sub-set of POTEs (G/H/M). This assay (i.e., POTE-L1) demonstrated hypomethylation in EOC compared to NO, and revealed a significant indirect correlation of POTE-L1 methylation and Pan-POTE expression in EOC ().
POTE expression and 5’ POTE hypomethylation in HGSC
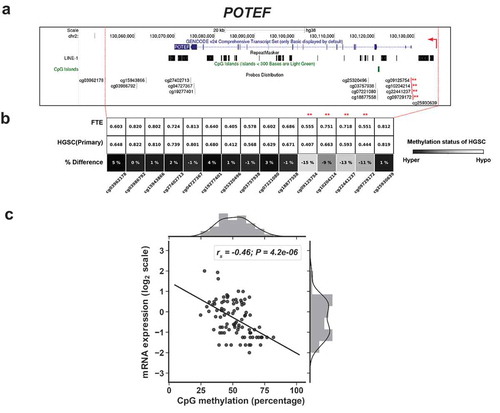
The high homology of POTE genes has hindered measurement of the expression of individual POTE genes [Citation9,Citation10]. However, RNA-seq can resolve individual POTEs [Citation36]. In addition, interrogation of the DNA methylation status of individual POTEs is possible using Illumina 450 K arrays (450 K) (Supplemental Information). We thus obtained matched RNA-seq and 450 K data from normal FTE, and primary and recurrent HGSC, to test the relationship between individual POTE gene expression and DNA methylation [Citation57]. Analyses of all relevant POTE data revealed that three POTEs (POTE C/E/F) are hypomethylated in HGSC compared to FTE, and show inversely correlated 5’ methylation and expression in HGSC (Figure S2; –). Information on the analyzed CpG sites is provided in Table S2. For POTEC & F, the hypomethylated sites lie in the promoter, while for POTEE the hypomethylated sites lie in a putative upstream enhancer. Interestingly, these CpG sites were located outside of L1 sequences and CpG islands (CGI) (–).
Figure 3. 5’ hypomethylation of POTEC in HGSC and correlation with gene expression. (a) UCSC Genome Browser data showing POTEC structure, LINE1 (L1) sequences, CpG islands (CGI), and Illumina 450K CpG sites. Asterisks indicate CpG sites with hypomethylation in HGSC and used for comparison with gene expression. Broken red arrow represents the direction of the transcript. (b) 450K methylation data for POTEC CpG sites in FTE (N = 6) and primary HGSC (N = 80). CpG sites selected for comparisons with gene expression indicated with asterisks. Shading indicates the extent of hypomethylation in HGSC (see key). (c) POTEC expression vs. 5’ methylation in HGSC (primary and recurrent), using the averaged methylation of the asterisked CpG sites shown in panels B and C. Spearman correlations and p-values are indicated (N = 89). mRNA expression values are FPKM normalized and log2 transformed.
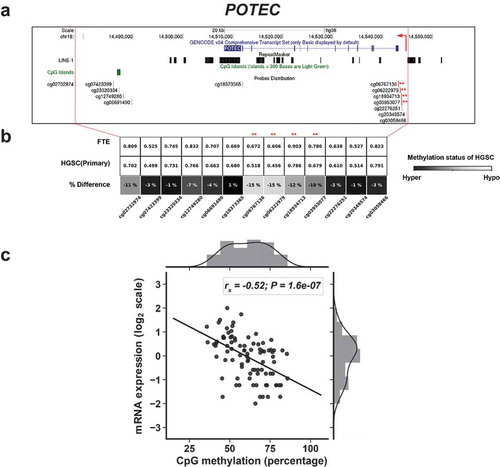
Figure 4. 5’ hypomethylation of POTEE in HGSC and correlation with gene expression. (a) UCSC Genome Browser data showing POTEE structure, LINE1 (L1) sequences, CpG islands (CGI), and Illumina 450K CpG sites. Asterisks indicate CpG sites with hypomethylation in HGSC and used for comparison with gene expression. Broken red arrow represents the direction of the transcript. (b) 450K methylation data for POTEE CpG sites in FTE (N = 6) and primary HGSC (N = 80). CpG sites selected for comparisons with gene expression indicated with asterisks. Shading indicates the extent of hypomethylation in HGSC (see key). (c) POTEE expression vs. 5’ methylation in HGSC (primary and recurrent), using the averaged methylation of the asterisked CpG sites shown in panels B and C. Spearman correlations and p-values are indicated (N = 88). mRNA expression values are FPKM normalized and log2 transformed.
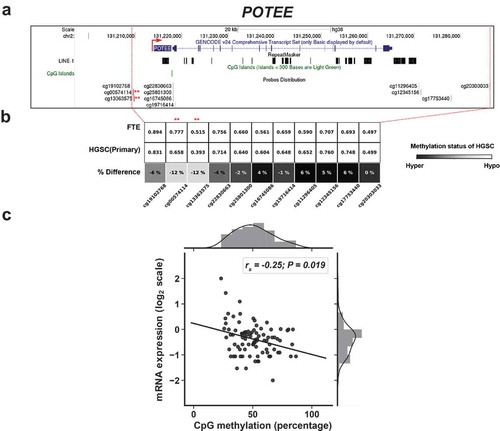
Figure 5. 5’ hypomethylation of POTEF in HGSC and correlation with gene expression. (a) UCSC Genome Browser data showing POTEF structure, LINE1 (L1) sequences, CpG islands (CGI), and Illumina 450K CpG sites. Asterisks indicate CpG sites with hypomethylation in HGSC and used for comparison with gene expression. Broken red arrow represents the direction of the transcript. (b) 450K methylation data for POTEF CpG sites in FTE (N = 6) and primary HGSC (N = 80). CpG sites selected for comparisons with gene expression indicated with asterisks. Shading indicates the extent of hypomethylation in HGSC (see key). (c) POTEF expression vs. 5’ methylation in HGSC (primary and recurrent), using the averaged methylation of the asterisked CpG sites shown in panels B and C. Spearman correlations and p-values are indicated (N = 90). mRNA expression values are FPKM normalized and log2 transformed.
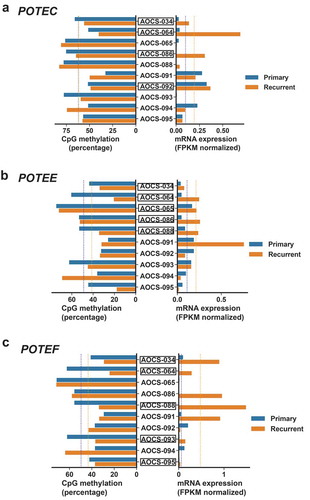
Acquired resistance to chemotherapy is a major clinical problem in HGSC, and current efforts focus on understanding the mechanisms of chemoresistance and identification of therapeutic targets in these patients [Citation58]. We recently reported that several POTEs, including POTEs C and F, are upregulated in recurrent HGSC [Citation36]. Here we analyzed POTE 5’ methylation and expression in 10 patient-matched pairs of primary and recurrent HGSC [Citation57], focusing on the POTE C/E/F CpG sites identified above (Table S2). Notably, several patients showed coordinate 5’ hypomethylation and increased expression of individual POTEs in recurrent HGSC (). In addition, select individual patients showed hypomethylation and increased expression of multiple POTEs (e.g., AOCS-34, AOCS-64).
Figure 6. POTEC/E/F gene expression and 5’ DNA methylation in primary vs. recurrent HGSC. A. POTEC mRNA expression and averaged CpG methylation, using the CpG sites shown in ), in patient-matched primary vs. recurrent HGSC. B. POTEE mRNA expression and averaged CpG methylation, using the CpG sites shown in ), in patient-matched primary vs. recurrent HGSC. C. POTEF mRNA expression and averaged CpG methylation, using the CpG sites shown in ), in patient-matched primary vs. recurrent HGSC. Patient IDs are shown. Boxed patient IDs indicate samples with evidence for coordinate 5’ hypomethylation and increased gene expression. Blue dotted lines indicate the group average for the 10 primary HGSC samples. Orange dotted lines indicate the group average for the 10 recurrent HGSC samples.
DNA methylation represses POTE gene expression
To test whether DNA methylation represses POTEs, we utilized the DNMTi decitabine (DAC), which reactivates the expression of methylation-silenced genes, including CTAs [Citation49,Citation59]. In a panel of EOC and related cell lines, DAC treatment increased Pan-POTE regardless of the baseline level of expression, although induction was less substantial in cells with higher baseline expression ()). To validate that DAC induction was not due to off-target effects, we measured Pan-POTE expression in cancer cells with DNA hypomethylation caused by DNMT knockout [Citation60,Citation61], and observed significant induction in DNMT1/3b double knockout cells ()). In addition, pyrosequencing confirmed that both DAC treatment and DNMT knockout caused POTE gene DNA hypomethylation (Figure S3). We then conducted an exploratory analysis of epigenetic drug combinations to determine their effect on Pan-POTE expression. We treated a model HGSC cell line, Kuramochi, [Citation62] with DAC, the pan-HDACi TSA, and three HMTi, including GSK343, which inhibits EZH2 (H3K27me) [Citation63], BIX-01294, which inhibits G9a (H3K9me1/2) [Citation64], and chaetocin, which inhibits SUV39H1 (H3K9me3) [Citation65]. While HDAC and HMTi treatments alone had a minor effect on Pan-POTE expression, combinations of these agents with DAC increased Pan-POTE expression beyond the effect of DAC alone ()). In particular, chaetocin, when combined with DAC, or DAC + TSA, led to the greatest induction of Pan-POTE.
Figure 7. DNA hypomethylation induces Pan-POTE expression. (a) Pan-POTE expression in a panel of ovarian cancer-related cell lines treated with 1µM DAC for 48 hours. (b) Pan-POTE expression in HCT116 colorectal cancer cells with DNMT gene knockout (genotype indicated). (c) Pan-POTE expression in Kuramochi cells treated with different combinations of epigenetic drugs for 72 hours. In all panels, data are plotted as mean + SD.
Discussion
Three genomic characteristics of POTE genes suggested they might be epigenetically regulated: 1) pericentromeric localization [Citation52,Citation66], 2) a conserved 3’ UTR L1 element [Citation10,Citation56], and 3) expression patterns (of some members) typical of CTA genes [Citation18,Citation36]. Our studies support that POTEs are epigenetically regulated. First, NBL2 expression correlated with POTE expression, which was not true for most non-pericentromeric CTAs, suggesting that POTE expression is promoted by epigenetic activation of pericentromeres. In agreement, NBL2 is resident at the pericentromeres of chromosomes 2, 13, 14, 15, and 22, which also contain POTEs [Citation53-Citation55,Citation67] (). Second, POTE genes were enriched for L1 sequences, and POTE expression correlated with hypomethylation of global L1 sequences and POTE-embedded L1 sequences. L1 hypomethylation may promote POTE expression by impacting the regional chromatin environment, although additional studies are needed to test this. Third, selected POTEs have DNA hypomethylation at 5’ promoter or enhancer regions that correlate with increased expression. Interestingly, the hypomethylated regions did not overlap L1s or CpG islands (CGI). Non-CGI 5’ methylation can regulate gene expression, consistent with our data [Citation68]. Thus, it appears that several different DNA methylation defects promote POTE family expression in EOC.
We used genetic and pharmacological approaches in EOC and related cell models to determine whether epigenetics functionally regulates POTE expression. Genetic knockout of DNMT1 and DNMT3b, which results in global hypomethylation in HCT116 cells, induced Pan-POTE expression. In agreement, DAC treatment induced Pan-POTE expression, while several other drugs that impact histone-modifying enzymes had a smaller effect, as single treatments. However, when used in combination with DAC, several drugs showed a significant augmenting effect. The HDACi TSA showed this effect, as observed previously for DNA methylation-regulated genes, including CTAs [Citation49,Citation59]. Notably, the SUV39H1 inhibitor chaetocin had a robust effect on Pan-POTE expression, when used in combination with DAC or DAC + TSA. As pericentromeric heterochromatin is repressed by DNA methylation and H3K9me3 [Citation52]; we speculate that the impact of chaetocin on POTE expression may reflect euchromatization of pericentromeric DNA. Consistently, we observed that chaetocin treatment activates NBL2 expression (data not shown). Interestingly, chaetocin also was recently shown to enhance CTA expression in dendritic cells [Citation69].
Although POTEs are overexpressed and epigenetically activated in EOC and HGSC, we do not yet know whether they play a functional role [Citation9,Citation36]. Mechanistically, recent data suggest that POTEs regulate cell survival [Citation70-Citation72]. In addition, POTE protein structure and cellular observations indicate a potential function in the cytoskeleton [Citation10,Citation15,Citation17]. Our preliminary data suggest that POTEs promote oncogenic phenotypes in ovarian cancer cells (Sharma et al., unpublished). An oncogenic function in HGSC appears consistent with the link between Pan-POTE expression and advanced disease, and the association of POTEE expression with reduced HGSC survival [Citation36]. In addition, several POTEs have increased expression in recurrent chemoresistant HGSC, which, in the case of POTEs C/E/F, is linked to 5’ hypomethylation. Also seemingly consistent with an oncogenic function for POTEs is our observation that several distinct cancer epigenetic alterations each promote POTE expression. Finally, recent data shows that other CTAs promote oncogenic phenotypes [Citation28,Citation31,Citation34,Citation35]. Future studies will examine the role of POTEs in EOC and other cancers, and their potential as therapeutic targets.
Materials and methods
Human EOC and normal ovary (NO) tissues
We obtained human primary EOC (n = 119) and NO (n = 17) (from patients without malignancy) using IRB-approved protocols at RPCCC, as described [Citation73] (Figure S4). We performed biochemical extractions as described [Citation46].
Cell culture
We have described all ovarian cancer and related cell lines used in this study elsewhere [Citation36,Citation74]. We obtained and cultured HCT116 and DNMT knockout cells as previously described [Citation60,Citation61].
Drug treatments
We treated a panel of cell lines with 1.0 µM decitabine (DAC; Sigma) and harvested RNA 48 hours post-treatment. For combination drug studies, we treated Kuramochi cells with 1.0 µM DAC for 48 hours, then added one or two additional drugs and continued the experiment for an additional 24 hours prior to RNA harvest. The additional drugs tested were: Trichostatin A (TSA; Sigma), GSK343 (Cayman Chemical), BIX-01294 (Sigma), and Chaetocin (Cayman Chemical). We treated cells with vehicle controls (PBS and/or DMSO) in parallel.
RT-qPCR
We extracted RNA using TRIzol (Invitrogen) and synthesized cDNA using iScript cDNA Synthesis Kit (BioRad). We sequenced RT-PCR products to confirm correct product amplification. We performed qPCR using the BioRad CFX Connect system, SYBR green master mix (Qiagen). We designed primers using Primer-Blast (NCBI) or Primer3, and we obtained primers from IDT. We amplified Pan-POTE as described [Citation15]. We amplified NBL2 as described [Citation67]. Primer sequences are shown in Table S3. We obtained tumor-matched expression data for other CTA genes (CTCFL, PRAME, MAGEA1, NY-ESO-1, CT45, XAGE1) from our previous studies [Citation8,Citation40,Citation41].
Affymetrix microarrays
We performed Affymetrix HG 1.0ST arrays at the University at Buffalo Center of Excellence in Bioinformatics and Life Sciences. We normalized microarray probe cell intensity data (.cel) using the Affymetrix Expression Console (version 1.3.0.187) software running the RMA workflow. To determine significantly expressed genes we used a regularized t test analysis of control versus treatment comparisons using a Bayesian approach that estimates the within-treatment variation among replicates, using Cyber-T software.
POTE genomic organization and detection of embedded L1 sequences
We used the human genome assembly (GRCh38.p12, Ensembl Archive Release 92) to map stretches of L1 repetitive sequences (RepeatMasker annotations; http://www.repeatmasker.org) within 10 K upstream and downstream of the 14 POTE genes (Supplementary Information). We used a Python extension of BEDTools to identify L1 repeats that overlapped with the -/+10 K region of the POTEs [Citation75,Citation76]. We visualized L1 sequences using the UCSC Genome Browser.
POTE methylation and expression comparisons in FTE and HGSC
We utilized publically available data from the Australian Ovarian Cancer Study (AOCS) [Citation57] (Figure S4). We retrieved Illumina Infinium (450 K) methylation data for normal FTE (n = 6) and HGSC samples (n = 90: 80 primary + 10 recurrent) from Gene Expression Omnibus (GEO) (GSE65820) [Citation57]. We integrated POTE expression and methylation from patient-matched primary and recurrent HGSC (n = 10). The CpG sites used for analysis are presented in Table S2. We obtained RNA-seq data from the European Genome-phenome Archive (EGA) (EGAD00001000877) [Citation57]. We downloaded and analyzed all data using Python. The python code is available at (https://goo.gl/R5w3bT).
Supplemental Material
Download Zip (606.5 KB)Acknowledgments
We thank Professors Nelly Auersperg, Francis Balkwill, Anirban Mitra, and Bert Vogelstein for generously providing cell lines, and other members of the Karpf Lab for helpful discussions and technical assistance. We thank the University of Buffalo Center of Excellence for microarray processing, and the UNMC DNA sequencing and Epigenomics Cores for sequencing and epigenomic analyses.
Disclosure statement
No potential conflict of interest was reported by the authors.
Supplementary material
Supplemental data for this article can be accessed here.
Additional information
Funding
Related Research Data
References
- Cancer Facts and Figures 2013. American Cancer Society 2013.
- Integrated genomic analyses of ovarian carcinoma. Nature. 2011;474:609–615.
- Ciriello G, Miller ML, Aksoy BA, et al. Emerging landscape of oncogenic signatures across human cancers. Nat Genet. 2013;45:1127–1133.
- Huang RL, Gu F, Kirma NB, et al. Comprehensive methylome analysis of ovarian tumors reveals hedgehog signaling pathway regulators as prognostic DNA methylation biomarkers. Epigenetics. 2013;8:624–634.
- Widschwendter M, Jiang G, Woods C, et al. DNA hypomethylation and ovarian cancer biology. Cancer Res. 2004;64:4472–4480.
- Nephew KP, Balch C, Zhang S, et al. Epigenetics and ovarian cancer. Cancer Treat Res. 2009;149:131–146.
- Woloszynska-Read A, Mhawech-Fauceglia P, Yu J, et al. Intertumor and intratumor NY-ESO-1 expression heterogeneity is associated with promoter-specific and global DNA methylation status in ovarian cancer. Clin Cancer Res off J Am Assoc Cancer Res. 2008;14:3283–3290.
- Woloszynska-Read A, Zhang W, Yu J, et al. Coordinated cancer germline antigen promoter and global DNA hypomethylation in ovarian cancer: association with the BORIS/CTCF expression ratio and advanced stage. Clin Cancer Res off J Am Assoc Cancer Res. 2011;17:2170–2180.
- Bera TK, Saint Fleur A, Lee Y, et al. POTE paralogs are induced and differentially expressed in many cancers. Cancer Res. 2006;66:52–56.
- Bera TK, Zimonjic DB, Popescu NC, et al. POTE, a highly homologous gene family located on numerous chromosomes and expressed in prostate, ovary, testis, placenta, and prostate cancer. Proc Natl Acad Sci U S A. 2002;99:16975–16980.
- Hahn Y, Bera TK, Pastan IH, et al. Duplication and extensive remodeling shaped POTE family genes encoding proteins containing ankyrin repeat and coiled coil domains. Gene. 2006;366:238–245.
- Bera TK, Saint Fleur A, Ha D, et al. Selective POTE paralogs on chromosome 2 are expressed in human embryonic stem cells. Stem Cells Dev. 2008;17:325–332.
- Noris P, Perrotta S, Seri M, et al. Mutations in ANKRD26 are responsible for a frequent form of inherited thrombocytopenia: analysis of 78 patients from 21 families. Blood. 2011;117:6673–6680.
- Pippucci T, Savoia A, Perrotta S, et al. Mutations in the 5’ UTR of ANKRD26, the ankirin repeat domain 26 gene, cause an autosomal-dominant form of inherited thrombocytopenia, THC2. Am J Hum Genet. 2011;88:115–120.
- Lee Y, Ise T, Ha D, et al. Evolution and expression of chimeric POTE-actin genes in the human genome. Proc Natl Acad Sci U S A. 2006;103:17885–17890.
- Bera TK, Huynh N, Maeda H, et al. Five POTE paralogs and their splice variants are expressed in human prostate and encode proteins of different lengths. Gene. 2004;337:45–53.
- Das S, Ise T, Nagata S, et al. Palmitoylation of POTE family proteins for plasma membrane targeting. Biochem Biophys Res Commun. 2007;363:751–756.
- Akers SN, Odunsi K, Karpf AR. Regulation of cancer germline antigen gene expression: implications for cancer immunotherapy. Future Oncol. 2010;6:717–732.
- Simpson AJ, Caballero OL, Jungbluth A, et al. Cancer/testis antigens, gametogenesis and cancer. Nat Rev Cancer. 2005;5:615–625.
- Coulie PG, Van Den Eynde BJ, van der Bruggen P, et al. Tumour antigens recognized by T lymphocytes: at the core of cancer immunotherapy. Nat Rev Cancer. 2014;14:135–146.
- Saghafinia S, Mina M, Riggi N, et al. Pan-cancer landscape of aberrant DNA methylation across human tumors. Cell Rep. 2018;25:1066–80 e8.
- Caballero OL, Cohen T, Gurung S, et al. Effects of CT-Xp gene knock down in melanoma cell lines. Oncotarget. 2013;4:531–541.
- Monte M, Simonatto M, Peche LY, et al. MAGE-A tumor antigens target p53 transactivation function through histone deacetylase recruitment and confer resistance to chemotherapeutic agents. Proc Natl Acad Sci U S A. 2006;103:11160–11165.
- Doyle JM, Gao J, Wang J, et al. MAGE-RING protein complexes comprise a family of E3 ubiquitin ligases. Mol Cell. 2010;39:963–974.
- Bai S, He B, Wilson EM. Melanoma antigen gene protein MAGE-11 regulates androgen receptor function by modulating the interdomain interaction. Mol Cell Biol. 2005;25:1238–1257.
- Shaw RJ. Tumor metabolism: MAGE-A proteins help TRIM turn over AMPK. Curr Biol. 2015;25:R418–R420.
- Pineda CT, Ramanathan S, Fon Tacer K, et al. Degradation of AMPK by a cancer-specific ubiquitin ligase. Cell. 2015;160:715–728.
- Whitehurst AW. Cause and consequence of cancer/testis antigen activation in cancer. Annu Rev Pharmacol Toxicol. 2014;54:251–272.
- Lee AK, Potts PR. A comprehensive guide to the MAGE family of ubiquitin ligases. J Mol Biol. 2017;429:1114–1142.
- Maine EA, Westcott JM, Prechtl AM, et al. The cancer-testis antigens SPANX-A/C/D and CTAG2 promote breast cancer invasion. Oncotarget. 2016;7:14708–14726.
- Maxfield KE, Taus PJ, Corcoran K, et al. Comprehensive functional characterization of cancer-testis antigens defines obligate participation in multiple hallmarks of cancer. Nat Commun. 2015;6:8840.
- Cappell KM, Sinnott R, Taus P, et al. Multiple cancer testis antigens function to support tumor cell mitotic fidelity. Mol Cell Biol. 2012;32:4131–4140.
- Whitehurst AW, Xie Y, Purinton SC, et al. Tumor antigen acrosin binding protein normalizes mitotic spindle function to promote cancer cell proliferation. Cancer Res. 2010;70:7652–7661.
- Gibbs ZA, Whitehurst AW. Emerging contributions of cancer/testis antigens to neoplastic behaviors. Trends Cancer. 2018;4:701–712.
- Van Tongelen A, Loriot A, De Smet C. Oncogenic roles of DNA hypomethylation through the activation of cancer-germline genes. Cancer Lett. 2017;396:130–137.
- Barger CJ, Zhang W, Sharma A, et al. Expression of the POTE gene family in human ovarian cancer. Sci Rep. 2018;8:17136.
- De Smet C, Loriot A. DNA hypomethylation and activation of germline-specific genes in cancer. Adv Exp Med Biol. 2013;754:149–166.
- De Smet C, Lurquin C, Lethe B, et al. DNA methylation is the primary silencing mechanism for a set of germ line- and tumor-specific genes with a CpG-rich promoter. Mol Cell Biol. 1999;19:7327–7335.
- De Smet C, De Backer O, Faraoni I, et al. The activation of human gene MAGE-1 in tumor cells is correlated with genome-wide demethylation. Proc Natl Acad Sci U S A. 1996;93:7149–7153.
- Zhang W, Barger CJ, Eng KH, et al. PRAME expression and promoter hypomethylation in epithelial ovarian cancer. Oncotarget. 2016;7:45352–45369.
- Zhang W, Barger CJ, Link PA, et al. DNA hypomethylation-mediated activation of Cancer/Testis Antigen 45 (CT45) genes is associated with disease progression and reduced survival in epithelial ovarian cancer. Epigenetics. 2015;10:736–748.
- James SR, Cedeno CD, Sharma A, et al. DNA methylation and nucleosome occupancy regulate the cancer germline antigen gene MAGEA11. Epigenetics. 2013;8:849–863.
- Link PA, Zhang W, Odunsi K, et al. BORIS/CTCFL mRNA isoform expression and epigenetic regulation in epithelial ovarian cancer. Cancer Immun. 2013;13:6.
- Ademuyiwa FO, Bshara W, Attwood K, et al. NY-ESO-1 cancer testis antigen demonstrates high immunogenicity in triple negative breast cancer. PLoS One. 2012;7:e38783.
- Karpf AR, Bai S, James SR, et al. Increased expression of androgen receptor coregulator MAGE-11 in prostate cancer by DNA hypomethylation and cyclic AMP. Mol Cancer Res. 2009;7:523–535.
- Woloszynska-Read A, James SR, Link PA, et al. DNA methylation-dependent regulation of BORIS/CTCFL expression in ovarian cancer. Cancer Immun. 2007;7:21.
- Link PA, Gangisetty O, James SR, et al. Distinct roles for histone methyltransferases G9a and GLP in cancer germ-line antigen gene regulation in human cancer cells and murine embryonic stem cells. Mol Cancer Res. 2009;7:851–862.
- Karpf AR. A potential role for epigenetic modulatory drugs in the enhancement of cancer/germ-line antigen vaccine efficacy. Epigenetics. 2006;1:116–120.
- James SR, Link PA, Karpf AR. Epigenetic regulation of X-linked cancer/germline antigen genes by DNMT1 and DNMT3b. Oncogene. 2006;25:6975–6985.
- Rao M, Chinnasamy N, Hong JA, et al. Inhibition of histone lysine methylation enhances cancer-testis antigen expression in lung cancer cells: implications for adoptive immunotherapy of cancer. Cancer Res. 2011;71:4192–4204.
- Wischnewski F, Pantel K, Schwarzenbach H. Promoter demethylation and histone acetylation mediate gene expression of MAGE-A1, -A2, -A3, and -A12 in human cancer cells. Mol Cancer Res. 2006;4:339–349.
- Dejardin J. Switching between Epigenetic States at Pericentromeric Heterochromatin. Trends Genet. 2015;31:661–672.
- Nishiyama R, Qi L, Tsumagari K, et al. A DNA repeat, NBL2, is hypermethylated in some cancers but hypomethylated in others. Cancer Biol Ther. 2005;4:440–448.
- Choi SH, Worswick S, Byun HM, et al. Changes in DNA methylation of tandem DNA repeats are different from interspersed repeats in cancer. Int J Cancer J Inter Du Cancer. 2009;125:723–729.
- Gadalla SM, Katki HA, Shebl FM, et al. The relationship between DNA methylation and telomere length in dyskeratosis congenita. Aging Cell. 2012;11:24–28.
- Yang AS, Estecio MR, Doshi K, et al. A simple method for estimating global DNA methylation using bisulfite PCR of repetitive DNA elements. Nucleic Acids Res. 2004;32:e38.
- Patch AM, Christie EL, Etemadmoghadam D, et al. Whole-genome characterization of chemoresistant ovarian cancer. Nature. 2015;521:489–494.
- Bowtell DD, Bohm S, Ahmed AA, et al. Rethinking ovarian cancer II: reducing mortality from high-grade serous ovarian cancer. Nat Rev Cancer. 2015;15:668–679.
- Cameron EE, Bachman KE, Myohanen S, et al. Synergy of demethylation and histone deacetylase inhibition in the re-expression of genes silenced in cancer. Nat Genet. 1999;21:103–107.
- Rhee I, Bachman KE, Park BH, et al. DNMT1 and DNMT3b cooperate to silence genes in human cancer cells. Nature. 2002;416:552–556.
- Song L, James SR, Kazim L, et al. Specific method for the determination of genomic DNA methylation by liquid chromatography-electrospray ionization tandem mass spectrometry. Anal Chem. 2005;77:504–510.
- Domcke S, Sinha R, Levine DA, et al. Evaluating cell lines as tumour models by comparison of genomic profiles. Nat Commun. 2013;4:2126.
- Verma SK, Tian X, LaFrance LV, et al. Identification of potent, selective, cell-active inhibitors of the histone lysine methyltransferase EZH2. ACS Med Chem Lett. 2012;3:1091–1096.
- Kubicek S, O’Sullivan RJ, August EM, et al. Reversal of H3K9me2 by a small-molecule inhibitor for the G9a histone methyltransferase. Mol Cell. 2007;25:473–481.
- Greiner D, Bonaldi T, Eskeland R, et al. Identification of a specific inhibitor of the histone methyltransferase SU(VAR)3-9. Nat Chem Biol. 2005;1:143–145.
- Wong NC, Wong LH, Quach JM, et al. Permissive transcriptional activity at the centromere through pockets of DNA hypomethylation. PLoS Genet. 2006;2:e17.
- Kondo T, Bobek MP, Kuick R, et al. Whole-genome methylation scan in ICF syndrome: hypomethylation of non-satellite DNA repeats D4Z4 and NBL2. Hum Mol Genet. 2000;9:597–604.
- Han H, Cortez CC, Yang X, et al. DNA methylation directly silences genes with non-CpG island promoters and establishes a nucleosome occupied promoter. Hum Mol Genet. 2011;20:4299–4310.
- Vo MC, Nguyen-Pham TN, Lee HJ, et al. Chaetocin enhances dendritic cell function via the induction of heat shock protein and cancer testis antigens in myeloma cells. Oncotarget. 2017;8:46047–46056.
- Redfield SM, Mao J, Zhu H, et al. The C-terminal common to group 3 POTES (CtG3P): a newly discovered nucleolar marker associated with malignant progression and metastasis. Am J Cancer Res. 2013;3:278–289.
- Liu XF, Bera TK, Liu LJ, et al. A primate-specific POTE-actin fusion protein plays a role in apoptosis. Apoptosis. 2009;14:1237–1244.
- Vekariya U, Rawat K, Saxena R, et al. Identification of MPhi specific POTEE expression: its role in mTORC2 activation via protein-protein interaction in TAMs. Cell Immunol. 2019;335:30–40.
- Akers SN, Moysich K, Zhang W, et al. LINE1 and Alu repetitive element DNA methylation in tumors and white blood cells from epithelial ovarian cancer patients. Gynecol Oncol. 2014;132:462–467.
- Barger CJ, Zhang W, Hillman J, et al. Genetic determinants of FOXM1 overexpression in epithelial ovarian cancer and functional contribution to cell cycle progression. Oncotarget. 2015;6:27613–27627.
- Dale RK, Pedersen BS, Quinlan AR. Pybedtools: a flexible Python library for manipulating genomic datasets and annotations. Bioinformatics. 2011;27:3423–3424.
- Quinlan AR, Hall IM. BEDTools: a flexible suite of utilities for comparing genomic features. Bioinformatics. 2010;26:841–842.