
 ?Mathematical formulae have been encoded as MathML and are displayed in this HTML version using MathJax in order to improve their display. Uncheck the box to turn MathJax off. This feature requires Javascript. Click on a formula to zoom.
ABSTRACT
Sperm DNA methylation is crucial for fertility and viability of offspring but epigenome evolution in mammals is largely understudied. By comparing sperm DNA methylomes and large-scale genome-wide association study (GWAS) signals between human and cattle, we aimed to examine the DNA methylome evolution and its associations with complex phenotypes in mammals. Our analysis revealed that genes with conserved non-methylated promoters (e.g., ANKS1A and WNT7A) among human and cattle were involved in common system and embryo development, and enriched for GWAS signals of body conformation traits in both species, while genes with conserved hypermethylated promoters (e.g., TCAP and CD80) were engaged in immune responses and highlighted by immune-related traits. On the other hand, genes with human-specific hypomethylated promoters (e.g., FOXP2 and HYDIN) were engaged in neuron system development and enriched for GWAS signals of brain-related traits, while genes with cattle-specific hypomethylated promoters (e.g., LDHB and DGAT2) mainly participated in lipid storage and metabolism. We validated our findings using sperm-retained nucleosome, preimplantation transcriptome, and adult tissue transcriptome data, as well as sequence evolutionary features, including motif binding sites, mutation rates, recombination rates and evolution signatures. In conclusion, our results demonstrate important roles of epigenome evolution in shaping the genetic architecture underlying complex phenotypes, hence enhance signal prioritization in GWAS and provide valuable information for human neurological disorders and livestock genetic improvement.
Introduction
Proper DNA methylation in sperm is essential for the embryogenesis and normal development through gene expression regulation [Citation1-Citation5]. Aberrant sperm DNA methylation is often associated with impaired male fertility status, embryo quality and offspring disorders susceptibility [Citation6-Citation9]. Compared to other epigenetic regulatory elements like histone modifications, DNA methylation is a more stable regulator of gene expression [Citation10], which controls a long-term transcriptional activity of corresponding genes [Citation11]. More importantly, although it undergoes nearly complete reprogramming in mammals during germ cell and preimplantation development, DNA methylome can be inherited over generations with a heritability of approximate 20% (i.e., transgenerational inheritance) [Citation10,Citation12-Citation15]. For instance, Wang et al., (2014) reported that the methylation levels of approximate 6.8% of GpG sits maintained stable across sperm and embryonic developmental stages in mouse, with the majority of which were either hypermethylated (> 80%) or hypomethylated (< 20%) [Citation13]. More recently, Li et al., (2018) confirmed that hypomethylated regions around gene promoters were highly preserve over developmental stages and across species, and were regulated by Ploycomb through ten-eleven translocation proteins [Citation16].
Furthermore, comparative analysis of sperm DNA methylation has been a promising way to determine genomic regions under epigenome evolution [Citation17-Citation19], which is partially responsible for environmental adaption [Citation20]. For instance, by comparing sperm methylation across seven mammalian species, Qu et al. (2018) have revealed that hypomethylated regions (HMRs) around promoters are under substantial evolutionary changes, and exhibit strong lineage-specific aspects [Citation18]. The DNA methylation also closely interplays with the underlying nucleotide sequence due to the increased transition rates of methylated CpG to TpG [Citation17,Citation20,Citation21], thereby influencing the evolution of genome and contributing to the fixation of beneficial environmental adaptations into genome [Citation22,Citation23]. Yi (2017) has reviewed that the spontaneous epimutations in the germline, which are caused by the environmental perturbation, may influence the sequence evolution due to their transgenerational inheritance model, and in turn the sequence evolution may affect methylome evolution through three ways, including mutation of CpG sites, biased gene conversion and transcription factor (TF) binding site turnover [Citation23].Together, we hypothesized that studying DNA methylome evolution in sperm could help explore the evolutionarily molecular mechanism underlying lineage-specific complex traits, thus contributing to a better understanding of environmental adaptation.
Cattle (Bos taurus) and human diverged from a common ancestor ~90 million years ago [Citation24], and cattle is a valuable source for understanding the biology and evolution of mammals with the large-scale and accurate phenotypes, which were computed based on millions of offspring. We have conducted genome-wide association study (GWAS) for 35 complex traits with the sample size of 27,214 U.S. Holstein bulls with high reliable phenotypes and imputed sequence variants (n = ~ 3 million), including body type, fertility and production traits (Jiang et al., 2018, submitted; https://www.biorxiv.org/content/early/2018/09/26/428227). We sequenced 10 Holstein cattle sperm using the whole-genome bisulfite sequencing (WGBS) technology, aiming to determine genomic regions under epigenetic evolution through comparing with the human data [Citation25]. We studied the associations of epigenetic evolution with complex phenotypes by integrating these epigenetic features with GWAS signals for 35 and 60 complex traits and diseases in cattle and human, respectively. We validated our findings through large-scale integration analyses of sperm-retained nucleosome, histone modifications, preimplantation transcriptome, tissue proteome data, and several sequence evolutionary features (e.g., motif binding sites, mutation rates, recombination rates and evolution signatures). Our study illustrated that the epigenome evolution contributes to the shape of the genetic architecture underlying complex traits and diseases.
Results
General characteristics of sperm methylation
Our WGBS data had an average mapping rate of 71.47% with an overall methylation level of approximate 75% for all CpG loci in the cattle genome (Supplementary Table S1). In general, we found the majority of genomic elements (e.g., genic regions and repeat elements like LINE and SINE) were highly methylated (> 80% on average) in the cattle sperm (Supplementary Fig. S1A), and similar patterns held in the human sperm methylation [Citation17,Citation25]. Of note were the methylation levels of promoters (i.e., ±1000bp of transcriptional start site – TSS) and CG islands (CGI), which followed a clear bimodal pattern (i.e., peaks at < 20% and >80%, respectively) with an overall average of less than 40% (Supplementary Fig. S1B). We further observed that the global methylation levels among all ten cattle samples were highly correlated (Pearson’s correlation r > 0.91) (Supplementary Fig. S1C), consistent in each genomic element, particularly in promoters, CGI, low complexity sequence and simple repeats (Supplementary Fig. S1D). This was in line with the human sperm methylation levels, which exhibited high between-individual correlations of 0.89, 0.94 and 0.78 for genome-wide, promoters and repeats, respectively [Citation17]. Our results demonstrated that the sperm DNA methylation is globally highly methylated and correlated among individuals.
Sperm HMRs were enriched for GWAS signals of developmental traits
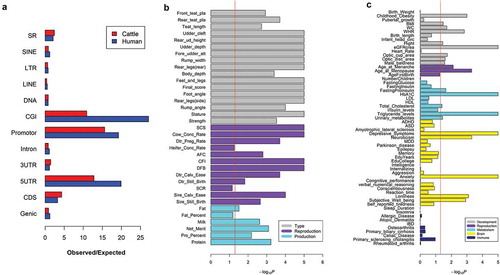
Because of the well-known roles of HMRs in the gene activation and regulation [Citation26,Citation27], we subsequently explored the sperm HMRs in both human and cattle, which may contribute to multiple biological processes in the embryonic development and organ morphogenesis, hence potentially influencing a range of complex phenotypes. In total, we detected 72,618 (covering ~0.79% of cattle genome) and 138,329 (covering ~2.5% of human genome) HMRs in cattle and human, respectively. The HMRs overlapped with all genomic elements, but highly intersected promoters and CGI, which were consistent in cattle and human (Figure 1(a)). We found that cattle sperm HMRs were significantly (P < 0.05; genome-wide marker-set test) enriched for GWAS signals of 32 out of the 35 complex traits in cattle. Of special note were the enrichments (i.e., -log10P) of body type and reproduction traits, which were significantly (P < 0.05; Wilcoxon-test) higher than those of milk production traits ()). We confirmed that human sperm HMRs were also significantly enriched for GWAS signals across many complex traits, including 9 out of 14 body developmental traits, 2 out of 4 reproductive traits, 5 out of 10 metabolic traits, and 5 out of 24 brain-related traits, but none out of 8 immune-related traits ()). Our results demonstrated that sperm HMRs were likely to harbor regulatory causative mutations across many complex traits, particularly in developmental traits (e.g., human height and cattle stature), which strongly supported their crucial roles in the normal development.
Figure 1. The enrichment of sperm hypomethylated regions (HMRs) for genomic elements and GWAS signals. (a) The enrichment of HMRs across genomic elements. (b) The GWAS signal enrichment of cattle sperm HMRs for 35 complex traits in dairy cattle. (c) The GWAS signal enrichment of human sperm HMRs for 60 complex traits in human. The red line corresponds to P = 0.05 on the basis of genome-wide marker-set test.
Sperm methylation evolution of orthologous genes in mammals
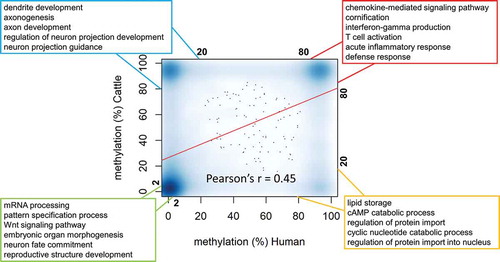
Since promoters were believed to mediate gene expression via methylation levels and to guide evolution across millions of years [Citation28,Citation29], we investigated the conservation and divergence of methylation in promoters of 14,459 orthologous gene-pairs between human and cattle. Consistent with that cattle and human shared ~80% sequence homology [Citation24,Citation30], we found methylation levels of promoters in orthologous genes were also correlated (Pearson’s r = 0.45) (Figure 2), implying that a decent fraction of epigenome remained conserved across millions of years of evolution in mammals. To confirm this, we further examined the mouse sperm methylome [Citation31], and found that correlations of promoters of orthologous genes were 0.53 (n = 14,392) and 0.44 (n = 14,459) for human vs. mouse and cattle vs. mouse, respectively (Supplementary Fig. S2). Bases on the bimodal distribution of promoter methylation (Fig. S1B), we here identified four categories of genes based on their promoter’s methylation levels in human and cattle (): (1) 2,761 genes with non-methylated (< 2%) promoters in both species (nMeth-genes); (2) 1,904 genes with hypermethylated (> 80%) promoters in both species (hyper-genes); (3) 2,228 genes with hypermethylated promoters in cattle but hypomethylated (< 20%) promoters in human (CRHO); (4) 410 genes with hypomethylated promoters in cattle but hypermethylated promoters in human (COHR). Function annotation using the Gene Ontology (GO) database for both cattle and human revealed their distinct biological functions of evolutionary significance: nMeth-genes (e.g., ANKS1A and WNT7A) significantly (Bonferroni-adjusted P < 0.01) participated in biological processes of embryonic developmental importance, such as primarily mRNA processing, WNT signaling pathway and embryonic development; hyper-genes (e.g., TCAP and CD80) played significant roles in the immune system, such as T cell activation and lymphocyte proliferation; CRHO genes (e.g., FOXP2 and HYDIN) mainly functioned in neurodevelopment, such as axon and dendrite development; while COHR genes (e.g.,LDHB and DGAT2) participated in lipid storage and metabolism (; details for all significant GO terms see Supplementary Table S2). Additionally, as expected we confirmed that promoters of nMeth-genes and hyper-genes consistently exhibited hypomethylation and hypermethylation in the mouse sperm, respectively, revealing their conservation in methylation across mammals. On the other hand, CRHO and COHR showed no difference in methylation in the mouse sperm, probably because they were human and cattle-specific hypomethylated genes, respectively. Of interest, the methylation levels of promoters of both CRHO and COHR tended to be lower than those of the remaining genes in the mouse sperm, indicating their particular functions in the mouse require further investigations (Supplementary Fig. S3).
Figure 2. The relationship of methylation in promoters of 14,459 orthologous gene-pairs between human and cattle. The promoters of genes were defined as 1000bp up and down-stream transcriptional start sites (TSS). The biological processes terms in each box were the top significantly (adjusted-p value < 0.05) enriched representative terms for the corresponding gene lists using Gene Ontology database (details in Table S2). The green box was for 2,761 genes with non-methylated (< 2%) promoters in both species (nMeth-genes); The red box was for 1,904 genes with hypermethylated (> 80%) promoters in both species (hyper-genes); The blue box was for 2,228 genes with hypermethylated promoters in cattle but hypomethylated (< 20%) promoters in human (CRHO); The orange box was for 410 genes with hypomethylated promoters in cattle but hypermethylated promoters in human (COHR).
Genes with conserved none and highly methylated promoters
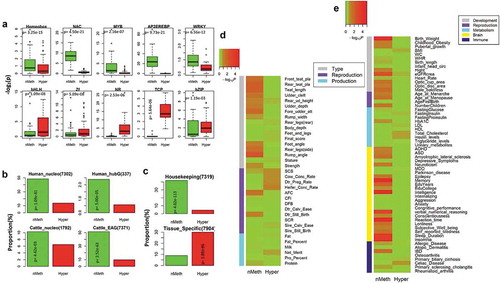
Our motif analyses revealed that promoters of nMeth-genes were significantly (FDR < 0.01) enriched for 99 and 86 out of all 921 tested motifs in human and cattle, respectively, while promoters of hyper-genes were significantly enriched for only 7 motifs in human and cattle (Supplementary Table S3). These results illustrated that promoters of nMeth-genes were hotspots of transcription factors, suggesting that developmental genes required a complex regulatory mechanism that involved a large amount of regulatory elements and factors to ensure their proper functions. We then grouped all the tested motifs based on their DNA binding domains, and observed that promoters of nMeth-genes had a significantly higher enrichment than those of hyper-genes across many embryonic developmental motifs, including Homeobox, NAC, MYB, AP2EREBP and WRKY motif families. In contrast, promoters of hyper-genes prefer to enrich for motifs associated with immunity and metabolism, including bHLH, zf, NR, TCP and bZIP motif families (Figure 3(a)). To further support that nMeth-genes not hyper-genes function at the early stages of embryonic development in mammals, we examined datasets of sperm-retained nucleosomes and embryonic activation transcriptomes in both human and cattle [Citation32–Citation36], which corresponded to transcriptionally active genes before implantation. We confirmed that nMeth-genes not hyper-genes were significantly (P < 0.01; Fisher exact test) overlapped with nucleosome-associated genes (i.e., genes in the closest vicinity to nucleosome peaks) and embryonic activated genes, which was consistent in human and cattle ()). In addition, nMeth-genes also significantly intersected genes that were associated with the attendant histone modifications (i.e., H3K4me2 and H3K27me3) in human sperm (Supplementary Fig. S4) [Citation32], which were believed to be markedly enriched at loci of early embryonic developmental importance [Citation32,Citation37]. We further revealed that nMeth-genes were house-keeping genes, while hyper-genes were tissue-specific genes through examining the dataset of human protein atlas that measured the gene expression levels in all major tissues and organs in the human body [Citation38] ()). Our genic marker-set test analyses demonstrated that nMeth-genes were significantly (P < 0.05) enriched for GWAS signals in body type traits in cattle, while hyper-genes were significantly and selectively enriched for several immune-related traits in cattle, including somatic cell sore (SCS), cow conception rate, daughter pregnancy rate and heifer conception rate [Citation39,Citation40] ()). Similar patterns held in human, as nMeth-genes were significantly enriched for many body developmental and brain-related traits, while hyper-genes were more likely to be associated with metabolism and immune-related traits ()). Together, all these observations indicated that non-methylated active promoters in sperm were essential for maintaining the plasticity of developmental genes to guide the embryonic development, while hyper-methylated inactive promoters in sperm might be important for silencing immune genes to ensure the successful implantation [Citation41].
Figure 3. Comparison of genes with conserved non-methylated (< 2%) promoters (nMeth-genes) and genes with conserved hypermethylated (> 80%) promoters (hyper-genes) in human and cattle. (a) Difference in motif enrichment between nMeth-genes and hyper-genes in human, similar results held in cattle (Table S5). (b) Overlaps of nMeth-genes and hyper-genes with genes associated with sperm-retained nucleosome and genes activated preimplantation in human and cattle, and P values calculated by Fisher exact test. hubG is the hub genes that were activated preimplantation, while EAG was the embryonic activated genes preimplantation. (c) Overlaps of nMeth-genes and hyper-genes with house-keeping and tissue-specific expressed genes, and P values calculated by Fisher exact test. (d) GWAS signal enrichment of nMeth-genes and hyper-genes for 35 complex traits in cattle, and P values were obtained by genic marker-set test. (e) GWAS signal enrichment of nMeth-genes and hyper-genes for 60 complex traits in human, and P values were obtained by genic marker-set test.
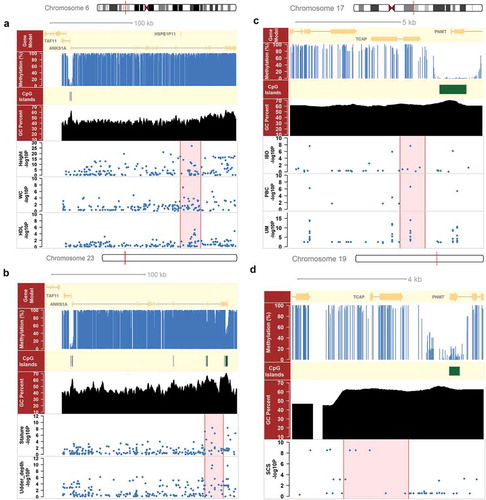
We defined a gene, whose promoter and genic regions bear suggestive significant SNPs (P < 1e-5) for at least two complex traits, as a pleiotropic gene. We observed 175 out of 960 and 317 out of 2,261 pleiotropic genes were nMeth-genes in cattle and human, respectively, as more often than expected (P = 8.24e-5 in cattle; P = 3.65e-3 in human; Fisher exact test). This indicated that nMeth-genes were likely to be pleiotropic genes, thereby influencing multiple complex traits and diseases. We found 30 nMeth-genes were common pleiotropic genes shared in both human and cattle, and many of those were associated with similar traits between human and cattle (). For example, ANKS1A gene, which is a well-known epidermal growth factor receptor [Citation42], had non-methylated promoters in both human and cattle. It was associated with multiple body developmental traits in both human and cattle (Figure 4(a)). In contrast, we found two hyper-genes, CCRL2 and TCAP, were associated with immune-related traits in both cattle and human. CCRL2, a chemokine receptor, was associated with SCS (chr22:53567811; P = 8.90e-06) in cattle, and with rheumatoid arthritis (rs6762266; P = 4.30e-06) in human. Here we showed TCAP as an example in ), which was engaged in many immune pathways [Citation43]. TCAP was associated with SCS in cattle, and with primary biliary cirrhosis, inflammatory bowel disease, urinary metabolites, rheumatoid arthritis, and allergic disease in human.
Table 1. The summary for 30 pleiotropic genes (harboring SNP with P < 1e-05 for at least two traits) with non-methylated promoters (nMeth-genes) in both human and cattle.
Figure 4. Comparison of ANKS1A and TCAP genes between human and cattle. (a) ANKS1A had a non-methylated promoter with a CpG island (CGI) on chromosome 6 in human, and bore suggestive significant SNPs (P < 1e-5) for three human complex traits, including height, waist circumference (WC) and high-density lipoprotein (HDL). (b) ANKS1A had a non-methylated promoter with a CGI on chromosome 23 in cattle, and bore suggestive significant SNPs for two cattle complex traits, i.e., stature and udder depth. (c) TCAP had a hypermethylated promoter without any CGI on chromosome 17 in human, and bore suggestive significant SNPs for three immune-related traits, including inflammatory bowel disease (IBD), primary biliary cirrhosis (PBC) and urinary metabolites (UM). (d) TCAP had a hypermethylated promoter without CGI on chromosome 19 in cattle, and bore suggestive significant SNPs for somatic cell sore (SCS) in cattle.
Genes with cattle and human-specific low methylated promoters
Our motif analyses showed that promoters of CRHO were significantly enriched for 27 motifs in human, including many developmental motifs belonging to AP2EREBP and MYB families, but they were significantly enriched for only 7 motifs in cattle, with the majority of those belonged to the bHLH family (Supplementary Table S3). In contrast, promoters of COHR were significantly enriched for two metabolism-related motifs, LXRE and MEF2C, in human, but for two developmental motifs, ERF115 and CRF10, in cattle (Supplementary Table S3), suggesting these genes may start to function at the early embryonic development exclusively in cattle. Genic marker-set test analysis revealed CRHO had a significantly higher enrichment (i.e., -log10P) than COHR for brain-related traits in human, while COHR had a significantly higher enrichment than CRHO for milk production traits in cattle ().
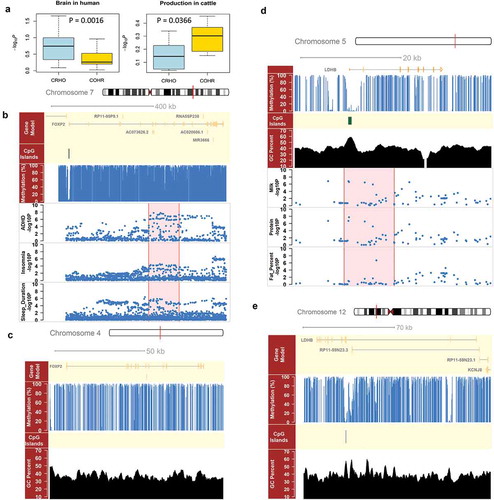
We detected 914 brain-associated genes, whose genic and promoter regions harbor suggestive significant SNPs of brain-related traits, among those 196 were CRHO genes, as more often than expected (P = 1.63e-22; Fisher exact test) (Supplementary Table S4). This also indicated that CRHO genes were associated with brain-related traits. For example, FOXP2, a well-known language and speech related gene [Citation44], had a hypomethylated promoter with a CGI in human, but a hypermethylated promoter without any CGI in cattle (,)). It was associated with four brain-related traits in human, including attention deficit hyperactivity disorder, insomnia, sleep duration, and verbal numerical reasoning ()). Similarly, we detected 517 production-associated genes in cattle, among which 17 were COHR genes (P = 6.65e-02; Fisher exact test) (Supplementary Table S5). For example, LDHB, which was significantly up-regulated during lactation in dairy cows [Citation45], had a hypomethylated promoter with a CGI in cattle, but a hypermthylated promoter without any CGI in human (,)). It was associated with three milk production traits in cattle, including milk yield, protein yield and fat percentage ()). All the results here demonstrated that comparative epigenome analyses could contribute to the detection of causative genes for lineage-specific traits, thereby providing novel insights into the genetic and evolutionary mechanisms underlying, which is partially related to environmental adaption.
Figure 5. GWAS single enrichment of species-specific genes and comparison of FOXP2 and LDHB between human and cattle. (a) Comparison of GWAS single enrichment for species-specific genes in species-specific traits, i.e., brain-related traits in human and milk production traits in cattle. CRHO were genes with hypermethylated promoters in cattle but hypomethylated ones in human, whereas COHR were genes with hypomethylated promoters in cattle but hypermethylated ones in human. (b) FOXP2 had a non-methylated promoter with a CpG island (CGI) on chromosome 7 in human, and bore suggestive significant SNPs (P < 1e-5) for three brain-related traits, including sleep duration, insomnia and attention deficit hyperactivity disorder (ADHD). (c) FOXP2 had a hypermethylated promoter without any CGI on chromosome 4 in cattle. (d) LDHB had a non-methylated promoter with a CGI on chromosome 5 in cattle, and bore suggestive significant SNPs (P < 1e-5) for three cattle production traits, including milk yield, protein yield and fat percentage. (e) LDHB had a hypermethylated promoter without any CGI on chromosome 12 in human.
Sequence evolution accompanying sperm methylation evolution
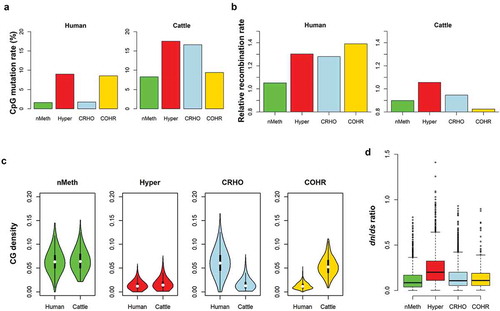
Since methylcytosines were hotspots of mutations that were the ultimate source of natural selection and evolution [Citation46–Citation48], we explored the associations of sequence evolution with sperm methylation evolution. We first estimated the SNP density of C/A, C/G, and C/T over all the CpG sits, which represented CpG mutation rates in the recent populations [Citation49]. As expected we found that promoters of nMeth-genes had much lower mutation rates than those of hyper-genes, consistent in human and cattle. Whereas, compared to COHR, promoters of CRHO had lower mutation rates in human, but higher in cattle (Figure 6(a)). We then examined recombination maps of human [Citation50] and cattle [Citation51], where we used the recombination rate of the SNP that was within or in closest proximity to a promoter to represent the corresponding gene. Consistent with mutation rates, we found that nMeth-genes had lower recombination rates in average than hyper-genes in both human and cattle, while species-specific genes exhibited opposite trends between human and cattle ()). We further observed that non-methylated promoters had higher CpG densities than hypermethylated ones, and conserved promoters had similar CpG densities between human and cattle, whereas species-specific promoters had significantly diverged CpG densities between human and cattle ()). All these implied that species-specific promoters experienced distinct CpG depletion pressures after the divergence of human and cattle. Furthermore, we demonstrated that protein-coding regions of those four gene-sets experienced distinct selective constraints through examining the paired dn/ds ratio between human and cattle within the last ~90 million years. The nMeth-genes had the lowest dn/ds values, suggesting that they were under strong purifying selection, while hyper-genes had the highest dn/ds values, indicating that they evolved fast. On the other hand, species-specific genes methylation exhibited intermediate dn/ds values ()). All these evidences here implied that genome and epigenome, particularly in genic and promoter regions, evolved together to affect complex phenotypes in mammals.
Figure 6. Sequence evolutionary features accompany the sperm methylome. (a) Comparison of CpG mutation rates in promoters of the four gene-sets in human and cattle. nMeth represented genes with conserved non-methylated promoters in both species; hyper represented genes with conserved hypermethylated promoters in both species; CRHO were genes with hypermethylated promoters in cattle but hypomethylated ones in human; whereas COHR were genes with hypomethylated promoters in cattle but hypermethylated ones in human. (b) Comparison of recombination rates. We used the recombination rate of the SNP that was within or in closest proximity to a promoter to represent the corresponding gene. The relative recombination rate was calculated as the proportion of the average recombination rate of a gene-set over the average genome-wide recombination rate. (c) Comparison of CG density. (d) Comparison of dn/ds ratios in protein coding regions.
Discussion
To our knowledge, this study for the first time investigated the associations of epigenetic evolution with complex phenotypes in mammals with such large-scale GWAS results of cattle and human. We revealed multiple epigenetic features of biological and evolutionary importance in sperm, with apparent evolutionary impacts in the underlying DNA sequence, which were enriched for GWAS signals of complex traits and diseases. Our findings also, for the first time, showed that genes/genome regions under epigenome evolution in sperm were associated with lineage-specific phenotypic variation, potentially contributing to the environmental adaptation. For instance, genes with human-specific hypomethylated promoters were associated with neuro-system development and brain-related diseases in human, whereas genes with cattle-specific hypomethylated promoters were relevant with lipid and protein metabolism. The results here provided new biological and evolutionary insights into the genetic mechanism underlying complex traits and diseases in mammals.
We found that genes with conserved non-methylated promoters in sperm highly intersected the sperm-retained nucleosomes, histones and preimplantation activated genes, as well significantly enriched for GWAS signals of body conformation traits in both human and cattle. This was consistent with previous findings that the nucleosome and histones retained in sperm were enriched at developmental genes, whose promoters were generally hypomethylated in sperm, such as microRNA clusters and HOX gene clusters [Citation32], although the majority of nucleosomes are replaced by protamine during sperm maturing in human. Jiang et al. (2013) pinpointed that DNA methylation in sperm not oocyte was inherited by embryos in Zebrafish [Citation52], and Wang et al., (2014) also reported that the methylation levels of a fraction (~6.8%) of GpG sits in mouse sperm retained across embryonic developmental stages [Citation13]. Additionally, our findings showed that sperm HMRs were significantly enriched for GWAS signals of multiple brain-related traits in human, such as neuroticism and depressive symptoms. This was consistent with previous reports that sperm DNA methylation alterations in older fathers might contribute to the increased incidence of neuropsychiatric and other diseases in their offspring [Citation6,Citation8]. Together, the sperm DNA methylome not only facilitates mature gamete function, but also guides the early embryogenesis and influences the later life [Citation6,Citation8,Citation32,Citation53,Citation54].
Sperm DNA methylome affects the evolution of mammalian genomes [Citation18]. Our results showed that genes with conserved hypermethylated promoters in sperm had higher mutation and recombination rates, and higher dn/ds ratios but lower CpG density than genes with conserved hypomethylated promoters, consistent with previous findings that the transition rates of methylated CpG to TpG mutation rates was ~10 fold higher than other dinucleotides [Citation48]. We also demonstrated that species-specific hypomethylated genes had higher CpG densities than their orthologous genes in other species, which was in agreement with a previous study that proposed even small differences in methylation may result in substantial loss of CpGs over a relatively short evolutionary period (i.e., divergence time between chimpanzee and human) [Citation17]. One central evolutionary regime proposed that the CpG richness is driven by the low DNA methylation and consequentially by the low CpG deamination rates [Citation55]. Together, it generally agrees with the hypothesis that the high-CG density in the genome may arise as the result of protection from methylation-induced mutations over long evolutionary periods. We currently observed that genes with hypomethylated promoters in sperm exhibited low recombination rates, which was in line with a previous observation that early developmental genes tended to have low recombination rates in their regulatory domains [Citation56]. Additionally, we found that protein coding regions of nMeth-genes (i.e., essential genes) had much lower dn/ds values than that of hyper-genes, consistent with previous evidence that essential genes whose mutations were under strong purifying selection and thereby evolved slowly, whereas non-essential genes were under relaxed purifying selection, and thus evolved faster [Citation57,Citation58]. These are all in line with the history records that both human and cattle experienced many infectious diseases, and thus the immune genes of cattle and human might be evolved fast to deal with the fast evolution of pathogens [Citation59].
Furthermore, our current study showed that promoters with species-specific methylation were enriched for different types of TF binding motifs, consistent with that evolutionary alterations in TF binding motifs could influence the shaping of methylome among species [Citation20]. Previous comparisons of sperm methylome between human and chimpanzee revealed that genes associated with human-specific HMRs were selectively and functionally related to neuronal functions [Citation17]. This is in line with our findings that genes with species-specific hypomethylated promoters between human and cattle are enriched for GWAS signals of species-specific traits. It is intriguing to hypothesize that alterations in the epigenetic state or genome regulatory state may allow phenotypic flexibility in a short run along one lineage, and the selective pressure in genome then drives the subsequent sequence changes in a long run if a trait shows advantages in adaptation [Citation17]. A current study also supported this by suggesting that during the evolution of heteromorphic chromosomes in the white-throated sparrow, the rapid and substantial regulatory evolution (i.e., transcriptome evolution) prevails before the large-scale genetic degeneration [Citation60]. Of note, in the current paper we have focused on the promoters of genes, as the intergenic regulatory elements (e.g., enhancers) were not available in cattle yet. Also the intergenic regulatory elements are less conserved than promoters. It would be of interest to investigate the epigenetic evolution in the intergenic regulatory regions when more functional genomic data available in cattle, such as histone modification and chromatin interaction data.
Materials and methods
Sperm collection and sequence library preparation
No animal experiments were performed in this study, and ethics committee approval was therefore not required. References are provided where animal data were used.
We sampled 10 semen straws from 8 fertile, health and representative U.S. Holstein bulls. These semen samples were collected from bulls by an artificial insemination company using a standardized procedure with artificial vaginas. Each ejaculate normally had 4–5 billion sperm cells with a high mobility in a volume of 5 ml. The ejaculate was then diluted with a medium (extender), which included yolk from hens’ eggs or heat-treated whole milk and glycerol. The distributed semen units/straws (0.5 ml, typically containing 10 to 40 million each), were transported and stored in liquid nitrogen tanks. After thawing and washing away the extender, we did visual examination of selected sperm samples under a microscope and found somatic cells usually were less than 1% and over 90% of sperm cells are morphologically normal. We isolated genomic DNA using QIAamp DNA Mini Kit protocol (QIAGEN, Valencia, CA, USA), and evaluated the quality of isolated DNA using the 2100 Bioanalyzer (Agilent Technologies, Santa Clara, CA, USA). We constructed the libraries using qualified genomic DNA as described previously in details [Citation36], then sequenced using HiSeq X Ten (Illumina, San Diego, CA, USA) with a 150bp paired-end technology. Details of the sample collection and WGBS procedure for human and mouse sperm methylome data can be found in [Citation25] and in [Citation31], respectively. We reanalyzed human and mouse sperm methylomes data using the same following procedure as cattle sperm methylomes.
Raw data profiling and methylation calling
We employed FastQC v 0.11.2 (https://www.bioinformatics.babraham.ac.uk/projects/fastqc/) and Trim Galore v 0.4.0 (https://www.bioinformatics.babraham.ac.uk/projects/trim_galore/) to check the sequence data quality and to clean the data, respectively [Citation36]. Generally, the adapters were removed, and the reads with low quality (Q < 20) and shorter than 20 bp were filtered. We aligned the cleaned data to the reference genome UMD 3.1 for cattle sperm data, hg19 for human, and mm10 for mouse, respectively, using bowtie2 [Citation61]. We then applied Bismark software to extract methylcytosine information [Citation62]. All the details have been described previously [Citation36]. The promoter regions were defined as the 1000bp down and up-stream of transcriptional start sits (TSS) in the current study.
Hypomethylated region (HMR) detection
We used a strictly method to detect the HMR as described previously [Citation36]. Briefly, we scanned the whole genome using a sliding window approach with a window-length of 200bp and a step-size of 50bp. Bases on the binomial distributions of methylation across the genomic features (Fig. S1B), we considered a contiguous region with no less than 80% hypomethylated CpGs (i.e., the average regional methylation ≤ 20%) as a HMR. We first detected HMRs in each individual separately, then intersected HMRs among individuals within each species to obtain the common HMRs with high confidence. We only kept the common HMRs with at least five CpG sites with each CpG site was covered by more than five reads for the downstream analyses [Citation36].
GWAS summary statistics
Details of the GWAS analysis in the cattle were described previously [Citation63]. In brief, a linear mixed model, implemented in MMAP (https://mmap.github.io/), was employed to conduct single-marker GWAS analysis for 35 complex traits of 27,214 Holstein bulls using imputed sequence variants (~ 3 million SNPs). The model measured additive effects of genotypes while accounting for the population structure with a genomic relationship matrix. The phenotypes currently analyzed were de-regressed breeding values that have been accounted for all known systematic effects. We classified the cattle complex traits into three phenotypic categories, including 17 body type, 12 reproduction and 6 production traits. For human GWAS data, we obtained the summary statistics for 60 complex traits with an average sample size of 128,848 and an average SNP number of 5,905,874. We classified the 60 complex traits into five phenotype categories [Citation64,Citation65], including 14, 4, 10, 24 and 8 body development, reproduction, metabolism, brain-related and immune-related traits, respectively. Details of human GWAS studies are summarized in Supplementary Table S6.
GWAS signal enrichment analysis based on detected epigenetic features
Since the complex phenotypes being studied are highly polygenic or even omnigenic [Citation66], we employed the following sum-based marker-set test approach to examine the enrichment of GWAS signals in a given genomic features (e.g., a list of HMRs or genes). Previous studies demonstrated that this approach had higher power or at least equal to many commonly used marker-set test methods (e.g., count-based, score-based and coviance-based) in human [Citation67], Drosophila melanogaster [Citation68] and livestocks [Citation69-Citation71], particularly in the highly polygenic traits.
In which is the number of markers within a genomic feature, and
is the square of t that was computed as the marker effect (b) divided by the corresponding standard error. Here SNPs within different elements (e.g., genes) of a genomic feature were often not in linkage disequilibrium (LD), as they may scattered distantly or even on different chromosomes. This method is similar to the popular linkage disequilibrium (LD) score regression [Citation72], it analysed the genome-wide polygenic signals rather than a subset of SNPs that pass a certain significance threshold. It controlled LD patterns among SNPs and SNP-set sizes through applying the following cyclical permutation strategy, as described previously [Citation67,Citation68]. Briefly, we first ordered the test statistics (i.e.,
) for all markers on the basis of their physical positions (i.e.,
,
, ⋯
,
). We then randomly chose one test statistic (i.e.,
) from this vector as the first, and shifted the remaining test statistics to new locations, while maintained their original orders (i.e.,
,
,⋯
,
,⋯
). Thus, we uncoupled associations of SNPs with a genomic feature while retaining the correlation patterns among test statistics of SNPs. We computed a new summary statistic for the genomic feature being analysed on the basis of its original chromosome position. We repeated the permutation procedure 10,000 times for each genomic feature, and obtained an empirical P-value using one-tailed tests of the proportion of random summary statistics greater than that observed. We applied two types of marker-set test approaches in the current study based on different null hypotheses: 1) genome-wide marker-set test aimed to compare the makers within a genomic feature to random markers that were drawn from the whole genome (i.e., genic and intergenic regions), 2) genic marker-set test aimed to compare markers within a gene-set to random markers that were drawn from exclusively genic regions. The current marker-set test method together with multiple quantitative genomic tools were implemented in the QGG package (http://psoerensen.github.io/qgg/).
Features of genome evolution
We computed the SNP density of C/A, C/G, and C/T over all the CpG sits to represent CpG mutation rates in the recent populations [Citation21,Citation49]. We examined recombination maps of human [Citation50] and cattle [Citation51], where we used the recombination rate of the SNP that was within or in closest proximity to a promoter to represent the corresponding gene. We computed the relative recombination rates as the average recombination rate of a target gene-set divided by the overall average recombination rate of the genome.
Gene-set functional annotation and motif enrichment analysis
We conducted the functional enrichment analysis for gene lists using R package clusterProfiler [Citation73], where a hypergeometric test, based on the current GO database, was employed. We applied HOMER (http://homer.ucsd.edu/homer/motif/) to conduct the motif enrichment analysis for promoters of interest considering all the promoters in the genome as background. We adjusted P-values for multiple testing using the FDR method [Citation74].
Data availability
All the cattle sperm methylomes have been submitted to NCBI under GEO accession ID GSE119263 and GSE106538. The two human sperm methylome and one mouse sperm methylome data were obtained from Gene Expression Omnibus under accession ID GSE49624 and (http://www.nodai-genome.org/mouse_en.html), respectively. All genomic annotation files, homologous gene-pairs, VCF files, and dn/ds ratios for human, cattle and mouse were downloaded from Ensembl database (https://uswest.ensembl.org/index.html). The GO annotation database can be publicly accessed (https://bioconductor.org/packages/release/data/annotation/html/org.Bt.eg.db.html).
Competing interests
The authors declare that they have no competing interests
Supplemental Material
Download Zip (1.8 MB)Acknowledgments
We thank Reuben Anderson, Alexandre Dimtchev, Zhiguang Li, Hongzheng Dai, Suzanne N. Martos, Yang Gao, Teng Li, and Zhibin Wang for technical assistances. Mention of trade names or commercial products in this article is solely for the purpose of providing specific information and does not imply recommendation or endorsement by the US Department of Agriculture. The USDA is an equal opportunity provider and employer.
Disclosure statement
No potential conflict of interest was reported by the authors.
Supplementary material
Supplementary data for this article can be accessed here.
Additional information
Funding
Related Research Data
References
- Barlow DP. Methylation and imprinting: from host defense to gene regulation? Science. 1993;260:309–311.
- Bestor TH. Cytosine methylation and the unequal developmental potentials of the oocyte and sperm genomes. Am J Hum Genet. 1998;62:1269–1273.
- Bourc’his D, Bestor TH. Meiotic catastrophe and retrotransposon reactivation in male germ cells lacking Dnmt3L. Nature. 2004;431:96.
- Sharp AJ, Stathaki E, Migliavacca E, et al. DNA methylation profiles of human active and inactive X chromosomes. Genome Res. 2011;21:1592–1600.
- Jenkins TG, Carrell DT. The sperm epigenome and potential implications for the developing embryo. Reproduction. 2012;143:727–734.
- Jenkins TG, Aston KI, Pflueger C, et al. Age-associated sperm DNA methylation alterations: possible implications in offspring disease susceptibility. PLoS Genet. 2014;10:e1004458.
- Aston KI, Uren PJ, Jenkins TG, et al. Aberrant sperm DNA methylation predicts male fertility status and embryo quality. Fertil Steril. 2015;104(1388–97):e1–5.
- Atsem S, Reichenbach J, Potabattula R, et al. Paternal age effects on sperm FOXK1 and KCNA7 methylation and transmission into the next generation. Hum Mol Genet. 2016;25:4996–5005.
- Jenkins TG, Aston KI, Meyer TD, et al. Decreased fecundity and sperm DNA methylation patterns. Fertil Steril. 2016;105(51–7):e3.
- Teschendorff AE, Relton CL. Statistical and integrative system-level analysis of DNA methylation data. Nat Rev Genet. 2018;19:129.
- Jones PA, Takai D. The role of DNA methylation in mammalian epigenetics. Science. 2001;293:1068–1070.
- Heard E, Martienssen RA. Transgenerational epigenetic inheritance: myths and mechanisms. Cell. 2014;157:95–109.
- Wang L, Zhang J, Duan J, et al. Programming and inheritance of parental DNA methylomes in mammals. Cell. 2014;157:979–991.
- Gaunt TR, Shihab HA, Hemani G, et al. Systematic identification of genetic influences on methylation across the human life course. Genome Biol. 2016;17:61.
- Van Dongen J, Nivard MG, Willemsen G, et al. Genetic and environmental influences interact with age and sex in shaping the human methylome. Nat Commun. 2016;7:11115.
- Li Y, Zheng H, Wang Q, et al. Genome-wide analyses reveal a role of Polycomb in promoting hypomethylation of DNA methylation valleys. Genome Biol. 2018;19:18.
- Molaro A, Hodges E, Fang F, et al. Sperm methylation profiles reveal features of epigenetic inheritance and evolution in primates. Cell. 2011;146:1029–1041.
- Qu J, Hodges E, Molaro A, et al. Evolutionary expansion of DNA hypomethylation in the mammalian germline genome. Genome Res. 2018;28:145–158.
- Gu X, Su Z. Tissue-driven hypothesis of genomic evolution and sequence-expression correlations. Proc Nat Acad Sci. 2007;104:2779–2784.
- Hernando-Herraez I, Garcia-Perez R, Sharp AJ, et al. DNA methylation: insights into human evolution. PLoS Genet. 2015;11:e1005661.
- Xia J, Han L, Zhao Z. Investigating the relationship of DNA methylation with mutation rate and allele frequency in the human genome. BMC Genomics. 2012;13:S7.
- Weigmann K. Lifestyle in the sperm: there is growing evidence that epigenetic marks can be inherited. But what is the nature of the information they store and over how many generations do they prevail? EMBO Rep. 2014;15:1233–1237.
- Yi SV. Insights into epigenome evolution from animal and plant methylomes. Genome Biol Evol. 2017;9:3189–3201.
- Elsik CG, Tellam RL, Worley KC. The genome sequence of taurine cattle: a window to ruminant biology and evolution. Science. 2009;324:522–528.
- Hammoud SS, Low DH, Yi C, et al. Chromatin and transcription transitions of mammalian adult germline stem cells and spermatogenesis. Cell Stem Cell. 2014;15:239–253.
- Ehrlich M. DNA hypomethylation in cancer cells. Epigenomics. 2009;1:239–259.
- Wagner JR, Busche S, Ge B, et al. The relationship between DNA methylation, genetic and expression inter-individual variation in untransformed human fibroblasts. Genome Biol. 2014;15:R37.
- Levine M, Tjian R. Transcription regulation and animal diversity. Nature. 2003;424:147.
- Schlosberg CE, VanderKraats ND, Edwards JR. Modeling complex patterns of differential DNA methylation that associate with gene expression changes. Nucleic Acids Res. 2017;45:5100–5111.
- Band MR, Larson JH, Rebeiz M, et al. An ordered comparative map of the cattle and human genomes. Genome Res. 2000;10:1359–1368.
- Kobayashi H, Sakurai T, Imai M, et al. Contribution of intragenic DNA methylation in mouse gametic DNA methylomes to establish oocyte-specific heritable marks. PLoS Genet. 2012;8:e1002440.
- Hammoud SS, Nix DA, Zhang H, et al. Distinctive chromatin in human sperm packages genes for embryo development. Nature. 2009;460:473.
- Xue Z, Huang K, Cai C, et al. Genetic programs in human and mouse early embryos revealed by single-cell RNA sequencing. Nature. 2013;500:593.
- Graf A, Krebs S, Zakhartchenko V, et al. Fine mapping of genome activation in bovine embryos by RNA sequencing. Proc Nat Acad Sci. 2014;111:4139–4144.
- Samans B, Yang Y, Krebs S, et al. Uniformity of nucleosome preservation pattern in Mammalian sperm and its connection to repetitive DNA elements. Dev Cell. 2014;30:23–35.
- Zhou Y, Connor EE, Bickhart DM, et al. Comparative whole genome DNA methylation profiling of cattle sperm and somatic tissues reveals striking hypomethylated patterns in sperm. GigaScience. 2018;7.
- Saitou M, Kurimoto K. Paternal nucleosomes: are they retained in developmental promoters or gene deserts? Dev Cell. 2014;30:6–8.
- Uhlén M, Fagerberg L, Hallström BM, et al. Tissue-based map of the human proteome. Science. 2015;347:1260419.
- Hockett M, Almeida R, Rohrbach N, et al. Effects of induced clinical mastitis during preovulation on endocrine and follicular function. J Dairy Sci. 2005;88:2422–2431.
- Hertl J, Gröhn Y, Leach J, et al. Effects of clinical mastitis caused by gram-positive and gram-negative bacteria and other organisms on the probability of conception in New York State Holstein dairy cows. J Dairy Sci. 2010;93:1551–1560.
- Reese J, Das SK, Paria BC, et al. Global gene expression analysis to identify molecular markers of uterine receptivity and embryo implantation. J Biol Chem. 2001;276:44137–44145.
- Kristiansen TZ, Nielsen MM, Blagoev B, et al. Mouse embryonic fibroblasts derived from Odin deficient mice display a hyperproliiferative phenotype. DNA Res. 2004;11:285–292.
- Gorenshteyn D, Zaslavsky E, Fribourg M, et al. Interactive big data resource to elucidate human immune pathways and diseases. Immunity. 2015;43:605–614.
- Lai CS, Fisher SE, Hurst JA, et al. A forkhead-domain gene is mutated in a severe speech and language disorder. Nature. 2001;413:519.
- Ostrowska M, Górka BŻ, Słoniewski K, et al. Expression of PC, PCK1, PCK2, LDHB, FBP1 and G6PC genes in the liver of cows in the transition from pregnancy to lactation. Animal Sci Pap Rep. 2013;31:281–290.
- Ehrlich M, Norris KF, Wang RY, et al. DNA cytosine methylation and heat-induced deamination. Biosci Rep. 1986;6:387–393.
- Zhao Z, Jiang C. Methylation-dependent transition rates are dependent on local sequence lengths and genomic regions. Mol Biol Evol. 2006;24:23–25.
- Jiang C, Han L, Su B, et al. Features and trend of loss of promoter-associated CpG islands in the human and mouse genomes. Mol Biol Evol. 2007;24:1991–2000.
- Stamatoyannopoulos JA, Adzhubei I, Thurman RE, et al. Human mutation rate associated with DNA replication timing. Nat Genet. 2009;41:393.
- Kong A, Thorleifsson G, Gudbjartsson DF, et al. Fine-scale recombination rate differences between sexes, populations and individuals. Nature. 2010;467:1099.
- Ma L, O’Connell JR, VanRaden PM, et al. Cattle sex-specific recombination and genetic control from a large pedigree analysis. PLoS Genet. 2015;11:e1005387.
- Jiang L, Zhang J, Wang -J-J, et al. Sperm, but not oocyte, DNA methylome is inherited by zebrafish early embryos. Cell. 2013;153:773–784.
- Milekic M, Xin Y, O’donnell A, et al. Age-related sperm DNA methylation changes are transmitted to offspring and associated with abnormal behavior and dysregulated gene expression. Mol Psychiatry. 2015;20:995–1001.
- Donkin I, Barrès R. Sperm epigenetics and influence of environmental factors. Mol Metab. 2018;14:1–11.
- Cohen NM, Kenigsberg E, Tanay A. Primate CpG islands are maintained by heterogeneous evolutionary regimes involving minimal selection. Cell. 2011;145:773–786.
- Liu Y, Sarkar A, Kheradpour P, et al. Evidence of reduced recombination rate in human regulatory domains. Genome Biol. 2017;18:193.
- Hurst LD, Smith NG. Do essential genes evolve slowly? Curr Biol. 1999;9:747–750.
- Jordan IK, Rogozin IB, Wolf YI, et al. Essential genes are more evolutionarily conserved than are nonessential genes in bacteria. Genome Res. 2002;12:962–968.
- Behrman EL, Howick VM, Kapun M, et al. Rapid seasonal evolution in innate immunity of wild Drosophila melanogaster. Proc R Soc B. 2018;285:20172599.
- Sun D, Huh I, Zinzow-Kramer WM, et al. Rapid regulatory evolution of a nonrecombining autosome linked to divergent behavioral phenotypes. Proc Nat Acad Sci. 2018;115:2794–2799.
- Langmead B, Trapnell C, Pop M, et al. Ultrafast and memory-efficient alignment of short DNA sequences to the human genome. Genome Biol. 2009;10:R25.
- Krueger F, Andrews SR. Bismark: a flexible aligner and methylation caller for Bisulfite-Seq applications. Bioinformatics. 2011;27:1571–1572.
- Jiang J, Cole JM, Da Y, et al. Fast Bayesian fine-mapping of 35 production, reproduction and body conformation traits with imputed sequences of 27K Holstein bulls. bioRxiv. 2018;428227.
- Lu Q, Powles RL, Abdallah S, et al. Systematic tissue-specific functional annotation of the human genome highlights immune-related DNA elements for late-onset Alzheimer’s disease. PLoS Genet. 2017;13:e1006933.
- Hao X, Zeng P, Zhang S, et al. Identifying and exploiting trait-relevant tissues with multiple functional annotations in genome-wide association studies. PLoS Genet. 2018;14:e1007186.
- Boyle EA, Li YI, Pritchard JK. An expanded view of complex traits: from polygenic to omnigenic. Cell. 2017;169:1177–1186.
- Rohde PD, Demontis D, Cuyabano BCD, et al. Covariance Association Test (CVAT) identifies genetic markers associated with schizophrenia in functionally associated biological processes. Genetics. 2016;203:1901–1913.
- Sørensen IF, Edwards SM, Rohde PD, et al. Multiple trait covariance association test identifies gene ontology categories associated with chill coma recovery time in drosophila melanogaster. Sci Rep. 2017;7.
- Sarup P, Jensen J, Ostersen T, et al. Increased prediction accuracy using a genomic feature model including prior information on quantitative trait locus regions in purebred Danish Duroc pigs. BMC Genet. 2016;17:11.
- Fang L, Sahana G, Ma P, et al. Exploring the genetic architecture and improving genomic prediction accuracy for mastitis and milk production traits in dairy cattle by mapping variants to hepatic transcriptomic regions responsive to intra-mammary infection. Genet Sel Evol. 2017;49:44.
- Fang L, Sørensen P, Sahana G, et al. MicroRNA-guided prioritization of genome-wide association signals reveals the importance of microRNA-target gene networks for complex traits in cattle. Sci Rep. 2018;8:9345.
- Finucane HK, Bulik-Sullivan B, Gusev A, et al. Partitioning heritability by functional annotation using genome-wide association summary statistics. Nat Genet. 2015;47:1228.
- Yu G, Wang L-G, Han Y, et al. clusterProfiler: an R package for comparing biological themes among gene clusters. OMICS. 2012;16:284–287.
- Benjamini Y, Hochberg Y. Controlling the false discovery rate: a practical and powerful approach to multiple testing. J Royal Stat Soc Ser B (Methodological). 1995;57:289–300.