
ABSTRACT
Dynamic regulation of chromatin accessibility is a key feature of cellular differentiation during embryogenesis, but the precise factors that control access to chromatin remain largely unknown. Lsh/HELLS is critical for normal development and mutations of Lsh in human cause the ICF (Immune deficiency, Centromeric instability, Facial anomalies) syndrome, a severe immune disorder with multiple organ deficiencies. We report here that Lsh, previously known to regulate DNA methylation level, has a genome wide chromatin remodeling function. Using micrococcal nuclease (MNase)-seq analysis, we demonstrate that Lsh protects MNase accessibility at transcriptional regulatory regions characterized by DNase I hypersensitivity and certain histone 3 (H3) tail modifications associated with enhancers. Using an auxin-inducible degron system, allowing proteolytical degradation of Lsh, we show that Lsh mediated changes in nucleosome occupancy are independent of DNA methylation level and are characterized by reduced H3 occupancy. While Lsh mediated nucleosome occupancy prevents binding sites for transcription factors in wild type cells, depletion of Lsh leads to an increase in binding of ectopically expressed tissue specific transcription factors to their respective binding sites. Our data suggests that Lsh mediated chromatin remodeling can modulate nucleosome positioning at a subset of putative enhancers contributing to the preservation of cellular identity through regulation of accessibility.
Introduction
Genomic DNA is packaged with proteins to form chromatin [Citation1–Citation6]. Chromatin compacts the genome which can impede access to DNA sequences. Dynamic changes of chromatin organization are critical for the regulation of DNA based processes such as transcription, repair or recombination. Specific cellular lineages develop during embryogenesis and each cellular phenotype depends on explicit expression of an array of tissue specific genes, including specific transcription factors that serve as lineage-specific determinants. The binding of transcription factors to their genomic target sequences depends on coordinated changes in chromatin accessibility. The modulation of chromatin accessibility is an essential feature of cell fate determination.
The nucleosome, the small subunit of chromatin, is formed by wrapping about 145–147 base pairs of DNA around a histone core [Citation4,Citation5]. The position of nucleosomes is a crucial determinant of regulating access to DNA sequences. Nucleosome positioning can be modulated by the action of ATP dependent chromatin remodeling proteins and depends, in part, on the underlying DNA sequences and binding of DNA binding factors. SNF2 homologs perform ATP dependent chromatin remodeling by loosening histone-DNA interactions [Citation2]. They can cause nucleosome sliding, assembly and disassembly of nucleosomes, and histone exchange in vitro and in vivo
Murine Lsh (Lymphoid Specific Helicase) and the human homolog HELLS (Helicase Lymphoid Specific) belong to the family of SNF2 like chromatin remodeling proteins [Citation7,Citation8]. Mutations in HELLS cause a severe human disease with increased childhood lethality, termed ICF (Immune deficiency, Centromere instability, Facial anomalies) syndrome [Citation9]. The Lsh protein is highly conserved among mammals and deletion of Lsh in mice leads to hematopoietic perturbation, neural stem cell defects, germ cell deficiencies, reduced growth and kidney defects [Citation10–Citation15]. Lsh associates with heterochromatin [Citation16] and is a regulator of global DNA methylation level [Citation14,Citation17–Citation24]. Despite the severe loss of DNA methylation in the absence of Lsh, expression of protein-coding genes is mostly maintained in the absence of Lsh [Citation13,Citation21,Citation25,Citation26], in part through compensatory mechanisms such as H3K27me3 re-distribution [Citation26]. Lsh, as well as its plant homolog DDM1, facilitate DNA methylation of nucleosomal DNA [Citation27]. Recombinant Lsh can perform chromatin remodeling in vitro in conjunction with Cdca7 [Citation28]. In vivo Lsh regulates nucleosome occupancy at repeat sequences in an ATPase dependent fashion [Citation20]. In addition, loss of Lsh promotes the formation of putative enhancers marked by H3K4me1 acquisition and reduced DNA methylation in primary murine embryonic fibroblasts [Citation23]. However, whether Lsh controls genome wide nucleosome positioning, and whether alterations in nucleosome occupancy by Lsh could influence chromatin accessibility at enhancers still need to be fully addressed. To gain insights into Lsh dependent chromatin structure, we performed Micrococcal nuclease (MNase) digestion followed by high-throughput sequencing. Using cellular experimental systems that control Lsh protein levels, but do not change DNA methylation, we examine MNase accessibility, nucleosome occupancy and transcription factor engagement in dependence of Lsh. Here, we report a specific role for Lsh in guarding and preserving chromatin structure to prevent access to tissue specific enhancers or regulatory regions.
Results
Increased MNase digestibility in MEFs derived from Lsh-/- (KO) embryos
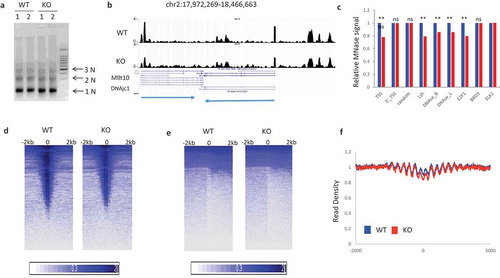
To determine genome-wide chromatin structure and nucleosome organization, we used micrococcal nuclease (MNase) treatment followed by high-throughput sequencing (MNase-Seq) a procedure previously applied for different cell types [Citation29–Citation34]. MNase cleaves linker DNA between nucleosome particles allowing a detailed description of nucleosome occupancy in each cell population. We measured DNA protection patterns after chromatin digestion by MNase comparing sets of identical cell types with or without Lsh. Initially, we performed digestion comparing chromatin from primary murine embryonic fibroblasts (MEF) derived from Lsh-/- embryos (KO) or littermate Lsh+/+ control embryos (WT) [Citation12]. As expected, Lsh protein was undetectable in cell lysates derived from KO MEFs compared to WT MEFs (supplement Figure S1). Chromatin was digested under standardized conditions yielding predominantly di- and mono-nucleosomes ()). Mono-nucleosome DNA (150-200bp) was selected for library preparation and subjected to high-throughput sequencing. Mapped reads indicate protection from MNase digestion and reveal nucleosome occupancy, while low DNA signals denote little recovery of DNA fragments and indicate a lack of protection from MNase digestion [Citation29–Citation34]. For simplicity we use the term nucleosome occupancy for genomic loci with high recovery of digestion fragments. The UCSC genome browser view visualizes the normalized read density, and we observed that KO chromatin displayed lower read density at numerous genomic regions preferentially around transcriptional start sites (TSS), suggesting lower nucleosome occupancy in the absence of Lsh at putative regulatory regions ()). To assess further accessibility, we quantified average MNase signal density at selected genomic loci with known features. At transcriptional start sites (TSS), MNase signal density was reduced by 22% comparing KO to WT chromatin ()). In contrast, there were no significant changes in further upstream regions of TSS and randomly chosen regions ()). Furthermore, MNase digestion was reduced by 15% at potential regulatory sites, which had been previously identified by DNase I hypersensitivity ()). Some transcription factor binding sites and Lsh binding sites also showed alteration in MNase accessibility ()). Next, we generated intensity plots of average MNase signal density around selected loci, such as TSS, transcription end sites (TES) and Rad21 binding sites, a component of the cohesin complex, where nucleosomes are well positioned ()) [Citation31,Citation34–Citation37]. Notably, recovery of MNase-resistant fragments was reduced at TSS and Rad21 binding sites in chromatin derived from KO MEFs compared to wild type chromatin ()).
Figure 1. Reduced MNase digestibility at potential transcriptional regulatory regions in KO (Lsh-/-) compared to WT (Lsh+/+) MEFs (a). MNase digestion followed by agarose gel electrophoresis in MEFs derived from two Lsh-/- (KO) embryos and two wild type (Lsh+/+) controls for isolation of mono-and di-nucleosomal DNA. (b). Genome browser view of normalized read density of WT and KO samples. The arrows at the bottom indicate the direction of the two depicted genes. (c). Bar graph representing average read density at 4kb region around TSS, 5’_TSS, random sites, Lsh binding sites, DNase I hypersensitivity sites of B cells, DNase sites of liver, transcription factor E2F1, Brd3, and Elk1. ** p value<0.01, NS, not significant, p > 0.05. (d). Intensity Plot of MNase-seq signal enrichment around TSS sites (e). Intensity Plot of MNase-seq signal enrichment around TES sites (f). Profiles of MNase-seq signal enrichment at Rad21 binding sites and 2000bp flanking region upstream and downstream. WT (blue), KO (red).
Changes in MNase accessibility independent of DNA methylation
Lsh controls establishment of DNA methylation and KO MEFs display reduced CG methylation at transcriptional start sites [Citation18,Citation26]. DNA methylation profiles around Rad21 binding sites are phased and indicate positions of nucleosomes (supplement Figure S2(a)). KO MEF derived patterns are DNA hypomethylated at Rad21 binding sites and at selected transcription factor binding sites, including Cebpb, C-myc, and Pu.1 binding sites (supplement Figure S2(b-d)). Since several reports suggest the interplay between DNA methylation and nucleosome positioning [Citation38–Citation42], we considered the possibility that differences in MNase digestibility comparing WT to KO MEFs may be linked to DNA methylation changes.
To determine whether chromatin accessibility mediated by Lsh is dependent on DNA methylation change, we designed two experimental approaches. First, we derived MEFs from conditional Lsh knockout mice which contained a 4-Hydroxytamoxifen (OHT) inducible cre-recombinase transgene. This method allowed us to derive MEFs with a wild type DNA methylation pattern and to delete Lsh in vitro using OHT ()). Western blot analysis demonstrated Lsh protein was successfully depleted after 48 hours of drug treatment ()). In a second approach, we applied an auxin-inducible degron (AID) system using plant hormone auxin (indole-3-acetic acid, IAA) to conditionally control Lsh protein stability [Citation43]. Full length Lsh was expressed as a fusion protein containing the AID degron in Lsh conditional knockout MEFs and the Lsh gene was deleted through cre-recombinase expression. The addition of auxin (IAA) induces Tir1 E3 ligase mediated ubiquitination of AID-Lsh and subsequent rapid degradation of Lsh by the proteasome ()). Western blot analysis demonstrated loss of Lsh after two hours of auxin treatment ()). Next, we examined CG methylation after short term depletion of Lsh. Lsh supports cell autonomously de novo methylation at CG sites during development [Citation18,Citation20,Citation44]. A primary wave of de novo DNA methylation occurs early in development after implantation. MEFs derived from day13.5 WT embryos display a high content of DNA methylation, whereas KO MEFs which lack Lsh in vivo early in development show significant loss of DNA methylation ()) [Citation14,Citation17,Citation18]. In contrast, when Lsh is depleted in vitro, using two days of OHT or three days of IAA treatment, there are no global changes in DNA methylation as measured by an ELISA assay ()) or by liquid chromatography (LC)–mass spectrometry ()). Moreover, bisulfite sequencing which measures CG methylation at single base pair resolution at Pcdha8 promoter region, did not show any changes in CG methylation after depletion of Lsh in vitro, in contrast to CG methylation changes detected in KO and WT MEFs ()). These results indicate that a short-term loss of Lsh does not alter CG methylation levels.
Figure 2. Chromatin accessibility changes after Lsh depletion occur without DNA methylation changes (a). Graph of conditional Lsh MEFs (flox/flox) containing a tamoxifen (OHT) inducible cre-recombinase transgene which were treated in vitro with tamoxifen. (b). Western analysis for Lsh protein detection after 48 hours of tamoxifen treatment with biological replicates. (c). Graph of auxin inducible Lsh proteolytic degradation system. Lsh (orange) is tagged with degron (yellow) which allows association with Tir1 E3 ligase (blue) after auxin (IAA) addition, followed by ubiquitination and degradation. (d). Western analysis for Lsh protein detection after auxin (IAA) addition at indicated time points. (e). Elisa assay for detection of global DNA methylation without (IAA-0hr) and with (IAA-72hrs) IAA treatment, or without (OHT-0hr) and with (OHT-48hr) tamoxifen treatment. KO MEFs derived from day13.5 Lsh-/- embryos and WT MEFs derived from Lsh+/+ embryos serve as controls. * p value<0.01, NS, not significant, p > 0.05. (f). LC-Mass spectrometry for detection of global DNA methylation without (IAA-0hr) and with IAA treatment (IAA-72hrs), or without (OHT-0hr) and with tamoxifen treatment (OHT-48hr). (g). Bisulfite sequencing analysis for DNA methylation detection at 11 sites of the Pcdha8 gene for MEFs without (IAA-0hr) and with (IAA-72hrs) IAA treatment. (h). Profiles of MNase-seq signal enrichment at Rad21 binding sites and 2000bp upstream and downstream flanking regions. MEFs were untreated (0h) or treated for 72 hours (72h) with auxin for deletion of Lsh. (i-k). Mean read densities in a region comprising −100bp to +100bp around Rad21 binding sites are plotted as box-whisker plot. ** p-value < 0.002 (Wilcoxon signed rank test with continuity correction). MEFs without (IAA_0h) or with seven hours of auxin treatment (IAA_7h), or without (OHT_0h) and with 48 hours of tamoxifen treatment (OHT_48h), or derived from wild type embryo (WT) or Lsh-/- embryo (KO). ** p-value< 0.002.
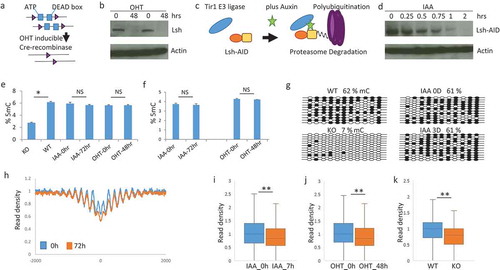
Next, we performed MNase-seq analysis comparing pairs of chromatin samples derived from MEFs after 48 hours of cre-recombinase mediated Lsh depletion (OHT-48h) or after 48 hours of culture without cre-recombinase induction (OHT-0h). Likewise, MNase-seq analysis was performed after seven (IAA-7h) or 72 hours (IAA-72h) of proteolytic Lsh degradation or without 72 hours of auxin treatment (IAA-0h). Western analysis confirmed that Lsh protein was undetectable in cell lysates derived from MEFs after seven and 72 hours of proteolytic degradation (supplement Figure S3). Generating MNase signal density profiles at Rad21 binding sites, we detected increased MNase digestibility of chromatin derived from MEFs after 72 hours of auxin induced Lsh protein degradation ()). Moreover, the change in nucleosome occupancy was also significant at 7 hours of IAA induced Lsh depletion ()), after tamoxifen (OHT) induced Lsh depletion ()) and in WT and KO MEFs ()). This suggested that both in vitro systems are suitable for Lsh depletion and studying Lsh effects on chromatin configuration independent of DNA methylation.
Genomic sites with increased MNase digestibility in dependence of Lsh
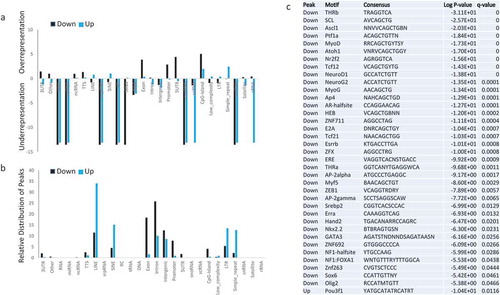
To use an unbiased approach to identify changes in chromatin configuration, we applied the software Danpos2 [Citation45,Citation46]. About 0.94% of the genome displayed reduced MNase signal density in the absence of Lsh (Down Peaks) when comparing KO to WT samples. To identify regions that are reproducible and independent of global DNA methylation changes we assessed the intersection of Down Peaks generated in WT and KO pairs with sample pairs without (OHT-0h) and with (OHT-48h) tamoxifen treatment and without (IAA-0h) and with auxin (IAA-7h) treatment. The intersection of genomic regions that differed consistently in all three sample sets (six samples altogether) covered 0.23% of the genome and comprised 11,868 distinct Down Peaks. In contrast, genomic regions with increases in MNase signal density (Up Peaks) were less frequent and the intersection of all three sample pairs comprised 0.1% of the genome with 8,891 regions. Subsequently, the genomic regions with Down or Up Peaks were analyzed for the presence of genomic features, including TSS, exons, introns, non-protein coding RNA, and repeat sequences. Down Peaks and Up Peaks were underrepresented at most RNA (non-protein) encoding sequences ()). Down Peaks were distinctly enriched at CpG islands, 5’UTR, promoter regions, and exons, whereas Up Peaks were overrepresented at repeats, Sine and Line elements and a fraction of CpG islands. Further analysis determined the distribution of Down or Up Peaks at specific genomic features ()). More than half of Down Peaks were annotated at protein coding regions (exon, intron, promoter, 5’UTR) and 12% at intergenic regions. In contrast, 80% of Up Peaks were located within Line or Sine repeat elements, LTRs and simple repeats.
Figure 3. Characterization of genomic regions with MNase digestibility changes in dependence of Lsh (a). Bar graph presentation to illustrate relative enrichment (positive scale) or relative depletion (Negative scale) of Down Peaks (black, lower MNase signal density in the absence of Lsh) and Up Peaks (blue, greater MNase signal density in the absence of Lsh) at genomic features, including 3UTR, other, RNA, miRNA, ncRNA, TTS, Line, snpRNA, Sine, RC, tRNA, DNA, Exon, Intron, Intergenic, promoter, 5UTR, snoRNA, scRNA, CpG island, Low complexity regions, LTR, sample repeats, snRNA, satellites, and tRNA. (b). Bar graph presentation to illustrate the distribution of down peaks (black) and up peaks (blue) at known genomic location expressed as percentage. (c). Motif analysis for Down Peaks (lower MNase signal density in the absence of Lsh) and Up Peaks (greater MNase signal density in the absence of Lsh). Q-value (Benjamini).
Overall, our unbiased approach using three sets of samples identified specific genomic regions with altered chromatin accessibility in dependence of Lsh function. While Lsh deletion decreases MNase signal density at genes and gene rich regions, it increases it at repetitive sequences frequently found at gene poor regions thus contributing to the overall distribution of nucleosomes and the stability of chromatin states. Our results are consistent with a model in which Lsh functions to balance nucleosome occupancy and facilitating nucleosome positioning at genes and regulatory regions.
Subsequently, we performed DNA binding motif analysis in Down Peak sequences and identified significant enrichment for certain DNA binding motifs above the whole genome background ()). This is consistent with the high prevalence of Down Peaks in presumed transcriptional regulatory regions, since about 16% of peaks reside in promoters, 5’ UTRs regions, and CpG islands. There was not only an enrichment for motifs in Down Peak sequences, in addition, we found that a subset (about 10%) of motifs was enriched ()) suggesting that Lsh affects only a subgroup of DNA factor binding motifs. In contrast, Up Peaks had only one single motif significantly enriched (Pou3f1) ()). This result is consistent with higher prevalence of Up Peaks in ‘desert’ or gene-free regions of the genome. The 36 motifs associated with Down Peaks can bind transcription factors (TFs) that are known to determine cell fates in specific cellular lineages. Notably, several TFs play a role in neuronal differentiation, neural maintenance or neural function such as ASCL1, SOX6, OLIG2, NEUROD1, NKX2.2 (which can bind to the NEUROD1 promoter), ATOH1 and its paralog NEUROG2, ESRRB which plays a role in deafness, and ZNF711 involved in cognitive disability ()). Multiple motifs bind factors involved in cardiac or skeletal muscle differentiation such as MYF5, MYOG, MYOD1, SOX6, HAND2 and NR2F2, which plays a role in congenital heart defects. MYF5 together with MYOG and MYOD1 co-occupies muscle-specific gene promoter of NR2F2. Finally, various TFs are involved in hematopoietic cell development or leukemia, such as GATA3, SCL(TAL1), OLIG2 and E2A(TCF3), which are associated with several immunodeficiency diseases.
We validated the results of the motif search and generated MNase signal density profiles for some of the identified motifs for DNA binding factors ()). Profiles of Pou3f1 binding sites, which were the only motif present in UP peaks, were indistinguishable comparing samples with or without Lsh (supplement Figure S4). This suggests that only a minority of Pou3f1 binding sites are affected by the deletion of Lsh, possibly because 80% of Up Peaks are located within Line, Sine, LTRs and simple repeat elements. For validation of motifs located in Down peaks, we selected transcription factors binding sites that had been empirically identified through ChIP-sequencing analysis. Significant changes were detected in MEFs after 48 hours of Lsh depletion induced by tamoxifen treatment at Ptf1a, a transcription factor with a role in pancreatic development, Atoh1 and NeuroD1 with roles in neuronal differentiation, and MyoD1 in myogenic differentiation ()). MNase accessibility was further augmented in samples with a 72 hours depletion of Lsh using auxin treatment, giving additional support for the notion of Lsh mediated chromatin changes ()). In addition, differences of MNase signal density was easily detected at putative enhancers characterized by DNase I hypersensitivity in B cells and mammary glands, or by H3K27ac or H3K4me1 modifications in adipose or myoblast tissue, respectively ()).
Figure 4. Chromatin accessibility changes at transcription factor binding sites and potential enhancer regions (a). Profiles of mean MNase-seq signal enrichment without (blue) and with 48h of Lsh deletion (orange) induced by tamoxifen (OHT) treatment at Pft1a, Atoh1, MyoD and NeuroD1 binding sites and 2000 bp of upstream and downstream flanking regions. (b). MNase profiles without (blue) and with 72h of Lsh deletion (red) induced by auxin (IAA) treatment at Pft1a, Atoh1, Myod1 and Neorod1 binding sites and 2000 bp of upstream and downstream flanking regions. (c). MNase profiles without (blue) and with 72h of Lsh deletion (red) induced by auxin (IAA) treatment at potential enhancer regions identified by DNase I treatment in B cells or mammary gland cells or identified by H3K27ac enrichment in adipose tissue or by H3K4me1 enrichment in myoblasts and 2000 bp of upstream and downstream flanking regions. * p-value< 0.002.
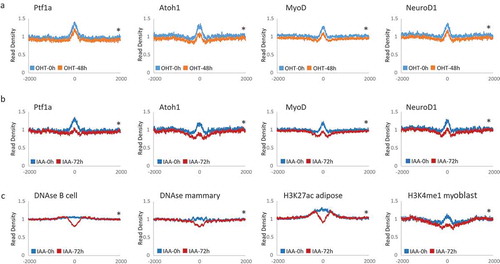
These results suggest that Lsh depletion induces enhanced MNase digestion and reduced nucleosome coverage at putative regulatory elements identified for different cellular lineages. Those sites were characterized by tissue specific DNase I hypersensitivity, H3K4me1 or H3K27ac enrichment, and DNA binding factor sites for a subset of transcription factors known to control lineage differentiation.
Decreased H3 retention at transcription factor binding sites in the absence of Lsh
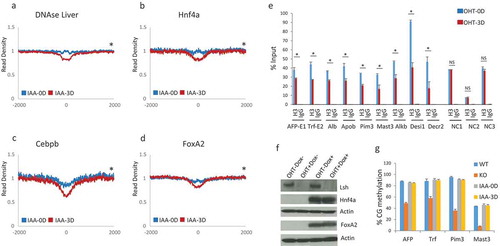
Since Lsh depletion induces profound chromatin changes at liver specific DNase I hypersensitive sites ()), we specifically examined MNase digestibility at Cebpb, Hnf4a and Foxa2 binding sites (). These three transcription factors are essential for the regulation of liver specific gene expression and for hepatocellular differentiation [Citation36,Citation47–Citation50]. Foxa2 binding sites are enriched at liver-specific distal enhancers, but not at ubiquitous enhancers or promoter regions [Citation51]. About 95% of Foxa2 sites are distal to TSSs and 8% overlap with tissue specific DNase I hypersensitive sites [Citation51]. Furthermore, Foxa2 and Hnf4a are not expressed in MEFs [Citation26]. We noted significant changes in MNase read density comparing MEFs with Lsh to MEFs after three days of Lsh deletion at the binding sites for all three transcription factors (). These results indicated an increase in chromatin accessibility in the absence of Lsh. To test whether alterations in MNase-seq signal intensity indeed represent changes in nucleosome occupancy, we performed ChIP experiments using sonicated chromatin for detection of the core histone H3 followed by q-PCR analysis. It should be noted that the anti-H3 antibody detects all H3 variants, including H3.3 which is deposited at active enhancers [Citation52]. We selected nine loci with DNA binding motifs for both transcription factors Foxa2 and Hnf4a [Citation47]. All nine sites displayed diminished MNase-seq signal strength after Lsh depletion indicating an increase in chromatin accessibility. Using H3 ChIPs analysis we found that H3 retention was significantly reduced at all examined sites in Lsh depleted cells compared to control samples ()). In contrast, three control sites without MNase signal changes showed no difference in H3 precipitation (NC1, NC2, NC3 in )). Our results suggest that low MNase read density represents, in part, a decrease of canonical nucleosomes in Lsh depleted cells.
Figure 5. Increased chromatin accessibility and reduced H3 retention at liver specific transcription factor binding sites. (a-d). Profiles of mean MNase-seq signal enrichment without (blue) and with three days (3D) of Lsh deletion (red) induced by auxin (IAA) treatment at DNase I hypersensitivity sites in liver (a), Hnf4a (b), Cebpb (c) and FoxA2 (d) binding sites and 2000 bp of upstream and downstream flanking regions. Wilcoxon signed-rank test, * p-value< 0.002 (e). ChIPs analysis using anti-H3 or IgG control at Foxa2 and Hnf4a binding sites of the indicated genes in MEFs without (OHT-0D) and with (OHT-3D) three days of tamoxifen treatment for depletion of Lsh. NC1, NC2, NC3 sites do not show changes in chromatin accessibility and serve as control sites. AFP Alpha-Fetoprotein, Trf Transferrin, Alb Albumin, Apob Apolipoprotein B, Pim3 proviral integration site 3, Mast3 microtubule associated serine/threonine kinase 3, Alkbh8 AlkB homolog 8, Desi1 Desumoylating isopeptidase 1, Decr2 2,4-Dienoyl-CoA Reductase. ChIPs results represent the mean ± SD of three independent experiments. SD: standard deviation.* p-value< 0.01 (f). Western analysis for detection of Lsh, Hnf4a, Foxa2 and actin (control) protein expression in MEFs without (OHT-) and with (OHT+) three days of tamoxifen treatment for depletion of Lsh, and without (Dox-) and with (Dox+) two days of doxycycline treatment for induction of the liver specific transcription factors Foxa2 and Hnf4a. (g). Bisulfite sequencing analysis for detection of DNA methylation at four sites (AFP, Trf, Pim3 and Mast3 genes). Genomic DNA was derived from MEFs without (IAA-0D) and with (IAA-3D) auxin treatment or from MEFs derived of Lsh-/- (KO) or Lsh+/+ (WT) embryos, serving as controls.
Lsh deletion enhances transcription factor engagement at regulatory sites
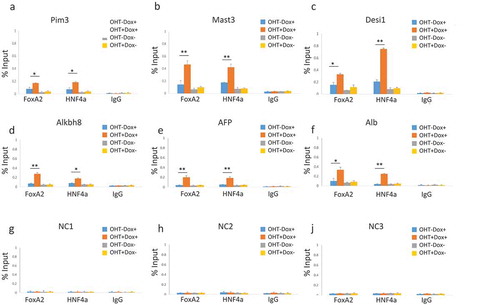
To explore further the functional significance of altered nucleosome occupancy mediated by Lsh, we tested binding of DNA binding factors at sites with increased MNase accessibility upon Lsh deletion. Initially, we examined binding of endogenous Rad21 and detected moderate increases of Rad21 binding at multiple respective binding sites (supplement Figure S5). These results were consistent with previous observations of enhanced binding of some endogenous transcription factors in the absence of Lsh [Citation23]. To choose an unbiased approach and to examine binding of tissue specific transcription factors, we applied drug induced protein expression of two liver specific transcription factors, Hnf4a and Foxa2 which are absent in MEFs based on RNA-seq analysis [Citation26]. MEFs were transduced with viral vectors expressing Flag-tagged Foxa2 and GFP-traced Hnf4a under the control of a tetracycline inducible promoter. MEFs were first treated with tamoxifen (OHT) for three days to activate cre-recombinase and deplete Lsh, followed by two days of doxycycline treatment to induce ectopic expression of transcription factors. Western blot analysis ()) and immunofluorescence detection (supplement Figure S6) confirmed rigorous induction of Foxa2 and Hnf4a protein levels in MEFs, whereas the level of Lsh protein was greatly diminished ()). Using specific antibodies against Foxa2 and Hnf4a for precipitation and IgG as control, we performed ChIP-qPCR to assess Foxa2 and Hnf4a binding ability in dependence of Lsh. Without doxycycline treatment, the transcription factors were not expressed ()) and there was no detectable transcription factor binding ( and supplement Figure S7). After induction of the ectopic transcription factors by doxycycline treatment ()), significant transcription factor binding was detected at their respective biding sites with significantly higher occupancy in Lsh depleted cells compared to controls ( and supplement Figure S7). For most sites a two to threefold higher transcription factor occupancy was observed, for Alpha fetoprotein and Albumin even a five- to sevenfold difference for Foxa2 and Hnf4a, respectively (). Notably, the latter two target genes did not show any significant association of either Foxa2 or Hnf4a in control cells, but only in the absence of Lsh, suggesting that Lsh mediated chromatin occupancy was masking accessibility of those transcription factors. As expected, control sites that had no changes in MNase accessibility or changes in H3 retention displayed no differences in Foxa2 or Hnf4a binding capacity (NC1, NC2, NC3 in -i)). Thus, increased MNase digestion and lower H3 content is linked to higher occupancy of ectopically expressed transcription factors. Our results suggest that Lsh mediated chromatin remodeling controls accessibility of DNA binding factors to their respective sites.
Figure 6. Increased occupancy of exogenously expressed transcription factors at sites of increased chromatin accessibility. ChIPs analysis using anti-Foxa2, anti-Hnf4a or IgG control for detection of Foxa2 and Hnf4a at indicated genes, as examined in ). MEFs without (OHT-) and with (OHT+) three days of tamoxifen treatment for depletion of Lsh, and without (Dox-) and with (Dox+) two days of doxycycline treatment for induction of the liver specific transcription factors Foxa2 and Hnf4a. (a). Pim3 proviral integration site 3. (b). Mast3 microtubule associated serine/threonine kinase 3. (c). Desi1 Desumoylating isopeptidase 1. (d). Alkbh8 AlkB homolog 8. (e). AFP Alpha-Fetoprotein. (f). Alb Albumin. (g). – I. NC1, NC2, NC3 sites do not show changes in chromatin accessibility and serve as control sites, as in ). ApoB, Decr2 and Trf are shown in supplement Figure S7. ChIPs results represent the mean ± SD of three independent experiments. SD: standard deviation. *P < 0.05; **P < 0.01.
Lastly, we pondered if the improved transcription factor binding in Lsh depleted cells was dependent on DNA methylation changes, although the global level of CG methylation was unchanged. We determined DNA methylation contents at specific transcription factor Foxa2 and Hnf4a binding regions. All examined sites were highly methylated and maintained similar CG methylation pattern in the presence or absence of Lsh () and supplement Figure S8(a-d)). For example, Foxa2 and Hnf4a transcription factor sites at the Afp gene, were highly methylated with two days of tamoxifen treatment (86.3%) or without two days of treatment (87.5%) to induce in vitro depletion of Lsh (supplement Figure S8(a-d)). In addition, we found no changes in cytosine methylation patterns at Rad21 binding sites (supplement Figure S9). In contrast, the Lsh knockout MEFs (KO), derived from Lsh-/- embryos, displayed significantly reduced CG methylation (supplement Figure S8(a-d)). Thus, reduced cytosine methylation at those sites may depend on the precise timing and duration of Lsh deletion during embryogenesis.
Altogether, Lsh depletion altered chromatin accessibility which was not associated with altered CG methylation levels. Short-term depletion of Lsh reduced nucleosome occupancy, increased MNase accessibility and resulted in enhanced ability to bind ectopically expressed transcription factors.
Discussion
Previous work has shown that Lsh is an in vitro chromatin remodeler [Citation28], that Lsh regulates nucleosome occupancy at specific loci in vivo [Citation13,Citation20] and that artificial recruitment of Lsh reduces chromatin accessibility at the tethered site in vivo [Citation53]. Using MNase digestion followed by high-throughput sequencing, we characterized genome wide changes in MNase digestibility mediated by Lsh. We use the term nucleosome occupancy to describe the pattern of MNase digestion fragments at genomic loci. Since MNase digestion is influenced by the context of DNA sequences [Citation54], we performed pairwise comparison of the same genomic locations in the presence or absence of Lsh, thus limiting bias from the genetic background and growth passages. The results of our study are based on the analysis of primary chromatin structure in three murine fibroblasts systems: MEFs derived from embryos with a targeted deletion of Lsh compared to control wild type embryos, MEFs derived from Lsh conditional knockout mice with or without in vitro deletion of Lsh within 48 hours, and MEFs with or without 7 hours of proteolytic degradation of Lsh. The in vitro deletion of Lsh does not alter global DNA methylation level significantly. We report here, that dynamic reduction of Lsh protein level leads to an increased accessibility at potential enhancers that are characterized for specific lineages. The decrease of histone H3 enrichment suggests reduced occupancy of canonical nucleosomes due to Lsh depletion. We also demonstrate enhanced transcription factor engagement at sites with increased accessibility and concomitantly reduced H3 level. Thus, we conclude that Lsh preserves occupancy of canonical nucleosomes and alters chromatin configuration on a genome wide scale. These results are consistent with a model in which Lsh masks access of lineage specific factors to their respective binding sites.
SNF2 homologs and associated factors, including Lsh itself, bind to regulatory regions critical for transcription, including RNA Pol II binding sites, enhancers, as well as regions involved in chromosome organization [Citation2,Citation37,Citation55–Citation58]. The biologic significance of chromatin remodeling factors can be only elucidated upon depletion, since many SNF2 complex binding sites show no alteration in chromatin structure upon mutation of the respective chromatin remodeler and the same chromatin remodeling protein can induce an open or closed chromatin structure, depending on the binding site [Citation59]. Here, we assessed genome wide nucleosome configuration and found increased MNase digestion at specific loci after Lsh depletion. The changes are widespread, but selective, and comprise sites characterized by lineage specific DNase I hypersensitivity, H3K4me1 modifications and transcription factor binding, indicative of potential enhancers [Citation60]. Many studies highlight the importance of enhancers for cell type specific gene expression and direct reprogramming. Enhancers show increased chromatin accessibility and high occupancy of activators, such as DNA binding factors [Citation61,Citation62]. Comparing the MNase profiles of embryonic stem cells with those derived from somatic cells, only proportionally small chromatin changes were noted, and those differences appeared predominantly at transcriptional regulatory elements, including enhancers [Citation62]. In addition, the nucleosome configuration at enhancer regions showed strong overlap among different pluripotent stem cell lines but differed greatly from those profiles generated in differentiated cells. This points to an important function of nucleosome positioning at enhancers, which can control accessibility of transcription factors and thus determine cell fate decisions.
SNF2 homologs that remodel nucleosomes, have been shown to enhance chromatin access and facilitate transcription factor binding, such as Tal1, Stat3 and glucocorticoid receptor [Citation55,Citation63,Citation64]. The chromatin remodeler Brg1, for example, shifts nucleosomes in vivo at Gata1 binding sites allowing Tal1 binding and gene activation during differentiation [Citation55]. The histone chaperone Chaf1a, on the other hand, has been implied in repression of chromatin accessibility at ES cell type specific enhancers. For instance, depletion of Chaf1 leads to improved reprogramming of somatic cells into induced pluripotent cells [Citation65]. Our data suggests that Lsh masks tissue specific potential enhancers, characterized by lineage specific DNase I hypersensitivity or by H3 modifications. In wild type cells, Lsh preserves nucleosome occupancy and prevents transcription factor engagement. Exposing these potential regulatory sites after Lsh depletion can enhance transcription factor occupancy and could potentially alter the cellular phenotype upon reprogramming. As previously shown, Lsh depleted cells show greater plasticity and can be more easily directed into differentiation into other cell types such as the neural lineage upon reprogramming [Citation23] suggesting that Lsh acts as safeguard of chromatin accessibility to preserve cellular identity.
Chromatin structure represents, in part, the epigenetic memory of a cell that determines its specific phenotype. During cellular differentiation, chromatin configuration is reset to allow reprogramming of cell type specific gene expression patterns. Our data suggests that Lsh controls nucleosome occupancy and, in part, prevents transcription factor access at regulatory sites thus concealing putative enhancers that do not belong to the specific cell lineage. Understanding the molecular mechanisms to control accessibility of enhancers provides key insights into cellular differentiation and maybe useful for directed programming of somatic cells into diverse lineage specific cells.
Material and methods
Cell culture and treatment
MEF cells were cultured in DMEM media supplemented with 15% heat-inactivated fetal bovine serum (FBS), 100μg/ml streptomycin, and 100μg/ml penicillin in a 5% CO2 environment at 37°C following standard method. Cells were harvested and cultured in 6 well plates and 100, 200mm Petri dishes. To generate Auxin mediated Lsh degradation system, cells were transfected with plasmid pBabe TIR1-9myc (Addgene, 47328) and treated with 2 µg/ml puromycin to obtain stably transfected cells. The cells were subsequently infected by the lentivirus with AID-Lsh plasmid (AID gene was subcloned from Addgene 47329 plasmid), after selection with 10 µg/ml blasticidin for 1 week, the cells were transfected with the pGK-Cre plasmid to delete endogenous Lsh. To degrade the Lsh protein in cells, the hormone auxin (IAA, 1mM, Sigma) was used at indicated times for treatment or cells were incubated without auxin. All sample pairs were harvested simultaneously. OHT cells were immortalized from MEFs that had been derived from Lsh(Flox/Flox)-ER-Cre+ conditional knockout mice. The cells were either incubated with tamoxifen (1µm, Sigma) to delete the floxed Lsh or were incubated without tamoxifen, and cells were harvested simultaneously. CePlasmid pBSSVD2005 (Addgene) containing the SV40 large T antigen was used for immortalization of primary fibroblasts derived from mice at day 13.5 of gestation.
Nucleosomal DNA extraction and sequencing
Nucleosomal DNA derived from 1 × 10⁶ cells was prepared using EZ nucleosomal DNA prep kit (D5220, Zymo research). Nucleosome digestion was performed at varying doses (less than 0.5 U) Micrococcal Nuclease (MNase) for 5 min at 25°C. The reactions were stopped by addition of 5× MN stop buffer and nucleosomal DNA subsequently purified using Zymo-spin IIC column. Sample pairs were treated simultaneously. The purified nucleosomal DNA fragments were separated by 2% agarose gel electrophoresis. The most effective MNase concentration was experimentally identified for each set of experiments and the digestion which generated primarily mono-nucleosomes compared to di-nucleosomes was selected. The same MNase concentration was used for each sample pair comprising Lsh depletion and the control sample. Mono-nucleosomal DNA (1N) was obtained by gel extraction using MinElute Gel extraction kit (Cat 28606, Qiagen). Furthermore, the integrity and size distribution of digested fragments were determined using the microfluidics-based platform Bioanalyzer (Agilent) prior to DNA sequencing.
Libraries of nucleosome fragments were prepared and adapted for deep sequencing using the standard Illumina protocol and sequenced them on NextSeq using NextSeq High V2 chemistry and set up as 1x76bp single end run. The Illumina Run Time Analysis (RTA 2.4.6) software was used for processing image files, the Illumina Bcl2fastq 2.17 was used for demultiplex and converting binary base calls and qualities to FASTQ format. The sequencing reads were trimmed (adapters and low-quality bases) using Trimmomatic (version 0.30), and the trimmed reads were aligned to mouse genome (MM9, NCBI Build 37) using Bowtie2 software. The mapping and QC statistics were calculated using Bam tools and Picard.
Western blot analysis
Cells were treated with lysis buffer containing 150 mM NaCl, 50 mM Tris-HCl, pH 7.5, 0.5% Triton X-100 (v/v) and a protease-inhibitor cocktail (Roche). The lysates were loaded onto 10% acrylamide/bis gel and transferred to a PVDF membrane after electrophoresis. Following blocking with 5% nonfat milk for 1 h, membranes were incubated at 4°C overnight with primary antibodies: Lsh (rabbit-polyclonal) [Citation66]; Actin (Sigma, A2228); Foxa2 (Santa Cruz, sc-20692x); HNF4a (Santa Cruz, sc-8987x). After incubation with HRP-conjugated secondary antibodies for 1 h at room temperature, the ECL western blotting analysis system was used for protein detection.
Immunofluorescence staining
Cells were briefly washed three times in PBS and fixed in 4% paraformaldehyde (Sigma) in PBS solution for 25–30 min at room temperature. After that cells were permeabilized with PBS, 1% BSA, 0.2% Triton X-100 for 15 min, washed twice, blocked in 1% BSA (30 min) and incubated with the indicated antibody solution at 4°C overnight. Slides were subsequently washed three times in 1% BSA -PBS and incubated with Alexa fluorophore–conjugated secondary antibodies (Invitrogen) for 1 h at room temperature in the dark and washed three times. Finally, the slides were stained with DAPI and imaged by confocal microscopy. The following antibodies were used: Flag, M2 (sigma, F1804); Lsh (rabbit-polyclonal) [Citation66]; HNF4a (Santa Cruz, sc-8987x).
ChIP-qPCR assays
ChIP (chromatin immunoprecipitation) assays were carried out as described [Citation20]. Briefly, cells were cross-linked with 1% formaldehyde, lysed, and sonicated on ice to generate DNA fragments with an average length of 200–800 bp. Immunoprecipitation was performed using specific antibodies against the indicated proteins or IgG as control. After reversal of cross-linking, DNA was re-suspended in Nuclease-Free water (Invitrogen) for qPCR analysis. PCR conditions: 95°C 5 min; 40 cycles of 95°C 15 s; 60°C 15 s; and 72°C 30 s, followed by a melting curve from 55°C to 95°C. The following antibodies were used: Foxa2 (Santa Cruz, sc-20692x); HNF4a (Santa Cruz, sc-8987x); H3 (Abcam, ab1791); rabbit IgG (Millipore,12370); Rad21 (Abcam, ab992). The normalization method for ChIP analysis is percent of input. In addition, ChIP results represent three independent experiments repeats (mean ± s.d.). The student t-test was used for p-value computation. Primers are listed in supplement Table S1.
DNA methylation analysis
Genomic DNA was extracted using the DNeasy blood & tissue kit (Qiagen). For the bisulfite conversions assay, genomic DNA was subjected to bisulfite treatment using MethylDetector kit (Active Motif). The PCR products were separated in agarose gels, purified, then sub cloned into the T vector. After screening for positive clones by digestion of plasmids with EcoRI, more than 10 clones for each sample were sequenced to identify the methylation status of cytosine. The methylation level was presented as CG methylation ratio (fraction of methylated CpG over total CpG sites). The global DNA methylation status was determined as described [Citation67] using an ELISA assay (5-mC DNA ELISA kit, Zymo Research, Irvine, CA, USA) or liquid chromatography (LC)-Mass spectrometry. The Elisa kit is based on the recognition and quantification of the methylated DNA fraction using a 5-methylcytosine antibody. Percent 5-mC in a DNA sample is quantified from a standard curve generated by methylated/demethylated E. coli DNA. WT and KO MEFs (derived from Lsh+/+ and Lsh-/- embryos) served as control samples. Primers are listed in supplement Table S1.
MNase-seq analysis
Raw sequences were aligned to the murine genome version MM9 using bowtie version Raw sequences were aligned to the murine genome version mm9 using bowtie/2–2.2.5 with the following parameters: export BOWTIE2_INDEXES = /fdb/igenomes/Mus_musculus/UCSC/mm9/Sequence/Bowtie2Index//usr/local/apps/bowtie/2–2.2.5/bin/bowtie2-align-s – wrapper basic-0 -p 16 -x genome – passthrough -U Sample.fq, > Sample.sam. The number of mapped reads is as follows: MEFs derived from Lsh+/+ embryos (WT) 145,386,700; MEFs derived from Lsh-/- embryos (KO) 143,514,905; MEFs without tamoxifen treatment (OHT-0hr) 140,756,627; MEFs with 48 hours of tamoxifen treatment (OHT-48hr) 120,803,925; MEFs without auxin treatment (IAA-0hr) 194,217,013; MEFs with 72 hours of tamoxifen treatment (IAA-72hr) 207,375,474; MEFs without auxin treatment (IAA-0hr-2) 181,006,106; MEFs with 7 hours of tamoxifen treatment (IAA-7hr) 168,243,140. For read density profiles normalized reads were aligned in a 4-kb window around the center of the feature of interest. For bar graphs read density is represented as mean number of normalized read density with a 400bp window around the genomic feature of interest (200bp upstream and 200bp downstream). DNase I hypersensitivity sites, H3K4me modified and transcription factor occupied sites are downloaded from Encode mm9 tracks (http://hgdownload.cse.ucsc.edu/goldenPath/mm9/database) and notes can be downloaded from UCSC/ENCODE (https://genome.ucsc.edu/encode/FAQ/). Reads with a SAM Mapping Quality field less than 5 were removed to avoid analyzing highly repeated genome regions. To avoid confounding effects of MNase-seq generated DNA signals due to technical variations, we compared only datasets that were prepared under the same conditions, but simultaneously generated and sequenced. Wilcoxon signed rank test with continuity correction was performed using R package. To identify changes in chromatin configuration we applied the software ‘danpos2’ [Citation45,Citation46] with the ‘dtriple’ program. Dtriple is a bundle of three functions including Dpos, Dpeak, and Dregion to analyze chromatin protein enrichment at three resolutions (https://sites.google.com/site/danposdoc/tutorial/dtriple). Danpos dtriple was used with default settings. We performed the following comparisons: MEF WT versus MEF KO; OHT-0h versus OHT-48h; IAA-0h versus IAA-7h. Output were generated in separate ‘*peaks.integrative.xls’ flat files. The 2 fields local_gain_FDR (i.e., ‘up’) and local_loss_FDR (i.e., ‘down’) are filtered for 2 FDR value cutoffs 0.05. The intersection of the 3 case control experiments was generated using the bedops program [Citation68] with the ‘bedmap’ parameter (http://bioinformatics.oxfordjournals.org/content/28/14/1919.abstract). The resulting common peaks were analyzed using the Homer motif discovery program ‘findMotifsGenome.pl’ program [Citation69]. BAM files were converted to Wiggle Track Format (WIG) coverage files and entire genomes were all quantile normalized via a custom program using large memory nodes at the NIH High-Performance Computing Group. DANPOS2 was also used to assign regions to genes. The data has been submitted as a new GEO record GSE103043.
Supplemental Material
Download PDF (1.8 MB)Acknowledgments
We thank Karen Saylor, Can Wang, Iasiah Yim and Sarah Anstett for excellent technical assistance. We thank Dr David Clark and members of the MCGP for critical discussions, and Dr Myles Poulin for editing of the manuscript. We give a special thank you for Dr Pamela Hoodless who provided us with a list of genomic locations of HNF4a binding sites.
NCI-Frederick is accredited by AAALAC International and follows the Public Health Service Policy for the Care and Use of Laboratory Animals. Animal care was provided in accordance with the procedures outlined in the “Guide for Care and Use of Laboratory Animals (National Research Council; 1996; National Academy Press; Washington, DC).
Disclosure statement
No potential conflict of interest was reported by the authors.
Supplementary material
Supplemental data for this article can be accessed here.
Additional information
Funding
Related Research Data
References
- Chen A, Chen D, Chen Y. Advances of DNase-seq for mapping active gene regulatory elements across the genome in animals. Gene. 2018;667:83–94. Epub 2018/05/18. PubMed PMID: 29772251.
- Euskirchen G, Auerbach RK, Snyder M. SWI/SNF chromatin-remodeling factors: multiscale analyses and diverse functions. J Biol Chem. 2012;287(37):30897–30905. Epub 2012/ 09/07. PubMed PMID: 22952240; PubMed Central PMCID: PMCPMC3438922.
- Gerstein MB, Kundaje A, Hariharan M, et al. Architecture of the human regulatory network derived from ENCODE data. Nature. 2012;489(7414):91–100. Epub 2012/ 09/08. PubMed PMID: 22955619; PubMed Central PMCID: PMCPMC4154057.
- Luger K, Dechassa ML, Tremethick DJ. New insights into nucleosome and chromatin structure: an ordered state or a disordered affair? Nat Rev Mol Cell Biol. 2012;13(7):436–447. Epub 2012/ 06/23. PubMed PMID: 22722606; PubMed Central PMCID: PMCPMC3408961.
- Swygert SG, Peterson CL. Chromatin dynamics: interplay between remodeling enzymes and histone modifications. Biochim Biophys Acta. 2014;1839(8):728–736. Epub 2014/ 03/04. PubMed PMID: 24583555; PubMed Central PMCID: PMCPMC4099280.
- Venkatesh S, Workman JL. Histone exchange, chromatin structure and the regulation of transcription. Nat Rev Mol Cell Biol. 2015;16(3):178–189. Epub 2015/02/05. PubMed PMID: 25650798.
- Geiman TM, Durum SK, Muegge K. Characterization of gene expression, genomic structure, and chromosomal localization of Hells (Lsh). Genomics. 1998;54(3):477–483. Epub 1999/ 01/08. PubMed PMID: 9878251.
- Jarvis CD, Geiman T, Vila-Storm MP, et al. A novel putative helicase produced in early murine lymphocytes. Gene. 1996;169(2):203–207. Epub 1996/03/09. PubMed PMID: 8647447.
- Thijssen PE, Ito Y, Grillo G, et al. Mutations in CDCA7 and HELLS cause immunodeficiency-centromeric instability-facial anomalies syndrome. Nat Commun. 2015;6:7870. Epub 2015/07/29. PubMed PMID: 26216346; PubMed Central PMCID: PMCPMC4519989.
- Fan T, Schmidtmann A, Xi S, et al. DNA hypomethylation caused by Lsh deletion promotes erythroleukemia development. Epigenetics. 2008;3(3):134–142. Epub 2008/ 05/20.PubMed PMID: 18487951; PubMed Central PMCID: PMCPMC3113485.
- Geiman TM, Muegge K. Lsh, an SNF2/helicase family member, is required for proliferation of mature T lymphocytes. Proc Natl Acad Sci U S A. 2000;97(9):4772–4777. Epub 2000/04/26. PubMed PMID: 10781083; PubMed Central PMCID: PMCPMC18308.
- Geiman TM, Tessarollo L, Anver MR, et al. Lsh, a SNF2 family member, is required for normal murine development. Biochim Biophys Acta. 2001;1526(2):211–220. Epub 2001/ 04/28.PubMed PMID: 11325543.
- Han Y, Ren J, Lee E, et al. Lsh/HELLS regulates self-renewal/proliferation of neural stem/progenitor cells. Sci Rep. 2017;7(1):1136. Epub 2017/04/27. PubMed PMID: 28442710; PubMed Central PMCID: PMCPMC5430779.
- Sun LQ, Lee DW, Zhang Q, et al. Growth retardation and premature aging phenotypes in mice with disruption of the SNF2-like gene, PASG. Genes Dev. 2004;18(9):1035–1046. Epub 2004/04/24. PubMed PMID: 15105378; PubMed Central PMCID: PMCPMC406293.
- Zeng W, Baumann C, Schmidtmann A, et al. Lymphoid-specific helicase (HELLS) is essential for meiotic progression in mouse spermatocytes. Biol Reprod. 2011;84(6):1235–1241. Epub 2011/ 02/26. PubMed PMID: 21349825; PubMed Central PMCID: PMCPMC3099587.
- Lungu C, Muegge K, Jeltsch A, et al. An ATPase-deficient variant of the SNF2 family member HELLS shows altered dynamics at pericentromeric heterochromatin. J Mol Biol. 2015;427(10):1903–1915. Epub 2015/04/01. PubMed PMID: 25823553.
- Dennis K, Fan T, Geiman T, et al. Lsh, a member of the SNF2 family, is required for genome-wide methylation. Genes Dev. 2001;15(22):2940–2944. Epub 2001/11/17. PubMed PMID: 11711429; PubMed Central PMCID: PMCPMC312825.
- Dunican DS, Cruickshanks HA, Suzuki M, et al. Lsh regulates LTR retrotransposon repression independently of Dnmt3b function. Genome Biol. 2013;14(12):R146. Epub 2013/12/26. PubMed PMID: 24367978; PubMed Central PMCID: PMCPMC4054100.
- Myant K, Termanis A, Sundaram AY, et al. LSH and G9a/GLP complex are required for developmentally programmed DNA methylation. Genome Res. 2011;21(1):83–94. Epub 2010/ 12/15. PubMed PMID: 21149390; PubMed Central PMCID: PMCPMC3012929.
- Ren J, Briones V, Barbour S, et al. The ATP binding site of the chromatin remodeling homolog Lsh is required for nucleosome density and de novo DNA methylation at repeat sequences. Nucleic Acids Res. 2015;43(3):1444–1455. Epub 2015/01/13. PubMed PMID: 25578963; PubMed Central PMCID: PMCPMC4330352.
- Tao Y, Xi S, Shan J, et al. Lsh, chromatin remodeling family member, modulates genome-wide cytosine methylation patterns at nonrepeat sequences. Proc Natl Acad Sci U S A. 2011;108(14):5626–5631. Epub 2011/03/24. PubMed PMID: 21427231; PubMed Central PMCID: PMCPMC3078362.
- Xi S, Geiman TM, Briones V, et al. Lsh participates in DNA methylation and silencing of stem cell genes. Stem Cells. 2009;27(11):2691–2702. Epub 2009/08/04. PubMed PMID: 19650037; PubMed Central PMCID: PMCPMC3327128.
- Yu W, Briones V, Lister R, et al. CG hypomethylation in Lsh-/- mouse embryonic fibroblasts is associated with de novo H3K4me1 formation and altered cellular plasticity. Proc Natl Acad Sci U S A. 2014;111(16):5890–5895. Epub 2014/04/09. PubMed PMID: 24711395; PubMed Central PMCID: PMCPMC4000807.
- Zhu H, Geiman TM, Xi S, et al. Lsh is involved in de novo methylation of DNA. Embo J. 2006;25(2):335–345. Epub 2006/01/06. PubMed PMID: 16395332; PubMed Central PMCID: PMCPMC1383509.
- Huang J, Fan T, Yan Q, et al. Lsh, an epigenetic guardian of repetitive elements. Nucleic Acids Res. 2004;32(17):5019–5028. Epub 2004/09/28. PubMed PMID: 15448183; PubMed Central PMCID: PMCPMC521642.
- Yu W, McIntosh C, Lister R, et al. Genome-wide DNA methylation patterns in LSH mutant reveals de-repression of repeat elements and redundant epigenetic silencing pathways. Genome Res. 2014;24(10):1613–1623. Epub 2014/08/30. PubMed PMID: 25170028; PubMed Central PMCID: PMCPMC4199375.
- Lyons DB, Zilberman D. DDM1 and Lsh remodelers allow methylation of DNA wrapped in nucleosomes. Elife. 2017;6. Epub 2017/11/16. PubMed PMID: 29140247; PubMed Central PMCID: PMCPMC5728721. DOI:10.7554/eLife.30674
- Jenness C, Giunta S, Muller MM, et al. HELLS and CDCA7 comprise a bipartite nucleosome remodeling complex defective in ICF syndrome. Proc Natl Acad Sci U S A. 2018;115(5):E876–E85. Epub 2018/01/18. PubMed PMID: 29339483; PubMed Central PMCID: PMCPMC5798369.
- Dennis JH, Fan HY, Reynolds SM, et al. Independent and complementary methods for large-scale structural analysis of mammalian chromatin. Genome Res. 2007;17(6):928–939. Epub 2007/06/15. PubMed PMID: 17568008; PubMed Central PMCID: PMCPMC1891351.
- Kharchenko PV, Woo CJ, Tolstorukov MY, et al. Nucleosome positioning in human HOX gene clusters. Genome Res. 2008;18(10):1554–1561. Epub 2008/08/30. PubMed PMID: 18723689; PubMed Central PMCID: PMCPMC2556261.
- Schones DE, Cui K, Cuddapah S, et al. Dynamic regulation of nucleosome positioning in the human genome. Cell. 2008;132(5):887–898. Epub 2008/03/11. PubMed PMID: 18329373.
- Segal E, Fondufe-Mittendorf Y, Chen L, et al. A genomic code for nucleosome positioning. Nature. 2006;442(7104):772–778. Epub 2006/07/25. PubMed PMID: 16862119; PubMed Central PMCID: PMCPMC2623244.
- Woo CJ, Kharchenko PV, Daheron L, et al. A region of the human HOXD cluster that confers polycomb-group responsiveness. Cell. 2010;140(1):99–110. Epub 2010/01/21. PubMed PMID: 20085705; PubMed Central PMCID: PMCPMC3324942.
- Yuan GC, Liu YJ, Dion MF, et al. Genome-scale identification of nucleosome positions in S. cerevisiae. Science. 2005;309(5734):626–630. Epub 2005/ 06/18. PubMed PMID: 15961632.
- Henikoff S, Henikoff JG, Sakai A, et al. Genome-wide profiling of salt fractions maps physical properties of chromatin. Genome Res. 2009;19(3):460–469. Epub 2008/ 12/18. PubMed PMID: 19088306; PubMed Central PMCID: PMCPMC2661814.
- Li Z, Schug J, Tuteja G, et al. The nucleosome map of the mammalian liver. Nat Struct Mol Biol. 2011;18(6):742–746. Epub 2011/05/31. PubMed PMID: 21623366; PubMed Central PMCID: PMCPMC3148658.
- Valouev A, Johnson SM, Boyd SD, et al. Determinants of nucleosome organization in primary human cells. Nature. 2011;474(7352):516–520. Epub 2011/ 05/24. PubMed PMID: 21602827; PubMed Central PMCID: PMCPMC3212987.
- Collings CK, Waddell PJ, Anderson JN. Effects of DNA methylation on nucleosome stability. Nucleic Acids Res. 2013;41(5):2918–2931. Epub 2013/01/29. PubMed PMID: 23355616; PubMed Central PMCID: PMCPMC3597673.
- Gowher H, Stockdale CJ, Goyal R, et al. De novo methylation of nucleosomal DNA by the mammalian Dnmt1 and Dnmt3A DNA methyltransferases. Biochemistry. 2005;44(29):9899–9904. Epub 2005/07/20. PubMed PMID: 16026162.
- Huff JT, Zilberman D. Dnmt1-independent CG methylation contributes to nucleosome positioning in diverse eukaryotes. Cell. 2014;156(6):1286–1297. Epub 2014/03/19. PubMed PMID: 24630728; PubMed Central PMCID: PMCPMC3969382.
- Jimenez-Useche I, Ke J, Tian Y, et al. DNA methylation regulated nucleosome dynamics. Sci Rep. 2013;3:2121. Epub 2013/07/03. PubMed PMID: 23817195; PubMed Central PMCID: PMCPMC3698496.
- Robertson AK, Geiman TM, Sankpal UT, et al. Effects of chromatin structure on the enzymatic and DNA binding functions of DNA methyltransferases DNMT1 and Dnmt3a in vitro. Biochem Biophys Res Commun. 2004;322(1):110–118. Epub 2004/08/18. PubMed PMID: 15313181.
- Nishimura K, Fukagawa T, Takisawa H, et al. An auxin-based degron system for the rapid depletion of proteins in nonplant cells. Nat Methods. 2009;6(12):917–922. Epub 2009/11/17. PubMed PMID: 19915560.
- Termanis A, Torrea N, Culley J, et al. The SNF2 family ATPase LSH promotes cell-autonomous de novo DNA methylation in somatic cells. Nucleic Acids Res. 2016;44(16):7592–7604. Epub 2016/05/15. PubMed PMID: 27179028; PubMed Central PMCID: PMCPMC5027476.
- Chen K, Chen Z, Wu D, et al. Broad H3K4me3 is associated with increased transcription elongation and enhancer activity at tumor-suppressor genes. Nat Genet. 2015;47(10):1149–1157. Epub 2015/08/25. PubMed PMID: 26301496; PubMed Central PMCID: PMCPMC4780747.
- Chen K, Xi Y, Pan X, et al. DANPOS: dynamic analysis of nucleosome position and occupancy by sequencing. Genome Res. 2013;23(2):341–351. Epub 2012/11/30. PubMed PMID: 23193179; PubMed Central PMCID: PMCPMC3561875.
- Alder O, Cullum R, Lee S, et al. Hippo signaling influences HNF4A and FOXA2 enhancer switching during hepatocyte differentiation. Cell Rep. 2014;9(1):261–271. Epub 2014/09/30. PubMed PMID: 25263553; PubMed Central PMCID: PMCPMC4612615.
- Friedman JR, Kaestner KH. The Foxa family of transcription factors in development and metabolism. Cell Mol Life Sci. 2006;63(19–20):2317–2328. Epub 2006/08/16. PubMed PMID: 16909212.
- Li J, Ning G, Duncan SA. Mammalian hepatocyte differentiation requires the transcription factor HNF-4alpha. Genes Dev. 2000;14(4):464–474. Epub 2000/02/26. PubMed PMID: 10691738; PubMed Central PMCID: PMCPMC316377.
- Taub R, Greenbaum LE, Peng Y. Transcriptional regulatory signals define cytokine-dependent and -independent pathways in liver regeneration. Semin Liver Dis. 1999;19(2):117–127. Epub 1999/07/28. PubMed PMID: 10422195.
- Iwafuchi-Doi M, Donahue G, Kakumanu A, et al. The pioneer transcription factor foxa maintains an accessible nucleosome configuration at enhancers for tissue-specific gene activation. Mol Cell. 2016;62(1):79–91. Epub 2016/04/09. PubMed PMID: 27058788; PubMed Central PMCID: PMCPMC4826471.
- Chen P, Zhao J, Wang Y, et al. H3.3 actively marks enhancers and primes gene transcription via opening higher-ordered chromatin. Genes Dev. 2013;27(19):2109–2124. Epub 2013/09/26. PubMed PMID: 24065740; PubMed Central PMCID: PMCPMC3850095.
- Ren J, Hathaway NA, Crabtree GR, et al. Tethering of Lsh at the Oct4 locus promotes gene repression associated with epigenetic changes. Epigenetics. 2018;13(2):173–181. Epub 2017/ 06/18. PubMed PMID: 28621576; PubMed Central PMCID: PMCPMC5873361.
- Dingwall C, Lomonossoff GP, Laskey RA. High sequence specificity of micrococcal nuclease. Nucleic Acids Res. 1981;9(12):2659–2673. Epub 1981/06/25. PubMed PMID: 6269057; PubMed Central PMCID: PMCPMC326883.
- Hu G, Schones DE, Cui K, et al. Regulation of nucleosome landscape and transcription factor targeting at tissue-specific enhancers by BRG1. Genome Res. 2011;21(10):1650–1658. Epub 2011/07/29. PubMed PMID: 21795385; PubMed Central PMCID: PMCPMC3202282.
- Mizuguchi G, Shen X, Landry J, et al. ATP-driven exchange of histone H2AZ variant catalyzed by SWR1 chromatin remodeling complex. Science. 2004;303(5656):343–348. Epub 2003/ 12/03. PubMed PMID: 14645854.
- Papamichos-Chronakis M, Watanabe S, Rando OJ, et al. Global regulation of H2A.Z localization by the INO80 chromatin-remodeling enzyme is essential for genome integrity. Cell. 2011;144(2):200–213. Epub 2011/01/19. PubMed PMID: 21241891; PubMed Central PMCID: PMCPMC3035940.
- von Eyss B, Maaskola J, Memczak S, et al. The SNF2-like helicase HELLS mediates E2F3-dependent transcription and cellular transformation. Embo J. 2012;31(4):972–985. Epub 2011/ 12/14. PubMed PMID: 22157815; PubMed Central PMCID: PMCPMC3280551.
- Morris SA, Baek S, Sung MH, et al. Overlapping chromatin-remodeling systems collaborate genome wide at dynamic chromatin transitions. Nat Struct Mol Biol. 2014;21(1):73–81. Epub 2013/ 12/10. PubMed PMID: 24317492; PubMed Central PMCID: PMCPMC3947387.
- Ho JW, Jung YL, Liu T, et al. Comparative analysis of metazoan chromatin organization. Nature. 2014;512(7515):449–452. Epub 2014/ 08/29. PubMed PMID: 25164756; PubMed Central PMCID: PMCPMC4227084.
- Pott S, Lieb JD. What are super-enhancers? Nat Genet. 2015;47(1):8–12. Epub 2014/ 12/31. PubMed PMID: 25547603.
- West JA, Cook A, Alver BH, et al. Nucleosomal occupancy changes locally over key regulatory regions during cell differentiation and reprogramming. Nat Commun. 2014;5:4719. Epub 2014/08/28. PubMed PMID: 25158628; PubMed Central PMCID: PMCPMC4217530.
- John S, Sabo PJ, Johnson TA, et al. Interaction of the glucocorticoid receptor with the chromatin landscape. Mol Cell. 2008;29(5):611–624. Epub 2008/03/18. PubMed PMID: 18342607.
- Ni Z, Bremner R. Brahma-related gene 1-dependent STAT3 recruitment at IL-6-inducible genes. J Immunol. 2007;178(1):345–351. Epub 2006/ 12/22.PubMed PMID: 17182572.
- Cheloufi S, Elling U, Hopfgartner B, et al. The histone chaperone CAF-1 safeguards somatic cell identity. Nature. 2015;528(7581):218–224. Epub 2015/ 12/15. PubMed PMID: 26659182; PubMed Central PMCID: PMCPMC4866648.
- Yan Q, Cho E, Lockett S, et al. Association of Lsh, a regulator of DNA methylation, with pericentromeric heterochromatin is dependent on intact heterochromatin. Mol Cell Biol. 2003;23(23):8416–8428. Epub 2003/11/13. PubMed PMID: 14612388; PubMed Central PMCID: PMCPMC262679.
- Bjanesoy TE, Andreassen BK, Bratland E, et al. Altered DNA methylation profile in Norwegian patients with autoimmune Addison’s disease. Mol Immunol. 2014;59(2):208–216. Epub 2014/03/29. PubMed PMID: 24667071.
- Neph S, Kuehn MS, Reynolds AP, et al. BEDOPS: high-performance genomic feature operations. Bioinformatics. 2012;28(14):1919–1920. Epub 2012/05/12. PubMed PMID: 22576172; PubMed Central PMCID: PMCPMC3389768.
- Heinz S, Benner C, Spann N, et al. Simple combinations of lineage-determining transcription factors prime cis-regulatory elements required for macrophage and B cell identities. Mol Cell. 2010;38(4):576–589. Epub 2010/06/02. PubMed PMID: 20513432; PubMed Central PMCID: PMCPMC2898526.