
ABSTRACT
Patients with paediatric-onset systemic lupus erythematosus (SLE) often present with more severe clinical courses than adult-onset patients. Although genome-wide DNA methylation (DNAm) profiling has been performed in adult-onset SLE patients, parallel data on paediatric-onset SLE are not available. Therefore, we undertook a genome-wide DNAm study in paediatric-onset SLE patients across multiple blood cell lineages. The DNAm profiles of four purified immune cell lineages (CD4 + T cells, CD8 + T cells, B cells and neutrophils) and whole blood were compared in 16 Chinese patients with paediatric-onset SLE and 13 healthy controls using the Illumina HumanMethylationEPIC BeadChip. Comparison of DNAm in whole blood and within each independent cell lineage identified a consistent pattern of loss of DNAm at 21 CpG sites overlapping 15 genes, which represented a robust, disease-specific DNAm signature for paediatric-onset SLE in our cohort. In addition, cell lineage-specific changes, involving both loss and gain of DNAm, were observed in both novel genes and genes with well-described roles in SLE pathogenesis. This study also highlights the importance of studying DNAm changes in different immune cell lineages rather than only whole blood, since cell type-specific DNAm changes facilitated the elucidation of the cell type-specific molecular pathophysiology of SLE.
Introduction
Systemic lupus erythematosus (SLE; OMIM 152700) is characterized by chronic inflammation, autoantibody production and the presence of auto-reactive immune cells affecting multiple organs [Citation1]. Paediatric-onset SLE (pSLE) is uncommon, representing only approximately 10% of the SLE population [Citation2–Citation4]. The prevalence of pSLE is approximately 33 to 88 per million children, with a higher prevalence in Africans and Asians [Citation5]. The median age of diagnosis for patients with pSLE is consistently reported to be 11 to 12 y of age [Citation5–Citation7]. Compared with adult-onset patients, those with pSLE have a higher involvement of cardiopulmonary, musculoskeletal, ocular, renal and neuropsychiatric systems [Citation5,Citation8]. Patients with pSLE also exhibit higher disease activity and more frequent use of immunosuppressants [Citation9]. Diagnosing SLE in children can be more difficult because of the broad range of disease presentations in children and SLE is rarer in children [Citation10]. Previous genome-wide DNAm studies using the Illumina HumanMethylation450 BeadChip have been performed on patients with classical, adult-onset SLE [Citation11–Citation17], SLE patients with renal involvement or lupus nephritis [Citation18–Citation20], patients with autoantibodies [Citation21], and patients with different SLE disease activity index (SLEDAI) [Citation22]. However, no genome-wide DNAm profiling has been performed in patients with pSLE.
Compared with other tissues, blood is much easier to obtain and is therefore commonly used for epigenetic studies. However, blood is a heterogeneous collection of different types of immune cell populations that show considerable DNAm variation across different lineages [Citation23–Citation27]. As a result, the DNAm level of a particular CpG site measured in whole blood represents the overall DNAm level across many different immune lineages. Moreover, the proportions of different cell types can vary across individuals, especially in certain disease states, particularly autoimmune diseases. As a result, cell heterogeneity can be a potentially important confounding factor for whole-blood DNAm measurements. Multiple algorithms have been developed to adjust for the contribution of DNAm variation when analysing whole blood. However, no particular algorithm has demonstrated outstanding performance [Citation28,Citation29]. In addition, cell type-specific DNAm cannot be identified by statistical adjustment. Cell sorting remains the only reliable method to study cell lineage-specific DNAm.
Since DNAm changes in pSLE remain unknown and because cell type-specific DNAm changes cannot be reliably identified in whole blood, we investigated the DNAm changes in pSLE in a lineage-specific manner (CD4 + T cells, CD8 + T cells, CD19 + B cells and CD16+ neutrophils). The latest version of Illumina’s DNAm microarray, the MethylationEPIC BeadChip (EPIC microarray), was used in this study and for the first time in any SLE DNAm studies. Our results show that a set of 21 CpG sites were commonly hypomethylated in the four purified lineages, representing a pSLE-specific DNAm signature. In addition, we identified some genes with lineage-specific DNAm changes, supporting the importance of studying DNAm changes in purified lineages to optimally define DNAm changes in specific disease states.
Results
Patient selection for the DNAm microarray
Sixteen patients with pSLE (14 female and 2 male) and 13 controls (all female) were selected for genome-wide DNAm analysis (Supplementary Tables 1 and ). Four purified lineages (purity>90%) and whole blood were assessed for all participants (n = 29, a total of 145 samples) using the EPIC microarray. The purities of the four lineages ranged from 95.8%±2.1% for CD4 + T cells to 99.2%±0.8% for neutrophils (Supplementary Table 3). At the time of recruitment, the median age of patients with pSLE and healthy controls was 19 (range: 12–57) years and 24 (range: 17–61) years, respectively. The median age of SLE onset was 11.5 (range: 6–17) years, which was comparable to that reported in the literature.
Table 1. Summary of differentially methylated CpG sites in whole blood and different cell types.
Table 2. pSLE-specific DNAm signature.
DNAm is driven by cell composition
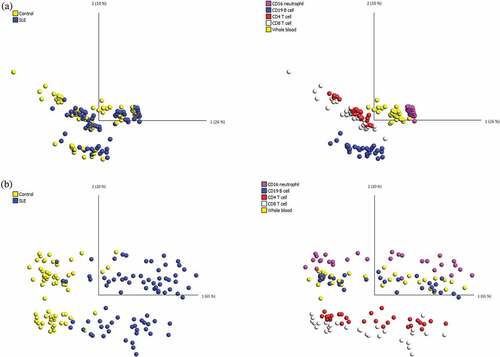
After filtering for non-specific probes and probes with missing values or with detection p-values>0.05, a total of 91,556 probes were removed, and the final data set contained 775,280 probes. Using all remaining probes, the PCA showed that samples were clustered according to cell type, as expected ()). This result confirmed previous findings that the DNA methylome demonstrates considerable variation across different types of immune cell lineages [Citation23–Citation27]. Specifically, DNAm profiles of CD4 + T cells and CD8 + T cells were more similar to each other, as these are both T cell lineages, and the DNAm profiles of whole blood and CD16+ neutrophils were more similar to each other, presumably because neutrophils are the most abundant type of leukocytes in blood. The result also revealed that the effect of cell composition was greater than that of the SLE manifestation on the raw DNAm data.
Figure 1. PCA of the DNA methylation dataset in all 145 samples.
Identification of differentially methylated CpG sites (pSLE vs. controls) in each cell lineage and whole blood
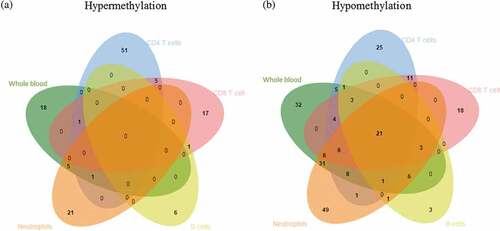
Using the Wilcoxon rank-sum test, differentially methylated CpG sites were identified in each cell type by comparing the lineage-specific DNAm data of pSLE patients and controls. The number of probes that remained after the FDR control at q-values<0.05 ranged from lowest in B cells (n = 314) to highest in whole blood (n = 66588). An additional effect-size filter was applied to select a statistically significant set of probes with a > 10 percentage point difference in average DNAm levels between pSLE patients and controls. After effect-size filtering, the number of probes remaining ranged from lowest in B cells (n = 46) to highest in neutrophils (n = 160), and more CpG sites showed hypomethylation than hypermethylation (, Supplementary Table 4). Analysis of the genomic locations of the differentially methylated CpG sites showed that the CpG sites were over-represented in the promoter region, i.e., 5’UTR, in all cell lineages (Supplementary Table 5).
We next examined the effect of the differentially methylated CpG sites identified in each lineage using PCA and unsupervised hierarchical clustering. In general, PCA revealed that pSLE patients clustered as a distinct group separate from controls, and two subgroups existed within the patients (Supplementary Figure 1). The two pSLE subgroups can also be demonstrated by unsupervised hierarchical clustering. These two subgroups of SLE patients were distinguished by hypomethylated CpG sites (Supplementary Figure 2). A number of parameters have been tested for the two SLE subgroups, including age of SLE onset, age at the time of patient recruitment, disease duration, and other clinical information at the time of DNA sampling, such as SLEDAI, low complement level and presence of anti-double stranded DNA. We found that the SLE subgroup with milder DNAm loss exhibited lower SLEDAI in both CD4 + T cells and CD8 + T cells (unpaired t-test, p = 0.044 in both T cell lineages, Supplementary Figure 1), but this association was not apparent in other specific lineages or in whole blood. Because of the small sample size, further studies should be performed in a larger cohort of patients to confirm the correlation.
Figure 2. Venn diagram showing differentially methylated CpG sites across different cell lineages.
Finally, gene ontology analysis was performed using GeneMANIA. Genes that overlapped the differentially hypomethylated CpG sites were enriched in the interferon signalling pathway (), consistent with previous studies of SLE [Citation11–Citation16,Citation20]. However, unlike previous studies using the 450k microarray that were unable to identify significant pathways in hypermethylated genes, we identified enrichment of the T cell receptor signalling pathway in CD4 + T cells, as well as the type I interferon signalling pathway in whole blood, CD8 + T cells and neutrophils (, Supplementary Table 6). The novel identification of pathway enrichments in hypermethylated genes may be specific to pSLE patients or to the utilization of the latest EPIC microarray.
A pSLE-specific DNAm signature
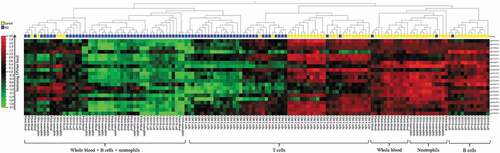
We then investigated the common differential DNAm changes in the four cell lineages, by examining the degree of overlap between the differentially methylated CpG sites in each cell lineage (Supplementary Table 5). We identified 21 CpG sites that showed differential loss of DNAm across the four purified lineages, and these differential changes can also be found in whole blood (, ). The 21 differentially hypomethylated CpG sites overlapped 15 genes, and clearly distinguished pSLE patients from healthy individuals. Therefore, we refer these 21 CpG sites to as a pSLE-specific DNAm signature. PCA and unsupervised hierarchical clustering of the pSLE-specific DNAm signature on all 145 samples revealed that samples can be separated based on case-control and cell lineages () and ). To determine the significance of the cell composition effect on the pSLE-specific DNAm signature, the Friedman test was used for multiple group comparisons using pSLE patients DNAm data, and p-value<0.002 was considered as statistically significant (Bonferroni-adjusted for 21 tests and α = 0.05). Twenty of the 21 CpG sites showed significant differences across lineages and whole blood (the mean rank of each cell type and test statistics can be found in Supplementary Table 7). The Friedman test indicated that the pSLE-specific DNAm signature is also partially affected by cell composition.
Figure 3. Heatmap of the pSLE-specific DNAm signature.
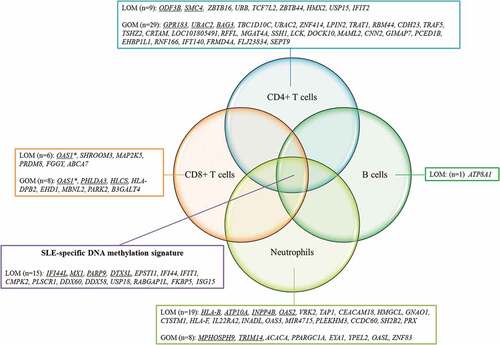
Lineage-specific differentially methylated genes
We also observed a subset of probes that were uniquely present in pSLE in a cell lineage-specific manner ( and ). The genes that found to be differentially methylated in just one cell lineage are referred to as lineage-specific differentially methylated genes. The number of lineage-specific differentially methylated genes ranged from lowest in B cells (n = 1) to highest in CD4 + T cells (n = 38). Some of these lineage-specific genes have previously been reported in association with SLE (Supplementary Table 8). For example, the hypermethylated gene LCK, identified in CD4 + T cells, demonstrated reduced expression in T cells of SLE patients, and the level of reduction was associated with disease activity [Citation30,Citation31]. The hypomethylated genes OAS1 and OAS2, identified in CD8 + T cells and neutrophils, respectively, were upregulated in the peripheral blood of SLE patients [Citation32]. On the other hand, some of the cell lineage-specific genes have never been reported in SLE. For example, the hypermethylated gene TART1 has never been reported in SLE, yet interestingly, it is involved in T cell receptor signalling [Citation33]. These cell lineage-specific changes could not be reflected in whole blood, indicating the importance of performing DNAm studies on purified lineages.
Figure 4. Lineage-specific DNAm changes in pSLE patients.
Discussion
In this study, DNAm changes in patients with pSLE were compared to those in healthy controls using the EPIC microarray. In contrast to previous genome-wide DNAm studies on SLE, the experimental design of the current study differed in three important ways. First, we investigated DNAm changes in four major purified immune cell lineages and whole blood in the same cohort of patients and controls. This approach allows direct comparison of differentially methylated genes across different lineages and the identification of lineage-specific differentially methylated genes. Second, DNAm profiling was performed in patients with pSLE, which has never been performed in a genome-wide manner. Patients with pSLE are rare and, compared with adult-onset SLE, have a more severe clinical presentation and different patterns of organ involvement [Citation5,Citation8]. Therefore, the results of this study provide insights into the pathogenesis of pSLE. Third, we used the latest Illumina microarray to measure DNAm levels, allowing us to include an exploration of other regulatory regions such as enhancers and open chromatins. Consistent with previous studies using the 450k microarray, most of the differentially methylated CpG sites we identified were located either in the promoter or the body of the genes.
The results of the current study have four important implications. First, we identified a pSLE-specific DNAm signature comprising 21 CpG sites that show differential loss of DNAm across the major immune cell lineages of pSLE patients. Both myeloid lineages (i.e., neutrophils) and lymphoid lineages (i.e., T cells and B cells) showed the same pSLE-specific DNAm signature, suggesting that epigenetic reprogramming of type I interferon-related genes is a widespread phenomenon in blood cells of pSLE patients, which can occur in haematopoietic stem cells. While the time point at which the reprogramming occurs is unknown, hypomethylation of type I interferon-related genes may predispose the gene to increased responsiveness to stimulation (i.e., increase their readiness for expression). Another possibility is that such hypomethylation increases the baseline expression of certain type I interferon-related genes, since meta-analysis revealed that some of these genes (MX1, IFIT1, PLSCR1 and IFI44) had higher expression in SLE patients than in healthy individuals [Citation32].
Second, while the pSLE-specific DNAm signature showed significant differences between pSLE patients and healthy controls, it also showed milder yet significant differences across immune cell lineages. This implies that the disease-specific DNAm signature can still be confounded by cell composition. Since blood is commonly used as a source of DNA for epigenome-wide association studies, our results imply that the differentially methylated CpG sites identified should be examined carefully using our approach to simultaneously evaluate whole blood and different lineages in order to ensure that cell composition is not the primary source of variation for the differential changes. This strategy is particularly important in studying autoimmune diseases or when the differentially methylated genes identified are immune-related.
Third, we identified a subset of lineage-specific differentially methylated genes, indicating that some of the dysregulation is specific to a particular cell lineage and hence affects normal function for that specific cell type. For example, hypermethylated genes in helper T cells were found to be enriched in pathways such as T cell receptor signalling, suggesting the dysregulation of this pathway in pSLE patients, which may affect helper T cell function in adaptive immunity. In this study, we also identified some cell lineage-specific DNAm changes that potentially pinpoint the cell type that contributes to gene expressions changes in pSLE. Meta-analysis showed that interferon-regulated genes such as MX1, IFI44, IFIT1, PLSCR1, LY6E, LGALS9, OAS1 and OAS2 were upregulated in the peripheral blood of SLE patients [Citation32]. The DNAm data showed that MX1, IFI44, IFIT1 and PLSCR1 were hypomethylated in the four purified lineages, suggesting that each lineage contributed to the increased expression of these genes. However, some genes showed hypomethylation only in specific lineages. For example, LY6E was hypomethylated in helper T cells, cytotoxic T cells and neutrophils but not in B cells; LGALS9 was T cell-specific, with hypomethylation only detected in helper T cells and cytotoxic T cells. Although OAS1 and OAS2 belong to the same family of the enzyme synthetase, OAS1 was hypomethylated only in cytotoxic T cells, whereas OAS2 hypomethylation was only detected in neutrophils. DNAm studies should therefore be performed in specific lineages rather than in whole blood, especially for diseases that affect the immune system.
Lastly, significant overlap was observed between hypomethylated genes in patients with pSLE and other SLE subgroups, such as adult-onset SLE or patients with lupus nephritis. A number of studies have been performed to investigate the DNAm changes in SLE [Citation11–Citation22]. However, the experimental designs are different in terms of the ethnic group, gender, cell types and comparison groups (Supplementary Table 9). It is therefore difficult to examine the DNAm differences across SLE subgroups or cell lineages. However, numerous studies, including one of ours, all identified type I interferon-related genes (e.g., MX1, IFI44L, PARP9 and DTX3L) as the most significant hypomethylated genes that distinguish SLE patients and controls [Citation11–Citation14,Citation16,Citation17,Citation20]. These studies suggest that the hypomethylation of interferon-related genes is highly robust in SLE and is common in SLE regardless of age of disease onset, ethnicity or gender. As a result, DNAm may potentially be used as one of the diagnostic biomarkers for SLE. In fact, Zhao et al. showed that IFI44L promoter DNAm in whole blood has a high specificity and sensitivity, and can distinguish SLE from healthy controls and other autoimmune diseases [Citation34]. Nevertheless, it is necessary to carry out additional studies in newly diagnosed SLE patients, so as to confirm the possibility of using DNAm as one of the diagnostic biomarkers for SLE.
This study has several limitations. First, the median age of pSLE patients is 19, which implies that more than half of the patients are in their age of adulthood at the time of recruitment. In addition, patients participated in this study have received immunosuppressive treatments of variable doses for a significant period of time. Most of the drugs used in our patients are not known DNA methylation modifiers (except for methotrexate, which is used by one patient); however, the effect can yet to be discovered. Therefore, medications can also be a confounding factor in this study. Ideally, patients recruited should be children who are newly diagnosed with SLE to avoid the confounding effect of age and medications. Second, DNAm analysis was limited to whole blood and four purified lineages only, which included CD4 + T cells, CD8 + T cells, B cells, and neutrophils. Although we included the major immune cell lineages in our DNAm analysis, these cell types can be further divided into sub-classes, while some cell types were completely missing. For example, monocytes and natural killer cells were not included in this study, and T cells can be further divided into memory T cells, regulatory T cells, natural killer T cells and gamma delta T cells. In addition, although all nucleated cells can secret type I interferon, plasmacytoid dendritic cells are professional type I interferon-secreting cells. Therefore, characterization of the genome-wide DNAm of the plasmacytoid dendritic cells may also be relevant [Citation35]. With advances in single-cell sequencing-based technologies, single-cell genome-wide DNAm analysis may soon be possible, thereby providing a better understanding of the molecular pathophysiology of SLE in specific cell lineages.
In conclusion, we identified a pSLE-specific DNAm signature that was commonly found in the major immune cell lineages of patients with pSLE. This pSLE-specific DNAm signature has potential as a diagnostic biomarker for pSLE. This finding is important for paediatric patients because diagnosing SLE in children can be challenging. We also highlighted the importance of studying DNAm changes in a lineage-specific manner, because the disease-specific DNAm signature can be cofounded by cell composition. In addition, studying lineage-specific DNAm changes can facilitate the elucidation of cell type-specific molecular pathophysiology of the disease. Finally, we have deposited the DNAm dataset that consists of whole blood and the four purified lineages in the GEO repository, which can be used for cell-type adjustments for other epigenome-wide association studies involving the use of the EPIC microarray.
Patients and methods
Patient recruitment
In this study, patients with pSLE were recruited regardless of their current age. All patients were younger than 18 y of age at the time of SLE diagnosis. They were all diagnosed using the 1997 American College of Rheumatology Criteria for Classification of SLE. Written consent was obtained from each patient or from their parents if the patient was less than 18 y of age. A total of 30 ml of blood was obtained from each patient. For healthy controls, blood was obtained from the Hong Kong Red Cross. All participants were self-reported to be of Chinese ethnicity. This study was approved by the Institutional Review Board of the University of Hong Kong/Hospital Authority Hong Kong West Cluster (reference number: UW 14–327).
Positive selection of immune cell populations
Four immune cell lineages (CD4 + T cells, CD8 + T cells, CD19 + B cells and CD16+ neutrophils) were sequentially isolated from each participant. Sample processing was initiated within 30 min of the blood draw. Peripheral blood mononuclear cells (PMBCs) were separated from red blood cells and polynuclear cells using Ficoll-Paque PLUS (GE Healthcare, Chicago, USA). Isolated PBMCs were sequentially incubated with anti-CD19, anti-CD8, and anti-CD4 microbeads (Miltenyi Biotec, Bergisch, Germany). Red blood cells and polynuclear cells were separated using 3% dextran (Fisher Scientific, Hampton, USA), as previously reported [Citation36], and neutrophils were subsequently isolated using anti-CD16 microbeads (Miltenyi Biotec, Bergisch, Germany). The purity of each cell lineage was evaluated by flow cytometry. Specific cell lineages were stained with anti-CD4-PE, anti-CD8-FITC, anti-CD20-FITC and anti-CD16-FITC primary antibodies (BioLegend, San Diego, USA), respectively. Immune cells were considered to be a purified lineage when the purity was > 90%. DNA extraction and bisulfite conversion were performed as described previously [Citation14].
DNAm microarray
Sixteen pSLE patients and 13 controls were selected (Supplementary Tables 1 and ), and genome-wide DNAm analysis was performed on whole blood and four purified immune cell populations for each individual, generating a DNAm dataset of 145 samples. In five pSLE patients, the purity of one of the cell lineages was not measured because of an inadequate number of cells (B cells, n = 4; CD8 + T cells, n = 1, Supplementary Table 3). DNAm microarray using the EPIC microarray (Illumina, San Diego, USA) was performed at the Centre for Applied Genomics at The Hospital for Sick Children (Toronto, Canada). To minimize batch effects, all 145 samples were scanned in the same batch. In addition, the distributions of samples on the arrays were randomized for both case and controls, as well as for all purified lineages. In other words, all 145 samples were randomized such that different cell lineages from different individuals were mixed together on the same array [Citation37]. Sample randomization served to minimize intra-chip differences. Raw intensity files were normalized using Illumina’s internal normalization probes and algorithms, and background noise was removed by subtracting the background intensities from negative probes [Citation14]. The relative DNAm level, represented as beta values (β), was derived from the intensities.
Statistical analysis was performed according to the methodology described in our previous study on DNAm changes in Chinese patients with adult-onset SLE [Citation14]. Briefly, raw data were exported into the R statistical environment and tested by a minfi package [Citation38]. A number of problematic probes were removed from further analysis, including cross-reactive probes, probes with SNPs at target sites [Citation39,Citation40], probes from sex chromosomes, and probes with a missing β value or with median detection p-values > 0.01 in 25% of all samples. Statistical analysis was performed independently on whole blood and for each cell type by comparing the lineage-specific DNAm data of pSLE patients and controls. For each probe, the Wilcoxon rank-sum test was used to compare differences in pSLE and controls, and a false discovery rate control was used for multiple testing corrections. Probes were considered statistically significant when their FDR-corrected p-value (or q-value)<0.05. To ensure robust results, probes with statistical significance were also filtered for effect size, that is, only probes with β differences>0.10 between SLE patients and controls (i.e., 10 percentage point difference) were selected for further analysis. As a result, CpG sites with an adjusted p-value<0.05 and a mean β change>0.10 were considered to be differentially methylated, as described previously [Citation14].
Principal component analysis (PCA) and unsupervised hierarchical clustering were performed using Qlucore Omics Explorer 3.2 (Qlucore, Lund, Sweden). Gene ontology analysis was performed using GeneMANIA (https://genemania.org), as described previously [Citation14,Citation41], and pathways with q-values (Benjamini-Hochberg-corrected p-value)<0.05 were considered significant. For the pSLE-specific DNAm signature, the Friedman test was performed in SPSS Statistics version 24 (IBM, Armonk, USA) to compare differences across multiple cell lineages in pSLE patients.
Availability of data and materials
The DNAm data generated in this study is available at the Gene Expression Omnibus (GEO) under the accession code, GSE118144, https://www.ncbi.nlm.nih.gov/geo/query/acc.cgi?acc=GSE118144
Ethics approval and consent to participate
This study was approved by the Institutional Review Board of the University of Hong Kong/Hospital Authority Hong Kong West Cluster (UW 14-327). All patients, or their parents if the patient was less than 18 years of age, provided written informed consent.
Supplemental Material
Download Zip (2.4 MB)Acknowledgments
The authors gratefully acknowledge the participation of our pSLE patients and their families.
Disclosure statement
No potential conflict of interest was reported by the authors.
Supplementary material
Supplemental data for this article can be accessed here.
Additional information
Funding
Related Research Data
References
- Wakeland EK, Liu K, Graham RR, et al. Delineating the genetic basis of systemic lupus erythematosus. Immunity. 2001 Sep;15(3):397–408.
- Domenech I, Aydintug O, Cervera R, et al. Systemic lupus erythematosus in 50 year olds. Postgrad Med J. 1992 Jun;68(800):440–444.
- Ward MM, Polisson RP. A meta-analysis of the clinical manifestations of older-onset systemic lupus erythematosus. Arthritis Rheum. 1989 Oct;32(10):1226–1232.
- Stichweh D, Arce E, Pascual V. Update on pediatric systemic lupus erythematosus. Curr Opin Rheumatol. 2004 Sep;16(5):577–587.
- Kamphuis S, Silverman ED. Prevalence and burden of pediatric-onset systemic lupus erythematosus. Nat Rev Rheumatol. 2010 Sep;6(9):538–546.
- Hiraki LT, Benseler SM, Tyrrell PN, et al. Clinical and laboratory characteristics and long-term outcome of pediatric systemic lupus erythematosus: a longitudinal study. J Pediatr. 2008 Apr;152(4):550–556.
- Pluchinotta FR, Schiavo B, Vittadello F, et al. Distinctive clinical features of pediatric systemic lupus erythematosus in three different age classes. Lupus. 2007;16(8):550–555.
- Levy DM, Kamphuis S. Systemic lupus erythematosus in children and adolescents. Pediatr Clin North Am. 2012 Apr;59(2):345–364.
- Joo YB, Park SY, Won S, et al. Differences in clinical features and mortality between childhood-onset and adult-onset systemic lupus erythematosus: a prospective single-center study. J Rheumatol. 2016 Aug;43(8):1490–1497.
- Tucker LB. Making the diagnosis of systemic lupus erythematosus in children and adolescents. Lupus. 2007;16(8):546–549.
- Absher DM, Li X, Waite LL, et al. Genome-wide DNA methylation analysis of systemic lupus erythematosus reveals persistent hypomethylation of interferon genes and compositional changes to CD4+ T-cell populations. PLoS Genet. 2013;9(8):e1003678.
- Coit P, Yalavarthi S, Ognenovski M, et al. Epigenome profiling reveals significant DNA demethylation of interferon signature genes in lupus neutrophils. J Autoimmun. 2015 Apr;58:59–66.
- Coit P, Jeffries M, Altorok N, et al. Genome-wide DNA methylation study suggests epigenetic accessibility and transcriptional poising of interferon-regulated genes in naive CD4+ T cells from lupus patients. J Autoimmun. 2013 Jun;43:78–84.
- Yeung KS, Chung BH, Choufani S, et al. Genome-wide DNA methylation analysis of chinese patients with systemic lupus erythematosus identified hypomethylation in genes related to the type I interferon pathway. PLoS One. 2017;12(1):e0169553.
- Ulff-Moller CJ, Asmar F, Liu Y, et al. Twin DNA methylation profiling reveals flare-dependent interferon signature and B cell promoter hypermethylation in systemic lupus erythematosus. Arthritis Rheumatol. 2018 Jun;70(6):878–890.
- Imgenberg-Kreuz J, Carlsson Almlof J, Leonard D, et al. DNA methylation mapping identifies gene regulatory effects in patients with systemic lupus erythematosus. Ann Rheum Dis. 2018 May;77(5):736–743.
- Joseph S, George NI, Green-Knox B, et al. Epigenome-wide association study of peripheral blood mononuclear cells in systemic lupus erythematosus: identifying DNA methylation signatures associated with interferon-related genes based on ethnicity and SLEDAI. J Autoimmun. 2018 Oct 6. DOI:10.1016/j.jaut.2018.09.007
- Coit P, Renauer P, Jeffries MA, et al. Renal involvement in lupus is characterized by unique DNA methylation changes in naive CD4+ T cells. J Autoimmun. 2015 Jul;61:29–35.
- Mok A, Solomon O, Nayak RR, et al. Genome-wide profiling identifies associations between lupus nephritis and differential methylation of genes regulating tissue hypoxia and type 1 interferon responses. Lupus Sci Med. 2016;3(1):e000183.
- Zhu H, Mi W, Luo H, et al. Whole-genome transcription and DNA methylation analysis of peripheral blood mononuclear cells identified aberrant gene regulation pathways in systemic lupus erythematosus. Arthritis Res Ther. 2016;18:162.
- Chung SA, Nititham J, Elboudwarej E, et al. Genome-wide assessment of differential DNA methylation associated with autoantibody production in systemic lupus erythematosus. PLoS One. 2015;10(7):e0129813.
- Coit P, Dozmorov MG, Merrill JT, et al. Epigenetic reprogramming in naive CD4+ T cells favoring T cell activation and Non-Th1 effector T cell immune response as an early event in lupus flares. Arthritis Rheumatol. 2016 Sep;68(9):2200–2209.
- Ji H, Ehrlich LI, Seita J, et al. Comprehensive methylome map of lineage commitment from haematopoietic progenitors. Nature. 2010 Sep 16;467(7313):338–342.
- Accomando WP, Wiencke JK, Houseman EA, et al. Quantitative reconstruction of leukocyte subsets using DNA methylation. Genome Biol. 2014 Mar 05;15(3):R50.
- Houseman EA, Accomando WP, Koestler DC, et al. DNA methylation arrays as surrogate measures of cell mixture distribution. BMC Bioinformatics. 2012;13:86.
- Reinius LE, Acevedo N, Joerink M, et al. Differential DNA methylation in purified human blood cells: implications for cell lineage and studies on disease susceptibility. PLoS One. 2012;7(7):e41361.
- Yano S, Ghosh P, Kusaba H, et al. Effect of promoter methylation on the regulation of IFN-gamma gene during in vitro differentiation of human peripheral blood T cells into a Th2 population. J Immunol. 2003 Sep 01;171(5):2510–2516.
- McGregor K, Bernatsky S, Colmegna I, et al. An evaluation of methods correcting for cell-type heterogeneity in DNA methylation studies. Genome Biol. 2016;17:84.
- Teschendorff AE, Breeze CE, Zheng SC, et al. A comparison of reference-based algorithms for correcting cell-type heterogeneity in epigenome-wide association studies. BMC Bioinformatics. 2017 Feb 13;18(1):105.
- Jury EC, Kabouridis PS, Abba A, et al. Increased ubiquitination and reduced expression of LCK in T lymphocytes from patients with systemic lupus erythematosus. Arthritis Rheumatism. 2003 May;48(5):1343–1354.
- Jury EC, Kabouridis PS, Flores-Borja F, et al. Altered lipid raft-associated signaling and ganglioside expression in T lymphocytes from patients with systemic lupus erythematosus. J Clin Invest. 2004 Apr;113(8):1176–1187.
- Crow MK, Kirou KA, Wohlgemuth J. Microarray analysis of interferon-regulated genes in SLE. Autoimmunity. 2003 Dec;36(8):481–490.
- Bruyns E, Marie-Cardine A, Kirchgessner H, et al. T cell receptor (TCR) interacting molecule (TRIM), a novel disulfide-linked dimer associated with the TCR-CD3-zeta complex, recruits intracellular signaling proteins to the plasma membrane. J Exp Med. 1998 Aug 03;188(3):561–575.
- Zhao M, Zhou Y, Zhu B, et al. IFI44L promoter methylation as a blood biomarker for systemic lupus erythematosus. Ann Rheum Dis. 2016 Nov;75(11):1998–2006.
- Liu YJ. IPC: professional type 1 interferon-producing cells and plasmacytoid dendritic cell precursors. Annu Rev Immunol. 2005;23:275–306.
- Maqbool M, Vidyadaran S, George E, et al. Optimisation of laboratory procedures for isolating human peripheral blood derived neutrophils. Med J Malaysia. 2011 Oct;66(4):296–299.
- Buhule OD, Minster RL, Hawley NL, et al. Stratified randomization controls better for batch effects in 450K methylation analysis: a cautionary tale. Front Genet. 2014;5:354.
- Aryee MJ, Jaffe AE, Corrada-Bravo H, et al. Minfi: a flexible and comprehensive bioconductor package for the analysis of infinium DNA methylation microarrays. Bioinformatics. 2014 May 15;30(10):1363–1369.
- Chen YA, Lemire M, Choufani S, et al. Discovery of cross-reactive probes and polymorphic CpGs in the illumina infinium HumanMethylation450 microarray. Epigenetics. 2013 Feb;8(2):203–209.
- McCartney DL, Walker RM, Morris SW, et al. Identification of polymorphic and off-target probe binding sites on the illumina infinium MethylationEPIC BeadChip. Genom Data. 2016 Sep;9:22–24.
- Warde-Farley D, Donaldson SL, Comes O, et al. The GeneMANIA prediction server: biological network integration for gene prioritization and predicting gene function. Nucleic Acids Res. 2010 Jul;38(Web Server issue):W214–W220.