
ABSTRACT
Potential functional coordination between histone deubiquitinases and histone lysine demethylases represents one of the least studied aspects of epigenetic control of transcriptional outcomes. Here, this question was addressed using Arabidopsis histone modification erasers deubiquitinase OTLD1 and demethylase KDM1C known to interact with each other in plant cells. Characterization of gain- and loss-of-function mutants of OTLD1 and KDM1C showed that both enzymes associate with the promoter chromatin of their target gene AN3 and function as coactivators of its expression. This transcriptional outcome was underlain by demethylation of the H3K9 repression mark, presumably by the KDM1C histone demethylase activity. Association of KDM1C and OTLD1 with the target chromatin was interdependent such that OTLD1 was not detected at the AN3 in the absence of KDM1C and KDM1C displayed a different and non-functional pattern of association in the absence of OTLD1. Thus, OTLD1 and KDM1C may crosstalk with each other to assemble a functional coactivator complex at the AN3 promoter chromatin and set the KDM1C specificity for the methylated H3K9 to determine the correct transcriptional outcome.
Introduction
Posttranslational histone modifications are central to gene regulation in all eukaryotic organisms, determining the active or inactive state of the chromatin. Furthermore, one histone modification often promotes generation of another, a phenomenon termed histone crosstalk, that shapes the specific histone modification landscape and, ultimately, transcriptional outcomes (Citation1,Citation2). Well-studied cases of histone crosstalk are illustrated by the mammalian MLL3/4-UTX activator complex that coordinates histone lysine 27 (H3K27) demethylation and H3K4 methylation [Citation3], Drosophila repressor complexes PcG that coordinates H3K27 methylation and H2AK119 ubiquitylation [Citation4] and dRAF that links H2AK119 ubiquitylation with H3K36 demethylation [Citation5], and yeast Rad6/Bre1 ubiquitin ligases and Dot1/Set1 histone methyltransferases that coordinate H2BK123 ubiquitylation and H3K4/H3K79 methylation [Citation6]. In plants, studies of histone crosstalk are still lacking, although mutations in the Arabidopsis UBP26 have been shown to increase H2BK143 ubiquitylation and H3K4 methylation and decrease H3K9 methylation, resulting in gene silencing [Citation7]. One of the least studied cases, in plant and non-plant model systems, is the possible functional coordination between histone deubiquitinases and histone lysine demethylases in transcriptional regulation of their target genes. Here, we addressed this question using Arabidopsis histone modification erasers deubiquitinase OTLD1 and demethylase KDM1C.
OTLD1 is a member of the ovarian tumor (OTU) deubiquitinase family [Citation8,Citation9] that deubiquitylates monoubiquitylated H2B [Citation10] and acts mainly as gene repressor, whose target genes include GA20OX, WUS, OSR2, ARL, and ABI5 involved in plant growth and development [Citation11]. However, OTLD1 also can activate gene expression; specifically, OTLD1 induces expression of a plant developmental regulator gene AN3/GIF [Citation12]. Interestingly, OTLD1 can interact with the KDM1C histone demethylase in plant cells [Citation10]. KDM1C is an Arabidopsis member of the SWIRM (Swi3p, Rsc8p, Moira) [Citation13]/polyamine oxidase (PAO) domain histone lysine demethylase family [Citation14], exemplified by the animal LSD1/KDM1A enzyme, the founding member of the KDM1 family [Citation15]. Most studies suggested that diverse, plant and non-plant KDM1 enzymes function as corepressors by demethylating the euchromatic marks on H3K4 in the target chromatin, both in vivo and in vitro [Citation15–Citation19]. Yet, the animal LSD1/KDM1A has been shown also to act as a coactivator, removing the repressive marks on H3K9 [Citation20–Citation25]. Using gain-of-function and loss-of-function Arabidopsis alleles of OTLD1 and KDM1C, we demonstrated coordinate action of both histone modification erasers in transcriptional activation of their common target gene AN3.
Results
Transcriptional regulation of the AN3 gene in KDM1C loss-of-function and gain-of-function plants
We examined whether KDM1C affects the expression of AN3, the target gene activated by OTLD1 [Citation12]. First, we utilized a previously described loss-of-function mutant kdm1c-1 (SALK_142477) [Citation26]. RT-qPCR analysis of this line showed statistically significant (p-values < 0.05) reduction in the KDM1C gene expression as compared to the wild type plants ()). The kdm1c-1 line also exhibited substantial decrease in accumulation of the AN3 transcripts ()). We then generated several independent homozygous transgenic lines of Arabidopsis that express KDM1C tagged with an hexahistidine epitope from a general CaMV 35S promoter; one of these gain-of-function lines, designated KDM1C OE-1, was analyzed in detail. ) shows that the KDM1C OE-1 plants accumulated 7-fold higher amounts of KDM1C transcripts than the wild-type plants; this relatively moderate increase in expression allowed us to analyze the gain-of-function effects of KDM1C while avoiding unnecessarily high expression amounts. Specifically, the KDM1C OE-1 plants displayed, with statistical significance (p-values < 0.05) an increase in the AN3 transcript levels ()). The expression levels of the internal reference genes ACT7 and UBQ10 showed no statistically significant differences between any of the tested plant lines ,)).
Figure 1. Effect of loss- and gain-of-function of KDM1C on AN3 transcript levels. Loss-of-function kdm1c-1 plants. (a) Expression of KDM1C. (b) Expression of AN3. (c) Expression of the reference genes ACT7 and UBQ10. Gain-of-function KDM1C OE-1 plants. (d) Expression of KDM1C. (e) Expression of AN3. (f) Expression of the reference genes ACT7 and UBQ10. Relative expression levels of the indicated genes in the wild-type plants (black bars) and kdm1c-1 plants or KDM1C OE-1 plants (gray bars) were analyzed by RT-qPCR. The expression level in the wild-type plants is set to 1.0. Error bars represent s. e. m. of three independent biological replicates, N = 3; p-values <0.05 for statistical significance of differences between the wild-type plants and kdm1c-1 plants in (a) and (b) or KDM1C OE-1 plants in (d) and (e) whereas differences between all tested plants in (c) and (f) were not statistically significant.
Next, we used quantitative chromatin immunoprecipitation (qChIP) to investigate potential association of KDM1C with the AN3 chromatin in the KDM1C OE-1 plants in the general promoter area previously shown to be occupied and deubiquitylated by OTLD1 [Citation12]. shows statistically significant (p-values < 0.05) association of KDM1C with two distinct regions, one located ca. 500 bp upstream of the translation initiation codon (AN3-C) and the other flanking the translation initiation codon (AN3-A); no association of KDM1C was observed with two other tested promoter regions. In positive control experiments using previously described transgenic lines OTLD1 OE-1 and OTLD1 OE-2 that express a hexahistidine-tagged OTLD1 [Citation12], OTLD1, known to bind to the AN3 chromatin [Citation12], indeed associated with the promoter areas of AN3 . This qChIP analysis utilized the same four AN3 promoter regions used for testing the binding of KDM1C (); interestingly, in both OTLD1 OE-1 and OTLD1 OE-2 plants, OTLD1 associated with those two chromatin regions () that were not occupied by KDM1C in the KDM1C OE-1 plants (). Taken together, the data in and support the role of KDM1C in transcriptional activation of the AN3 gene.
Figure 2. KDM1C and OTLD1 associate with AN3 chromatin. (a) Association of His-tagged KDM1C with the AN3 chromatin. Wild-type plants, black bars; KDM1C OE-1 plants, dark gray bars. (b) Association of His-tagged OTLD1 with the AN3 chromatin. OTLD1 OE-1 plants, dark gray bars; OTLD1 OE-2 plants, light gray bars. Locations of the indicated regions within the promoter area of AN3 used for qChIP analyses are detailed in Table S1. A. U., arbitrary units. Error bars represent s. e. m. of three independent biological replicates, N = 3; p-values <0.05 for statistical significance of differences between the wild-type and KDM1C OE-1, OTLD1 OE-1, or OTLD1 OE-2 lines.
KDM1C reduces methylation of H3K9, but not of H3K4, in the AN3 chromatin
Based on the substrate specificity of KDM1 enzymes, which includes mainly H3K4 [Citation15–Citation19] or, in some cases, H3K9 [Citation20–Citation25], we used qChIP to compare the content of the heterochromatic H3K9me2 and euchromatic H3K4me3 marks in the AN3 chromatin in the loss-of-function kdm1c-1 plants and in the wild-type plants. From four tested chromatin regions of the AN3 promoter, two became hypermethylated at H3K9 in a statistically significant fashion (p-values < 0.05) in the kdm1c-1 line as compared to the wild-type plants whereas two other regions showed no statistically significant changes in the H3K9 methylation . No statistically significant differences in H3K9 methylation were detected in the chromatin of the internal reference ACT7 and UBQ10 genes (). Our qChIP analysis of the H3K4me3 content in the AN3 chromatin in the kdm1c-1 and the wild-type plants revealed statistically significant (p-values < 0.05) hypomethylation of H3K4 in the loss-of-function line () with no changes in H3K4 methylation in the reference ACT7 and UBQ10 chromatin . These data correlate the absence of the KDM1C demethylase with the increased levels of the H3K9me2 repressive mark, but not of the euchromatic H3K4me3 mark, in the target AN3 chromatin, suggesting that activation of AN3 transcription involves H3K9 demethylation by KDM1C.
Figure 3. Effect of loss-of-function of KDM1C on H3K9 dimethylation and H3K4 trimethylation of AN3 chromatin. (a) H3K9 methylation of the AN3 chromatin. (b) H3K9 methylation of the reference genes ACT7 and UBQ10. (c) H3K4 methylation of the AN3 chromatin. (d) H3K4 methylation of the reference genes ACT7 and UBQ10. Wild-type plants, black bars; kdm1c-1 plants, gray bars. Locations of indicated regions within the promoter area of AN3 used for qChIP analyses are detailed in Table S1. The corresponding methylation level in the wild-type plants is set to 1.0. Error bars represent s. e. m. of three independent biological replicates, N = 3; p-values <0.05 for statistical significance of differences between the wild-type and kdm1c-1 plants in (a) and (c) whereas differences between all tested plants in (b) and (d) were not statistically significant.
Next, we performed the qChIP analysis of the H3K9me2 and H3K4me3 content of the AN3 chromatin in the gain-of-function KDM1C OE-1 line. The KDM1C OE-1 plants exhibited statistically significant (p-values <0.05) hypomethylation of H3K9 relative to the wild-type plants (). In contrast, we did not detect statistically significant changes in the H3K4me3 levels between both plant lines . Reference ACT7 and UBQ10 chromatin exhibited no changes in its H3K9me2 and H3K4me3 content (,). These data are consistent with the notion that the heterochromatic H3K9 represents the main target of the KDM1C demethylase during transcriptional activation of the AN3 gene.
Figure 4. Effect of gain-of-function of KDM1C on H3K9 dimethylation and H3K4 trimethylation of AN3 chromatin. (a) H3K9 methylation of the AN3 chromatin. (b) H3K9 methylation of the reference genes ACT7 and UBQ1. (c) H3K4 methylation of the AN3 chromatin. (d) H3K4 methylation of the reference genes ACT7 and UBQ1. Wild-type plants, black bars; KDM1C-OE-1 plants, gray bars. Locations of indicated regions within the promoter area of AN3 used for qChIP analyses are detailed in Table S1. The corresponding methylation level in the wild-type plants is set to 1.0. Error bars represent s. e. m. of three independent biological replicates, N = 3; p-values <0.05 for statistical significance of differences between the wild-type and KDM1C-OE-1 plants in (a) and (c) whereas differences between all tested plants in (b) and (d) were not statistically significant.
Both KDM1C and OTLD1 are required for transcriptional activation of AN3
Our data suggest that the KDM1C demethylase is involved in transcriptional activation of the AN3 gene, potentially through occupying its promoter chromatin and demethylating its H3K9 repressive marks (–). On the other hand, also the OTLD1 deubiquitinase has been shown to activate AN3 via association with its chromatin and H2B deubiquitylation [Citation12]. Potentially connecting these observations is the ability of KDM1C and OTLD1 to interact with each other physically in the plant cells [Citation10]. Thus, we endeavored to examine whether KDM1C and OTLD1 cooperate functionally during activation of the AN3 expression. To this end, we generated two types of transgenic plants: OTLD1 gain-of-function/KDM1C loss-of-function and KDM1C gain-of-function/OTLD1 loss-of-function. Specifically, two independent lines of each type, i.e., OTLD1 OE-3/kdm1c-1 and OTLD1 OE-4/kdm1c-1 lines and KDM1C OE-2/otld1-1 and KDM1C OE-3/otld1-1 lines, were produced and analyzed. ) shows, with statistical significance (p-values < 0.05), that both OTLD1 OE-3/kdm1c-1 and OTLD1 OE-4/kdm1c-1 lines exhibited reduced expression of the KDM1C gene and increased expression of the OTLD1 gene. Both of these lines also were unable to activate expression of AN3 () but did not display any changes in the expression of the ACT7 and UBQ10 reference genes . In reciprocal experiments, the KDM1C OE-2/otld1-1 and KDM1C OE-3/otld1-1 lines exhibited elevated expression of KDM1C and low levels of expression of OTLD1 (). Yet, these lines also did not activate the expression of the AN3 gene () while not altering the expression of the control, reference genes (). This is in contrast to the observations that individual gain-of-function mutants of KDM1C () or OTLD1 [Citation12] in the wild-type genetic background activate AN3 expression. Thus, these data suggest that both KDM1C and OTLD1 are required to transcriptionally activate their target AN3 gene whereas each of these individual histone modifying enzymes alone is insufficient for activation, suggesting that KDM1C and OTLD1 act in a coordinate fashion.
Figure 5. Effect of loss-of function of KDM1C or OTLD1 on AN3 transcript levels in OTLD1 or KDM1C gain-of-function plants. OTLD1 OE-3/kdm1c-1 and OTLD1 OE-4/kdm1c-1 plants. (a) KDM1C and OTLD1 transcript levels. (b) AN3 transcript levels. (c) Reference gene ACT7 and UBQ10 transcript levels. KDM1C OE-2/otld1-1 and KDM1C OE-3/otld1-1 plants. (d) KDM1C and OTLD1 transcript levels. (e) AN3 transcript levels. (f) Reference gene ACT7 and UBQ10 transcript levels. Relative expression levels of the indicated genes in the wild-type plants (black bars), OTLD1 OE-3/kdm1c-1 plants and KDM1C OE-2/otld1-1 plants (dark gray bars), and OTLD1 OE-4/kdm1c-1 and KDM1C OE-3/otld1-1 plants (light gray bars) were analyzed by RT-qPCR. The expression level in the wild-type plants is set to 1.0. Error bars represent s. e. m. of three independent biological replicates, N = 3; p-values <0.05 for statistical significance of differences between the wild-type and OTLD1 OE-3/kdm1c-1 and OTLD1 OE-4/kdm1c-1 in (a) and (b) or KDM1C OE-2/otld1-1 and KDM1C OE-3/otld1-1 plants in (d) and (e) whereas differences between all tested plants in (c) and (f) were not statistically significant.
Association of KDM1C and OTLD1 with the target AN3 chromatin is interdependent
Coordinate action of KDM1C and OTLD1 on the AN3 gene expression may be the result of coordinate association of these proteins with the target chromatin. To test this idea, we performed the qChIP analysis of occupation of the AN3 promoter chromatin by KDM1C and OTLD1 in the OTLD1 OE-3/kdm1c-1, OTLD1 OE-4/kdm1c-1, KDM1C OE-2/otld1-1, and KDM1C OE-3/otld1-1 lines. shows that, in both OTLD1 OE-3/kdm1c-1 and OTLD1 OE-4/kdm1c-1 plants, OTLD1 failed to associate with the AN3 chromatin with statistical significance, exhibiting only very low levels of the qChIP signal. These data are consistent with the inability of these plant lines to activate AN3 expression (). However, in the KDM1C OE-2/otld1-1 and KDM1C OE-3/otld1-1 plants, KDM1C retained its ability to associate with the target chromatin (). Interestingly, this association was detected mainly with those chromatin regions of the AN3 promoter that showed no association with KDM1C in the presence of wild-type levels of OTLD1 (), and most likely it was non-functional as these plant lines did not support induction of AN3 expression (. Thus, association of OTLD1 with the AN3 promoter chromatin appears to require the presence of KDM1C whereas KDM1C can associate with the target chromatin in the absence of OTLD1, albeit this association does not faithfully replicate the association of KDM1C in the presence of the wild-type OTLD1. This notion, that KDM1C association with the AN3 chromatin in the absence of OTLD1 is not functional, is lent further support by the observation that elevated expression of KDM1C in the KDM1C OE-2/otld1-1 and KDM1C OE-3/otld1-1 lines did not result in hypomethylation of H3K9 in the AN3 chromatin () as we observed in the KDM1C gain-of-function plants .
Figure 6. Effect of loss-of function of KDM1C or OTLD1 on OTLD1 or KDM1C association with AN3 chromatin. (a) Association of His-tagged OTLD1 with the AN3 chromatin in KDM1C loss-of-function plants. OTLD1 OE-3/kdm1c-1 plants, dark gray bars; OTLD1 OE-4/kdm1c-1 plants, light gray bars. (b) Association of His-tagged KDM1C with the AN3 chromatin in OTLD1 loss-of-function plants. KDM1C OE-2/otld1-1 plants, dark gray bars; KDM1C OE-3/otld1-1 plants, light gray bars. Locations of the indicated regions within the promoter area of AN3 used for qChIP analyses are detailed in Table S1. A. U., arbitrary units. Error bars represent s. e. m. of three independent biological replicates, N = 3; p-values <0.05 for statistical significance of differences between the wild-type and OTLD1 OE-3/kdm1c-1, OTLD1 OE-4/kdm1c-1, KDM1C OE-2/otld1-1 or KDM1C OE-3/otld1-1 lines.
Figure 7. Effect of gain-of-function of KDM1C on H3K9 dimethylation of AN3 chromatin in OTLD1 loss-of-function plants. (a) H3K9 methylation of the AN3 chromatin. (b) H3K9 methylation of the reference genes ACT7 and UBQ1. Wild-type plants, black bars; KDM1C OE-2/otld1-1 plants, dark gray bars; KDM1C OE-3/otld1-1 plants, light gray bars. Locations of the indicated regions within the promoter area of AN3 used for qChIP analyses are detailed in Table S1. The methylation level in the wild-type plants is set to 1.0. Error bars represent s. e. m. of three independent biological replicates, N = 3; p-values <0.05 for statistical significance of differences between the wild-type and KDM1C OE-2/otld1-1 or KDM1C OE-3/otld1-1 lines.
Discussion
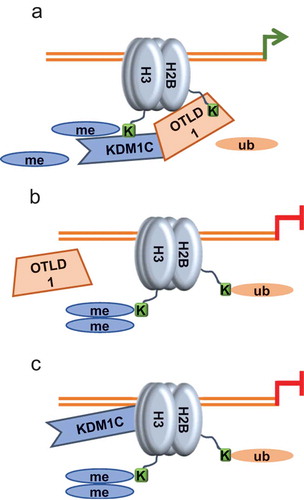
One fascinating feature of some chromatin modifying enzymes is their ability to function both as corepressors and coactivators, depending on the specific chromatin target. Both OTLD1 and KDM1C belong to this category of dual-function enzymes. Historically, OTLD1 and KDM1C were first characterized as corepressors [Citation10,Citation11,Citation26,Citation27]. However, LSD1/KDM1A, the animal homolog of KDM1C, has been found also in activator complexes [Citation20–Citation25], although this activity has not been demonstrated for any of the plant KDM1 family members, including KDM1C. More recently, OTLD1 was shown to act as a coactivator [Citation12]. Based on these data and on the ability of OTLD1 to interact with KDM1C [Citation10], we hypothesized that KDM1C and OTLD1 may act together, in a coordinate manner as coactivators of their target gene expression. Our data here support this notion, demonstrating that KDM1C activates transcription of the AN3 gene by associating with its promoter chromatin where KDM1C most likely prevents accumulation of the repressive mark H3K9me2 through its demethylase activity, allowing accumulation of the acetylated H3 histone marks of the active chromatin [Citation12] ((a)). This coactivator action of KDM1C is dependent on the presence of OTLD1 which also associates with the AN3 promoter chromatin and deubiquitylates its monoubiquitylated H2B [Citation12] whereas the AN3-activating action of OTLD1 is dependent on the presence of KDM1C. This functional interdependence of KDM1C and OTLD1 is not simple. Although their ability to promote transcriptional activation of AN3 strictly depends on each other’s presence, their association with the target chromatin shows a more complex relationship. OTLD1 association with the AN3 chromatin could not be detected in the absence of KDM1C (, but, in the absence of OTLD1, KDM1C was still detected at the target chromatin . This observation suggests that KDM1C may recruit OTLD1 to the AN3 chromatin. However, the target chromatin association of KDM1C in the presence of OTLD1 differs from that in the absence of OTLD1; specifically, when OTLD1 is unavailable, KDM1C associates with the promoter regions with which it does not associate when OTLD1 is present (). One potential explanation for this difference is that, when KDM1C attaches to the target chromatin in complex with OTLD1, OTLD1 may affect which chromatin regions are accessible to KDM1C. It is association of KDM1C with these OTLD1-defined chromatin regions of AN3 that correlates with transcriptional activation of this gene.
Figure 8. Schematic illustration of coordinate action of KDM1C and OTLD1 in histone modification of the AN3 chromatin and transcriptional activation of the AN3 gene. (a) KDM1C and OTLD1 associate with the AN3 promoter chromatin and demethylate H3K9 and deubiquitylate H2B, respectively, promoting accumulation of the heterochromatic histone mark H3ac and transcriptional activation of AN3. These functional effects of KDM1C and OTLD1 on the AN3 chromatin are interdependent. (b) In the absence of KDM1C, OTLD1 does associate with and modify the target chromatin and is unable to activate AN3 transcription. (c) In the absence of OTLD1, KDM1C still associates with the target chromatin, albeit at different locations, but is unable to modify it or to activate AN3 transcription.
Another interesting aspect of the AN3 regulation by KDM1C/OTLD1 is that it most likely involves demethylation of the H3K9 repressive mark by KDM1C. To our knowledge, this is the first report of a coactivator role for a plant KDM1-type histone demethylase as well as of its potential ability to demethylate H3K9. Recently, the animal LSD1/KDM1A has been suggested to alter its substrate specificity from H3K4 euchromatic mark to H3K9 heterochromatic mark and act as a co-activator in the presence of its interactor protein [Citation25]. Thus, OTLD1 and KDM1C may crosstalk with each other to assemble a functional coactivator complex at the AN3 promoter chromatin and set the KDM1C specificity for the methylated H3K9 to determine the correct transcriptional outcome.
Methods
Plants
Wild-type Arabidopsis thaliana (ecotype Col-0) and T-DNA insertional mutant lines kdm1c-1 (formerly swp1-1) (SALK_142477) [Citation26] and otld1-1 (SALK_028707) [Citation10] plants were grown at 22°C under long-day conditions (16-h light/8-h dark cycle at 140 μE sec−1m−2 light intensity) as described previously [Citation11,Citation12].
Production of transgenic plants
For gain-of-function expression of KDM1C or OTLD1, their coding sequences were amplified from Arabidopsis cDNA using primers detailed in Table S1, cloned into the XhoI-KpnI sites of pSAT4-HIS-C1 [Citation28], excised and inserted into the I-SceI site of the binary pPZP-RCS2 vector [Citation29]. These constructs were used to transform either wild-type Arabidopsis plants or kdm1c-1 or otld1-1 mutants as described [Citation11], and the T2 progeny of the resulting KDM1C OE-1, OTLD1 OE-3/kdm1c-1, OTLD1 OE-4/kdm1c-1, KDM1C OE-2/otld1-1, and KDM1C OE-3/otld1-1 lines was used for further analyses. The OTLD1 OE-1 and OTLD1 OE-2 lines have been described previously [Citation11].
Quantitative RT-PCR (RT-qPCR)
Total RNA (1 µg) extracted from aerial parts of 21-days-old plants using the NucleoSpin RNA Plant Kit (Macherey-Nagel GmbH & Co.) was reverse transcribed using the RevertAid RT Reverse Transcription Kit (Thermo Fisher Scientific Inc.). The resulting cDNA sample (2 µl) was amplified using Maxima SYBR Green qPCR Master Mix (Thermo Fisher Scientific Inc.) and specific primers (Table S1) in a StepOnePlus real-time PCR system (Applied Biosystems) with previously-described program cycles [Citation11,Citation12]. Each sample was analyzed in three biological replicates using the reference genes UBQ10 (At4g05320) and ACT7 (At5g09810) [Citation11,Citation12] to normalize the data by the comparative Ct method [Citation30]. All quantitative data were analyzed by the Student’s t-test with p-values < 0.05, corresponding to the statistical probability of >95%, considered statistically significant. Standard error of the mean (s. e. m.) and t-test calculations were performed using Excel 2010 (Microsoft Corporation Inc.).
Quantitative chromatin immunoprecipitation (qChIP)
qChIP was performed as described [Citation11]. Briefly, cell nuclei were isolated from 21-days-old plants cross‐linked by 1% formaldehyde (v/v). Chromatin was sheared by sonication, pre-incubated with pre-equilibrated protein A agarose beads (16–157, MilliporeSigma), centrifuged, and the supernatant was incubated at 4°C for overnight with 1:133 dilution of the appropriate antibody [anti-acetyl-histone H3K9me2 (07–212, MilliporeSigma), anti-trimethyl H3K4 (8580, Abcam), or anti-penta-His (34,660, Qiagen)], combined with protein A agarose (60 µl) and further incubated at 4°C for 2 h. The immunocomplexes immobilized on the protein A agarose beads were treated as described [Citation11], DNA eluted and analyzed by qPCR using the appropriate primers (Table S1) as described for RT-qPCR. For anti-His qChIP, non-specific background immunosignal control obtained with wild-type Arabidopsis plants that do not express the His epitope was subtracted from the qPCR data.
Author Contributions
I.K. designed, performed, analyzed, and discussed all the experiments and data in this study and wrote the manuscript. V.C. and M.L. provided conceptual guidance, secured required funding, and reviewed and edited the manuscript.
Supplemental Material
Download PDF (286.5 KB)Acknowledgments
The work in the V.C. laboratory was supported by grants from NIH, NSF, and USDA/NIFA to V.C., and from BARD to V.C. and M.L.
Disclosure statement
No potential conflict of interest was reported by the authors.
Supplemental material
Supplemental data for this article can be accessed here.
Additional information
Funding
Related Research Data
References
- Lee JS, Smith E, Shilatifard A. The language of histone crosstalk. Cell. 2010;142:682–685.
- Suganuma T, Workman JL. Crosstalk among histone modifications. Cell. 2008;135:604–607.
- Cho YW, Hong T, Hong S, et al. PTIP associates with MLL3- and MLL4-containing histone H3 lysine 4 methyltransferase complex. J Biol Chem. 2007;282:20395–20406.
- Schwartz YB, Pirrotta V. Polycomb silencing mechanisms and the management of genomic programmes. Nat Rev Genet. 2007;8:9–22.
- Lagarou A, Mohd-Sarip A, Moshkin YM, et al. dKDM2 couples histone H2A ubiquitylation to histone H3 demethylation during polycomb group silencing. Genes Dev. 2008;22:2799–2810.
- Chandrasekharan MB, Huang F, Sun ZW. Histone H2B ubiquitination and beyond: regulation of nucleosome stability, chromatin dynamics and the trans-histone H3 methylation. Epigenetics. 2010;5:460–468.
- Sridhar VV, Kapoor A, Zhang K, et al. Control of DNA methylation and heterochromatic silencing by histone H2B deubiquitination. Nature. 2007;447:735–738.
- Isono E, Nagel MK. Deubiquitylating enzymes and their emerging role in plant biology. Front Plant Sci. 2014;5:56.
- Feng J, Shen WH. Dynamic regulation and function of histone monoubiquitination in plants. Front Plant Sci. 2014;5:83.
- Krichevsky A, Lacroix B, Zaltsman A, et al. Involvement of KDM1C histone demethylase-OTLD1 otubain-like histone deubiquitinase complexes in plant gene repression. Proc Natl Acad Sci USA. 2011;108:11157–11162.
- Keren I, Citovsky V. The histone deubiquitinase OTLD1 targets euchromatin to regulate plant growth. Sci Signal. 2016;9:ra125.
- Keren I, Citovsky V. Activation of gene expression by histone deubiquitinase OTLD1. Epigenetics. 2017;12:584–590.
- Aravind L, Iyer LM. The SWIRM domain: a conserved module found in chromosomal proteins points to novel chromatin-modifying activities. Genome Biol. 2002;3(8):RESEARCH0039.
- Zhou X, Ma H. Evolutionary history of histone demethylase families: distinct evolutionary patterns suggest functional divergence. BMC Evol Biol. 2008;8:294.
- Shi Y, Lan F, Matson C, et al. Histone demethylation mediated by the nuclear amine oxidase homolog LSD1. Cell. 2004;119:941–953.
- Forneris F, Binda C, Dall‘Aglio A, et al. A highly specific mechanism of histone H3-K4 recognition by histone demethylase LSD1. J Biol Chem. 2006;281:35289–35295.
- Wang J, Scully K, Zhu X, et al. Opposing LSD1 complexes function in developmental gene activation and repression programmes. Nature. 2007;446:882–887.
- Spedaletti V, Polticelli F, Capodaglio V, et al. Characterization of a lysine-specific histone demethylase from Arabidopsis thaliana. Biochemistry. 2008;47:4936–4947.
- Amente S, Bertoni A, Morano A, et al. LSD1-mediated demethylation of histone H3 lysine 4 triggers Myc-induced transcription. Oncogene. 2010;29:3691–3702.
- Carnesecchi J, Forcet C, Zhang L, et al. ERRalpha induces H3K9 demethylation by LSD1 to promote cell invasion. Proc Natl Acad Sci USA. 2017;114:3909–3914.
- Perillo B, Ombra MN, Bertoni A, et al. DNA oxidation as triggered by H3K9me2 demethylation drives estrogen-induced gene expression. Science. 2008;319:202–206.
- Metzger E, Wissmann M, Yin N, et al. LSD1 demethylates repressive histone marks to promote androgen-receptor-dependent transcription. Nature. 2005;437:436–439.
- Laurent B, Ruitu L, Murn J, et al. A specific LSD1/KDM1A isoform regulates neuronal differentiation through H3K9 demethylation. Mol Cell. 2015;57:957–970.
- Ray SK, Li HJ, Metzger E, et al. CtBP and associated LSD1 are required for transcriptional activation by NeuroD1 in gastrointestinal endocrine cells. Mol Cell Biol. 2014;34:2308–2317.
- Ahmed M, Streit A. Lsd1 interacts with cMyb to demethylate repressive histone marks and maintain inner ear progenitor identity. Development. 2018;145:dev160325.
- Krichevsky A, Gutgarts H, Kozlovsky SV, et al. C2H2 zinc finger-SET histone methyltransferase is a plant-specific chromatin modifier. Dev Biol. 2007;303:259–269.
- Jiang D, Yang W, He Y, et al. Arabidopsis relatives of the human lysine-specific demethylase1 repress the expression of FWA and FLOWERING LOCUS C and thus promote the floral transition. Plant Cell. 2007;19:2975–2987.
- Magori S, Citovsky V. Agrobacterium counteracts host-induced degradation of its F-box protein effector. Sci Signal. 2011;4:ra69.
- Tzfira T, Tian GW, Lacroix B, et al. pSAT vectors: a modular series of plasmids for fluorescent protein tagging and expression of multiple genes in plants. Plant Mol Biol. 2005;57:503–516.
- Livak KJ, Schmittgen TD. Analysis of relative gene expression data using real-time quantitative PCR and the 2(-delta delta C(T)) method. Methods. 2001;25:402–408.