
ABSTRACT
The placenta is an important organ in pregnancy, however, very little is understood about placental development at a molecular level. This includes the role of epigenetic mechanisms and how they change throughout gestation. DNA methylation studies in this organ are complicated by the different cell types that make up the placenta, each with their own unique transcriptome and epigenome. Placental dysfunction is often associated with pregnancy complications such as preeclampsia (PE). Aberrant DNA methylation in the placenta has been identified in pregnancy complications. We used immunohistochemistry (IHC) and immunofluorescence (IF) to localize 5-methylcytosine (5-mC) and 5-hydroxymethylcytosine (5-hmC) in placenta tissue from first and second trimester as well as uncomplicated term and PE samples. IHC analysis of whole placental tissues showed 5-mC increased across gestation. When cytotrophoblasts (CTB) and syncytiotrophoblasts (STB) were isolated and assessed using IF, both 5-mC and 5-hmC increased in term CTBs compared to first/second-trimester samples. Staining intensity of 5-hmC was higher in first/second trimester STBs compared to CTBs (P = 0.0011). Finally, IHC staining of term tissue from PE and uncomplicated pregnancies revealed higher 5-mC staining intensity in placentas from PE pregnancies (P = 0.028). Our study has shown increased 5-mC and 5-hmC staining intensities across gestation and differed between two trophoblast populations. Differences in DNA methylation profiles between placental cell types may be indicative of different functions and requires further study to elucidate what changes accompany placental pathologies.
The placenta is an important organ for human reproduction. It is shared by both mother and fetus and is responsible for oxygen and nutrient supply and waste elimination from the growing fetus. The placenta is also responsible for the secretion of a variety of hormones and steroids imperative to correct maternal adaptation to pregnancy [Citation1]. Thus, it is unsurprising that defective placentation and consequently placental dysfunction underlie many of the major obstetric diseases including preeclampsia (PE) and fetal growth restriction (FGR) [Citation2]. However, whilst there is significant understanding about the down-stream effects of placental dysfunction, the cause of inadequate placental development and function is poorly understood.
Placental development is highly organized and results in numerous cell types with specialized functions. One of the most important cell types of the placenta is the trophoblasts which derive from the trophectoderm [Citation3]. Trophoblast differentiation can follow one of two pathways: the villous pathway to form cytotrophoblasts (CTBs) and syncytiotrophoblasts (STBs) or the CTB cell column pathway to form extravillous CTBs [Citation4]. In terms of mediating oxygen, nutrient and waste exchange between maternal and fetal circulation, the CTBs and STBs are imperative to this process. STBs form a continuous epithelial layer on the surface of the villous tree which is maintained throughout pregnancy by continuous fusion of the underlying CTBs [Citation5]. Furthermore, STB stress is hypothesized to be a major factor associated with placental dysfunction in pregnancies complicated by PE [Citation6]. Although molecular characterization of these trophoblast differentiation pathways is beginning to be identified [Citation7], a comprehensive profile of the different trophoblast lineages across gestation, as well as how disruption to these processes occurs in complicated pregnancies, is required.
Epigenetic regulation of the placental transcriptome is emerging as an important mediator of placental cell differentiation [Citation7–Citation9]. Environmental factors such as smoking, obesity and poor nutrition which are associated with placental dysfunction are also known to impact the epigenome [Citation10,Citation11]. The most widely studied epigenetic modification in the placenta is DNA methylation: the addition of a methyl group to primarily the cytosine DNA base forming 5-methylcytosine (5-mC). DNA methylation is crucial to many cellular processes including the regulation of gene expression and genomic imprinting. The genome of the placenta is hypomethylated compared to other organs [Citation12,Citation13], however, how or why this is the case is unclear. To add complexity is the emergence of the oxidized derivative of 5-mC, 5-hydroxymethylcytosine (5-hmC) [Citation14], and the roles this modification plays in the regulation of cellular processes. Indeed, there is increasing evidence to suggest 5-hmC is not merely a passive intermediate in the DNA demethylation process but contributes its own epigenetic functions [Citation15,Citation16].
Recently, we reported that DNA methylation within the placenta could accurately predict gestational age which was accelerated in placentas from pregnancies complicated by early onset PE [Citation17]. However, studying DNA methylation in the placenta is complicated by the presence of different cell types which carry their own unique methylomes [reviewed in [Citation18] & [Citation19]]. In this study, we sought to use visualization techniques, immunohistochemistry (IHC) and immunofluorescence (IF), to characterize the localization of 5-mC and 5-hmC in healthy placenta tissue across gestation as well as in tissues from pregnancies complicated by PE. Although assessment of 5-mC and 5-hmC by whole genome sequencing approaches would be the gold standard, these methods do not allow for assessment of these DNA methylation marks within different cell types of the same tissue sample. Performing whole genome sequencing approaches on isolated cells for large sample numbers is costly and computationally difficult. We chose IHC and IF to determine both 5-mC and 5-hmC localization in different cell types within numerous placenta samples, but also because these approaches can be quantified by video image analysis [Citation20–Citation22] and laser scanning cytometry [Citation23–Citation28]. Furthermore, we aimed to determine whether localization of both markers differed between isolated CTB and STB cells with the hypothesis that the different trophoblast populations would display different staining intensities based on previously published literature [Citation29].
Methods
Tissue samples
First and second-trimester placentas were obtained with written informed consent from women undergoing elective terminations of pregnancy at the Pregnancy Advisory Centre (PAC), Woodville, South Australia with ethics approved by the Queen Elizabeth Hospital Human Research Ethics Committee (ethics number: HREC/16/TQEH/33). Term placentas were collected from women recruited as part of the Screening Tests to Predict Poor Outcomes of Pregnancy (STOP) study. The study was approved by the Women’s and Children’s Health Network Human Ethics committee (ethics number: HREC/14/WCHN/90), and all women provided written informed consent. See Supplementary Table 1 for details of samples used in this study.
Immunofluorescent labelling of 5-mC, 5-hmC, PEG-10 and PSG-1 in placenta tissue
Paraffin-embedded paraformaldehyde (first and second trimester) or formalin (term) fixed sections, cut at 3 µm thickness, were used for double-label IF or IHC. Tissue sections were dewaxed and rehydrated according to standard protocols. Antigen retrieval was performed using boiling citrate buffer (10 mM, pH 6.0) for 15 min, followed by a hydrochloric acid digestion (1.5 M) step for 30 min at room temperature. Sections were then blocked in 10% goat serum with 0.3% Triton-X in phosphate buffered saline (PBS) for 30 min to reduce non-specific binding. Antibodies were diluted in 10% bovine serum albumin (BSA) in PBS with 0.3% Triton-X as outlined in and applied to the sections in a humidified environment overnight at 4°C. For IF, antigens were visualized by applying fluorophore-conjugated anti-mouse (5-mC and PSG-1) or anti-rabbit (5-hmC and PEG-10) secondary antibodies () for 3 h at room temperature. Nuclei were counterstained using 4’,6-diamidino-2-phenylindole (DAPI). For IHC, biotin-conjugated anti-mouse or anti-rabbit secondaries () were applied for 1 h at room temperature followed by another 1 h incubation with streptavidin-horseradish peroxidase (strep-HRP; Dako). Sections were washed with PBS and staining visualized using 3,3′-diaminobenzidine (DAB; Sigma). Nuclei were counter-stained with haematoxylin.
Table 1. Antibodies and dilutions used for immunohistochemistry and immunofluorescence.
Isolation of first and second-trimester cytotrophoblast and syncytiotrophoblast cells
First-trimester CTB and STB cells were isolated from tissue following a modified protocol outlined in [Citation30,Citation31]. Initially, villous tissue was washed in 0.9% sodium chloride (NaCl) to remove maternal blood before being incubated for 10 min at 37°C with 10 mL 0.25% trypsin (Life Technologies) with 200 µg/mL DNAse (Roche) in PBS per gram of tissue. The supernatant, containing largely STB and extravillous CTB, was collected and the remaining villous tissue washed eight times with 20 mL PBS. Each wash, together with the initial digest supernatant, was passed through a 100 µm filter into a 50 mL tube containing 5 mL fetal calf serum (FCS; Sigma) to remove debris before being passed through a 70 µm filter to remove smaller contaminating cells. The filtrate was discarded, and the enriched STB population collected on the filter was used for immunofluorescent labelling.
Continuing with the CTB isolations, the remaining villous tissue was digested for a second time in 10 mL 0.25% trypsin with 200 µg/mL DNAse in PBS per gram of tissue on gentle agitation for 7 min at 4°C before being left stationary at 4°C overnight. The following morning, villi were washed 10 times in PBS and the supernatant collected into 50 mL tubes containing 5 mL FCS and centrifuged at 450xg for 8 min. Supernatant was aspirated, cell pellets combined into 15 mL per gram of tissue DMEM media (Life Technologies) containing 10% FCS and 1% Antibiotic-Antimycotic (Life Technologies) and then incubated for 10 min at 37°C in 5% CO2 on a 10 cm Petri dish to allow contaminating fibroblasts to adhere to the plastic surface. The cell suspension was collected and the Petri dishes washed twice with 5 mL DMEM media in order to maximize recovery of cytotrophoblasts which were then used for immunofluorescent staining.
For isolation of CTBs and STBs from second-trimester tissues, the protocol follows that for isolation of first trimester with slight modifications on day two of the procedure. Following the second, overnight digest, villous tissue was washed 10 times in PBS and the supernatant collected into 50 mL tubes containing 5 mL FCS. Tubes were centrifuged at 450xg for 8 min and the cells resuspended in 6 mL of 1x Ca/Mg-free Hank’s buffered saline solution (HBSS) to yield approximately 8 mL of cell suspension. The cell suspension was gently layered onto two 70–5% Percoll® gradients (Sigma) prepared in 50 mL falcon tubes and centrifuged for 20 min at 1200xg without a brake. Following centrifugation, the CTBs, situated between the layers 27 to 12 mL were collected into a clean falcon tube, washed with DMEM media and centrifuged at 1000xg for 10 min. The supernatant was aspirated, cells resuspended in 1x HBSS for cell counts and then centrifuged for another 5 min at 1000xg. Subsequently, the cells were resuspended in DMEM media to a concentration of 107 cells/mL and transferred to 1.5 mL microcentrifuge tubes for negative selection and the removal of contaminating lymphocytes and fibroblasts. As per Dynabead® protocol (Life Technologies), mouse anti-human CD9 antibody (RnD Systems) were added to each microcentrifuge tube at a concentration of 1 µg/106 cells and incubated on a rotator for 10 min at 4°C. Following incubation, anti-mouse Dynabeads® were prepared as per manufacturer’s instructions and added to the cells and incubated for a further 30 min on a rotator at 4°C to allow binding. After the incubation, microcentrifuge tubes were placed onto a magnetic separator allowing magnetic beads attached to CD+ cells to be separated from the CTB population. The supernatant containing the isolated cytotrophoblast cells was collected to be used for immunofluorescent staining.
Isolation of term cytotrophoblast cells
CTB and STB populations were isolated from term placental tissue following the protocol outlined in [Citation32]. Placental tissue was collected from elective caesarean sections, washed with 0.9% NaCl and dissected to dissociate placenta villi fragments from vessels and connective tissue. Approximately 25 g of tissue was digested three times for 20 min in 150 mL of enzyme digestion buffer containing 0.25% trypsin and 1% DNAse at 37°C in a shaking water bath. Between each digest, supernatant was collected into 50 mL tubes containing 5 mL FCS and cell pellets centrifuged at 1000xg for 15 min. Cell pellets from all three digests were combined in 1x HBSS solution and the remaining isolation protocol followed that outlined for second-trimester placenta cytotrophoblast isolations.
Immunofluorescent labelling of 5-mC, 5-hmC, PEG-10 and PSG-1 in isolated trophoblasts
Isolated CTB and STB cells were centrifuged onto slides using cytocentrifugation (6–8 x 10⁵ cells/cytospot, 1000 RPM for 5 min; CytospinTM, Thermo Fisher Scientific). Cells were then fixed with 1:1 acetone-methanol for 10 min on ice and immunostaining proceeded as previously described.
Microscopy analysis and image quantification
IHC staining of 5-mC and 5-hmC in tissue sections were visualized using the Nanozoomer 2.0-HT C9600–13 (Hamamatsu). Random systematic sampling of the tissue was used to select 10 representative fields of each section at 40x magnification using the NDP View2 software (Hamamatsu). DAB staining intensity was quantified using the VIA software (Leading Edge Software).
Analysis of 5-mC and 5-hmC in isolated cells was visualized using the Nikon Eclipse Ni-U microscope and fluorescent intensity measured using ImageJ Version 1.48 software (National Institutes of Health) [Citation33].
Double-labelling IF of PSG-1 and 5-hmC in tissue sections was analysed using an iCyte® Automated Imaging Cytometer (Thorlabs). Microscope slides containing the tissue sections were inserted into a four slide carrier. Images were obtained by scanning the tissues with 405 nm, 488 nm and 633 nm lasers to detect DAPI, PSG-1 and 5-hmC, respectively. The blue, green and long red photomultiplier tubes were utilized to collect the fluorescence from DAPI, PSG-1 and 5-hmC, respectively. The tissue sections were first localized by running a low-resolution scan with a 10x magnification prior to running a high-resolution scan on random regions of the tissue sections with a 40x magnification. An example of a scanned random region of a tissue section is shown (Supplementary Figure 1). All nuclei were identified based on their DAPI fluorescence, and a peripheral contour was set using the iCyte imaging software 7.0 to collect the green fluorescence around the nuclei. Cells were separated depending on the amount of green fluorescence for PSG-1 in their nuclear periphery, and a gating region was drawn around the STB population in a similar fashion to a cytometer. A cell gallery was generated to visually assess the proper segregation of STBs, which was achieved with >98.5% true positives. Within this STB population, the 5-hmC integral fluorescence (total amount of red fluorescence collected within nuclei) was recorded for each nucleus and standardized to the nucleus’ DAPI integral. A minimum of 3000 STBs were analysed per tissue section.
Statistics
All statistical analyses were performed in R (v3.1.1) [Citation34]. Analysis of Variance (ANOVA) with a Tukey post-hoc comparison or Mann-Whitney test was used to calculate exact P-values and results are reported as median and interquartile range. Statistical significance was considered at P < 0.05.
Results
Identification and isolation of CTB and STB cells
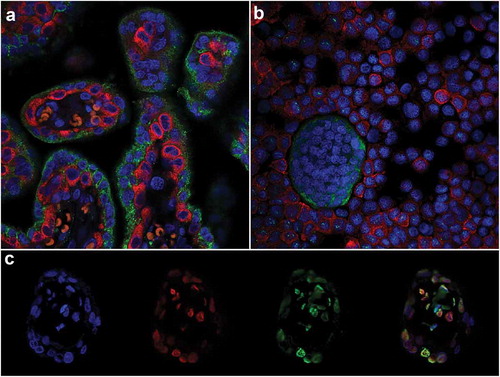
Double-labelled IF was used to identify CTB and STB cells in tissue sections using antibodies against two proteins: Paternally expressed gene 10 (PEG-10) and Pregnancy-specific beta-1-glycoprotein 1 (PSG-1), respectively. These proteins are expressed by CTBs (PEG-10) [Citation35] and STBs (PSG-1) [Citation36], allowing the two cell types to be clearly distinguished ()) and purity to be confirmed ()). Furthermore, double-labelled IF revealed punctate staining of both 5-mC and 5-hmC and confirmed co-localization of both markers ()). Double-labelled IF also showed that 5-mC and 5-hmC were not present in all cells at the same level and that some cells predominantly contained only one of these DNA methylation marks ()).
Figure 1. Immunofluorescent double-labelling in the placenta. (a) & (b). Paternally expressed gene 10 (PEG-10; cytotrophoblasts RED) and Pregnancy-specific beta-1-glycoprotein 1 (PSG-1; syncytiotrophoblasts GREEN) in an 8 weeks’ gestation placenta tissue section (a) and trophoblast cells isolated from 15 weeks’ gestation tissue (b). (c). Double-labelling of 5-mC and 5-hmC in a first-trimester placental villous; L-R: 4’,6-Diamidino-2’-phenylindole (DAPI; Blue, Nuclei), 5-hydroxymethylcytosine (5-hmC; Red), 5-methylcytosine (5-mC; Green) and all three images merged.
Comparison of 5-mC and 5-hmC expression in the placenta across gestation
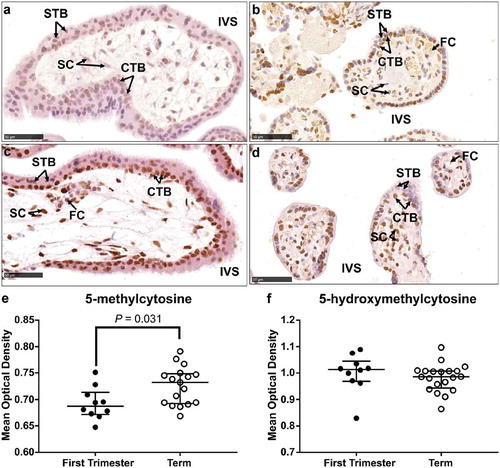
IHC analysis of 5-mC and 5-hmC in first-trimester placenta sections revealed localization of both markers predominantly in the CTB layer as well as the stromal cells and some STBs (Supplementary Figure 2 and 3). Localization in term tissue sections showed a similar pattern with positive staining in CTBs, STBs and stromal cells indicating that localization of these markers did not change across gestation (Supplementary Figure 2 and 3). DNA methylation in the placenta has previously been shown to increase across gestation until term [Citation13,Citation37,Citation38] and IHC staining of 5-mC confirmed increased staining intensity in term tissue compared to first trimester (,b&e), P = 0.031). Global IHC staining intensity of 5-hmC did not differ between tissues from first trimester compared to term (,d&f)). However, this analysis did not delineate between the different cell types of the placenta.
Figure 2. Immunohistochemical labelling of 5-methylcytosine (5-mC) and 5-hydroxymethylcytosine (5-hmC) in first trimester and term tissue sections. (a) & (b). Representative images of 5-mC labelling in a first-trimester section and term tissue section, respectively. (c) & (d). Representative images of 5-hmC labelling in a first-trimester section and term tissue section, respectively. (e). Video image analysis (VIA) quantification of staining intensity revealed an increase in levels of 5-mC in tissue sections from term placenta (n = 17) compared to first trimester (n = 10). (f). There was no difference in the staining intensity of 5-hmC between first trimester (n = 10) and term tissue (n = 17) sections. Data are median and interquartile range. Significance was determined using a Mann-Whitney test. CTB: cytotrophoblast, FC: fetal capillary, IVS: intervillous space, SC: stromal cell, STB: syncytiotrophoblast.
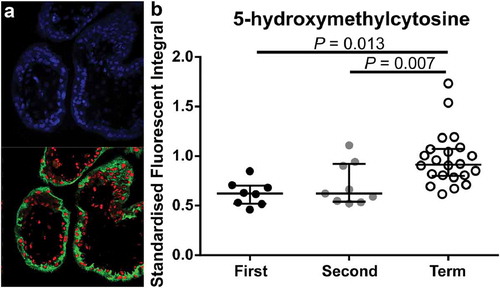
To determine whether staining intensity was similar in the different trophoblast subpopulations, CTB and STB cells were isolated from first and second trimester tissues, as well as term tissues, and stained using IF (). In first and second trimester isolated cells, mean fluorescent intensity (MFI) of 5-mC was not different between CTBs and STBs (,&)) however, MFI of 5-hmC was significantly higher in STBs (,&), P = 0.0011). Despite a small sample size, further analysis of the difference between 5-hmC staining in CTBs compared to STBs revealed the increase was primarily due to cells collected from second trimester (≥13 weeks’ gestation) tissue (Supplementary Figure 4). When comparing across gestation, as expected, MFI of 5-mC was significantly higher in CTB cells isolated from term tissue when compared to first- and second-trimester CTBs (), P = 0.0021 and P = 0.0006, respectively). However, 5-hmC staining intensity was also higher in CTBs isolated from term tissue (), P = 0.0005 (first trimester vs. term) and P = 0.0027 (second trimester vs. term)) indicating a difference in 5-hmC levels within this trophoblast subtype. As STBs were not readily obtained from term isolations, analysis of 5-hmC levels within STBs was performed using double-labelling of tissue sections () and confirmed that 5-hmC staining intensity was higher in STBs at term when compared to first and second trimester tissue (), P = 0.007 and P = 0.013, respectively).
Figure 3. Immunofluorescent labelling of 5-methylcytosine (5-mC) and 5-hydroxymethylcytosine (5-hmC) in cytotrophoblast (CTB) and syncytiotrophoblast (STB) cells isolated from first (6–12 weeks’ gestation) and second trimester (13–22 weeks’ gestation) and term placenta tissue. (a) & (b). Representative images of 4’,6-Diamidino-2’-phenylindole (DAPI; Blue, Nuclei) and 5-mC (Green) staining in cells from second trimester (15 weeks’ gestation) and term, respectively. (c) & (d). Representative images of DAPI (Blue) and 5-hmC (Red) staining in cells from first trimester (7 weeks’ gestation) and term, respectively. (e) & (f). Quantification of staining intensity using ImageJ image analysis software comparing 5-mC and 5-hmC, respectively, between first and second-trimester CTBs and STBs revealed no difference in 5-mC between the trophoblast subtypes however, 5-hmC staining was greater in STBs compared to CTBs. Red dots indicate cells collected from first-trimester placenta tissue whilst black/white dots indicate cells collected from second-trimester tissue. (g) & (h). Increase in levels of both 5-mC and 5-hmC, respectively, were found in CTB cells isolated from term tissue compared to both first and second trimester. Data are median and interquartile range. Significance was determined using a Mann-Whitney test (e & f) or an ANOVA with Tukey posthoc comparison (g & h).
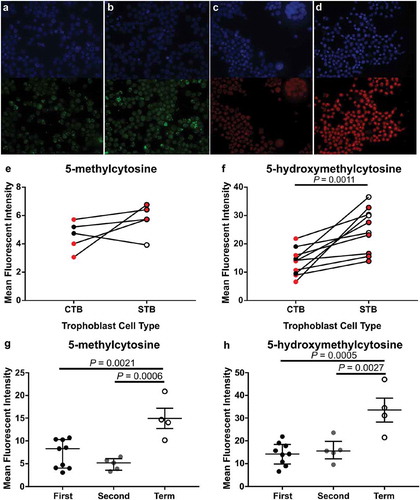
Figure 4. Immunofluorescent labelling of 4’,6-Diamidino-2’-phenylindole (DAPI; Blue, Nuclei), 5-hydroxymethycytosine (5-hmC; Red) and Pregnancy-specific beta-1-glycoprotein 1 (PSG-1; Green, syncytiotrophoblasts (STB)). (a). Representative image of PSG-1 and 5-hmC in a first-trimester placenta tissue section. (b). Quantification of 5-hmC in STB cells across gestation using laser scanning confocal microscopy showed a significant increase in 5-hmC staining intensity in term STBs compared to first and second trimester STBs. Data are median and interquartile range. Significance was determined using an ANOVA with Tukey post-hoc comparison.
Assessment of 5-mC and 5-hmC in placenta tissue from pregnancies complicated by PE
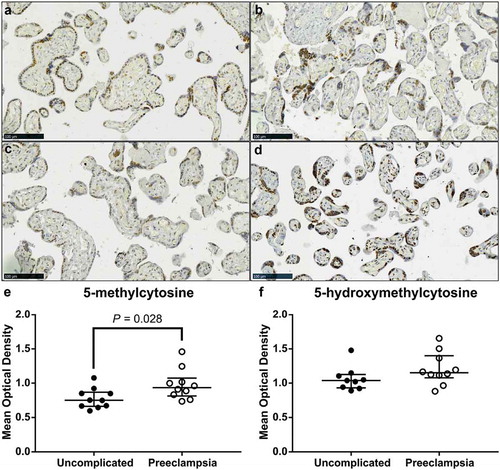
DNA methylation profiles are different in placentas from pregnancies complicated by PE compared to uncomplicated pregnancies [Citation37,Citation39–Citation41]. Thus, we sought to determine whether there was a difference in 5-mC and 5-hmC staining between term placenta tissue collected from uncomplicated and PE pregnancies. Localization of both 5-mC and 5-hmC did not appear to change between placenta tissues from PE pregnancies compared to uncomplicated; STBs, CTBs and stromal cells stained positively (–)). However, IHC staining intensity of 5-mC was significantly higher in placenta tissue from PE pregnancies compared to uncomplicated (), P = 0.028) whilst 5-hmC staining intensity did not differ ()).
Figure 5. Video image analysis (VIA) of immunohistochemical staining of 5-methylcytosine (5-mC) and 5-hydroxymethylcytosine (5-hmC) in term placenta sections from pregnancies complicated by preeclampsia (PE) and uncomplicated. (a) & (c). Representative images of 5-mC staining in placenta samples from uncomplicated and PE pregnancies, respectively. (b) & (d). Representative images of 5-hmC staining in placenta in an uncomplicated and PE pregnancy, respectively. (e). Intensity of 5-mC staining was greater in tissue sections from PE pregnancies compared to uncomplicated. (f). Staining intensity of 5-hmC did not differ. Data are median and interquartile range. Significance was determined using a Mann-Whitney test.
Discussion
Studying DNA methylation in the placenta is complicated by the presence of numerous different cell types, each with their own unique and specific function and hence molecular and epigenetic profile. We sought to overcome this by using visualization techniques to assess localization of DNA methylation markers 5-mC and 5-hmC in specific compartments of the placental tissue and trophoblast cells across gestation. Our assessment revealed changes to levels of both markers across gestation as well as between different trophoblast cell types at the same gestation. This preliminary data provide a platform for further work into elucidating how changes to epigenetic modifications, including 5-mC and 5-hmC contribute to placental pathology and pregnancy complications.
To our knowledge, there has only been one other study that has used IHC to assess 5-mC and 5-hmC localization in human placental tissue [Citation29]. Fogarty et al. observed differences in the levels of 5-mC and 5-hmC in CTBs compared to STBs in tissue sections across gestation. 5-mC was more abundant in CTBs whilst STBs showed greater staining for 5-hmC. Indeed, in the current study, STBs isolated from first and second-trimester tissue had a higher staining intensity of 5-hmC compared to CTBs isolated from the same samples. However, 5-mC was also abundantly expressed within STB cells with a moderate increase in levels compared to CTBs. Differences between the two studies may be explained by different 5-mC antibodies, staining protocols and that levels were measured in isolated cells, not tissue sections. Furthermore, we used a more sensitive method of detection and quantification in IF. What both studies do highlight, however, is that the methylomes of the different trophoblast cell types may vary substantially. Thus, further research into the biological importance of these differences is warranted. This is supported by recent single-cell RNAseq data that showed different trophoblast cell populations have their own unique transcriptome profile [Citation7,Citation42,Citation43]. This is consistent with studies that have used an array approach in whole term placenta tissue and found a negative correlation between 5-mC and 5-hmC for the majority of array probes [Citation44,Citation45].
Of relevance to placental dysfunction is the observation that the staining intensity of 5-mC was higher in placenta tissue sections collected from PE pregnancies compared to uncomplicated. DNA methylation patterns, determined using arrays, have been shown to be different in placentas from PE pregnancies [Citation39–Citation41] as well as in placentas from other pregnancy complications [Citation46–Citation48] compared to uncomplicated. However, whether or not these changes in DNA methylation result in differences in gene expression is conflicting [Citation37,Citation41]. This may be explained, in part, by the fact that DNA was extracted from whole tissue homogenates. The aetiology of PE that is characterized by placental dysfunction suggests STB stress to be a significant factor [Citation6]. Future experiments include analysing both DNA methylation profiles and gene expression patterns within the STB cell type across gestation and assessing changes to these molecular profiles in pregnancy complications. Such research is integral to forming the basis of our understanding of what governs molecular and cellular changes within trophoblast cells providing a solid foundation for better understanding of what occurs in pathological pregnancies.
One of the most exciting findings pertaining to this study is the increased staining intensity of 5-hmC in CTB and STB cells across gestation. Oxidation of 5-mC to form 5-hmC is mediated by the Ten-eleven translocation (TET) enzymes and knockdown models of these enzymes have shown 5-hmC to be central in maintaining developmental pathways and early embryogenesis [Citation49,Citation50]. Furthermore, there is a strong association between active transcription and genomic regions with elevated 5-hmC levels [Citation15], 5-hmC is known to localize to DNA damage and promote genome stability [Citation51], and progressive loss of 5-hmC is a hallmark of tumorigenesis [Citation52]. Thus, there is accumulating evidence suggesting that perturbations to this DNA methylation modification may contribute significantly to disease phenotypes and genomic instability. Recently, it has been shown that TET1–3 are expressed in STB in first trimester and term placenta tissue but only TET3 was expressed in CTB [Citation53]. This may indicate that the increase in 5-hmC seen across gestation in our study may be due to the differential expression of these TET enzymes. The relevance of changes in 5-hmC levels across gestation in CTB and STB cells to trophoblast differentiation or function cannot be determined.
In addition, there was no difference in staining intensity of 5-hmC in tissue sections from PE placentas compared to uncomplicated. This is in contrast to Li et al [Citation54], which reported a decrease in TET2 protein and 5-hmC in placentas from severe PE compared to uncomplicated pregnancies. The difference with our study was that our cases of PE were not severe and VIA was used to quantitate 5-hmC compared to the dot-blot assay used in the previously mentioned study. One disadvantage to using VIA to quantify staining intensity is the inability to differentiate staining in different cell types easily. Indeed visually, the staining intensity of 5-hmC appeared greater in the syncytial knots of the PE tissue sections compared to uncomplicated.
One of the major advantages in using IHC and IF was the ability to visually assess which cell types expressed 5-mC and 5-hmC within the placenta across gestation. Within this study, we observed clear changes to the levels of both markers which was confirmed using quantification analyses. However, the quantification of IHC and IF staining is inherently difficult due to a number of assumptions [Citation55]. For example, quantification assumes a linear relationship between antigen-antibody binding; more antigen leads to more antibody binding and results in a greater visual signal either in the presence of darker staining or greater fluorescent intensity. Such assumptions cannot easily be validated and thus experiments using more sensitive techniques such as methylation sequencing should be undertaken to confirm what has been presented. Never-the-less, the current study provides substantial evidence that epigenetic profiles can differ significantly between different cell types within a complex tissue and reinforces the need to focus DNA methylation sequencing experiments on single cell populations rather than whole tissue extracts.
Supplemental Material
Download MS Word (2 MB)Supplemental Material
Download MS Excel (19.5 KB)Acknowledgements
We would like to thank the staff at the Pregnancy Advisory Centre for their assistance in patient recruitment and placenta tissue collection. This work was supported by a National Institute of Health NICHD project grant awarded to CTR and TBM (R01HD089685). CTR is supported by a Lloyd Cox Professorial Research Fellowship, University of Adelaide. RLW is supported by an Australian Postgraduate Award.
Disclosure statement
No potential conflict of interest was reported by the authors.
Supplementary material
Supplemental data for this article can be accessed here.
Additional information
Funding
References
- Roberts CT. IFPA award in placentology lecture: complicated interactions between genes and the environment in placentation, pregnancy outcome and long term health. Placenta. 2010;31(Suppl):S47–53.
- Brosens I, Pijnenborg R, Vercruysse L, et al. The “Great obstetrical syndromes” are associated with disorders of deep placentation. Am J Obstet Gynecol. 2011;204(3):193–201.
- Red-Horse K, Zhou Y, Genbacev O, et al. Trophoblast differentiation during embryo implantation and formation of the maternal-fetal interface. J Clin Invest. 2004;114(6):744–754.
- Gude NM, Roberts CT, Kalionis B, et al. Growth and function of the normal human placenta. Thromb Res. 2004;114(5–6):397–407.
- Galton M. DNA content of placental nuclei. J Cell Biol. 1962;13:183–191.
- Redman C, Sargent I, Staff A. IFPA senior award lecture: making sense of pre-eclampsia–two placental causes of preeclampsia? Placenta. 2014;35:S20–S25.
- Okae H, Toh H, Sato T, et al. Derivation of human trophoblast stem cells. Cell Stem Cell. 2018;22(1):50–63 e6.
- Yuen RK, Chen B, Blair JD, et al. Hypoxia alters the epigenetic profile in cultured human placental trophoblasts. Epigenetics. 2013;8(2):192–202.
- Novakovic B, Evain-Brion D, Murthi P, et al. Variable DAXX gene methylation is a common feature of placental trophoblast differentiation, preeclampsia, and response to hypoxia. FASEB J. 2017;31(6):2380–2392.
- Tarrade A, Panchenko P, Junien C, et al. Placental contribution to nutritional programming of health and diseases: epigenetics and sexual dimorphism. J Exp Biol. 2015;218(Pt 1):50–58.
- Vickers MH. Early life nutrition, epigenetics and programming of later life disease. Nutrients. 2014;6(6):2165–2178.
- Ehrlich M, Gama-Sosa MA, Huang L-H, et al. Amount and distribution of 5-methylcytosine in human DNA from different types of tissues or cells. Nucleic Acids Res. 1982;10(8):2709–2721.
- Fuke C, Shimabukuro M, Petronis A, et al. Age related changes in 5‐methylcytosine content in human peripheral leukocytes and placentas: an HPLC‐based study. Ann Hum Genet. 2004;68(3):196–204.
- Hernando-Herraez I, Garcia-Perez R, Sharp AJ, et al. DNA methylation: insights into human evolution. PLoS Genet. 2015;11(12):e1005661.
- Johnson KC, Houseman EA, King JE, et al. 5-Hydroxymethylcytosine localizes to enhancer elements and is associated with survival in glioblastoma patients. Nat Commun. 2016;7:13177.
- Zhu Q, Stöger R, Alberio R. A lexicon of DNA modifications: their roles in embryo development and the germline. Front Cell Dev Biol. 2018;6:24.
- Mayne BT, Leemaqz SY, Smith AK, et al. Accelerated placental aging in early onset preeclampsia pregnancies identified by DNA methylation. Epigenomics. 2017;9(3):279–289.
- Bianco-Miotto T, Mayne BT, Buckberry S, et al. Recent progress towards understanding the role of DNA methylation in human placental development. Reproduction. 2016;152(1):R23–30.
- Robinson WP, Price EM. The human placental methylome. Cold Spring Harb Perspect Med. 2015;5(5)a023044.
- Bianco-Miotto T, Chiam K, Buchanan G, et al. Global levels of specific histone modifications and an epigenetic gene signature predict prostate cancer progression and development. Cancer Epidemiol Biomarkers Prev. 2010;19(10):2611–2622.
- Highet AR, Khoda SM, Buckberry S, et al. Hypoxia induced HIF-1/HIF-2 activity alters trophoblast transcriptional regulation and promotes invasion. Eur J Cell Biol. 2015;94(12):589–602.
- Wilson RL, Leemaqz SY, Goh Z, et al. Zinc is a critical regulator of placental morphogenesis and maternal hemodynamics during pregnancy in mice. Sci Rep. 2017;7(1):15137.
- Francois M, Fenech MF, Thomas P, et al. High content, multi-parameter analyses in buccal cells to identify Alzheimer‘s disease. Curr Alzheimer Res. 2016;13(7):787–799.
- Francois M, Hochstenbach K, Leifert W, et al. Automation of the cytokinesis-block micronucleus cytome assay by laser scanning cytometry and its potential application in radiation biodosimetry. Biotechniques. 2014;57(6):309–312.
- Francois M, Leifert W, Hecker J, et al. Altered cytological parameters in buccal cells from individuals with mild cognitive impairment and Alzheimer‘s disease. Cytometry A. 2014;85(8):698–708.
- Francois M, Leifert WR, Tellam R, et al. Folate deficiency and DNA-methyltransferase inhibition modulate G-quadruplex frequency. Mutagenesis. 2016;31(4):409–416.
- Leifert WR, Francois M, Thomas P, et al. Automation of the buccal micronucleus cytome assay using laser scanning cytometry. Methods Cell Biol. 2011;102:321–339.
- Wylie PG, Onley DJ, Hammerstein AF, et al. Advances in laser scanning imaging cytometry for high-content screening. Assay Drug Dev Technol. 2015;13(2):66–78.
- Fogarty NM, Burton GJ, Ferguson-Smith AC. Different epigenetic states define syncytiotrophoblast and cytotrophoblast nuclei in the trophoblast of the human placenta. Placenta. 2015;36(8):796–802.
- James JL, Hurley DG, Gamage TK, et al. Isolation and characterisation of a novel trophoblast side-population from first trimester placentae. Reproduction. 2015;150(5):449–462.
- Jankovic-Karasoulos T, McAninch D, McCullough D, et al. Isolation of villous cytotrophoblasts from second trimester human placentas. Placenta. 2018;74:55–58.
- Kaitu‘u-Lino TJ, Tong S, Beard S, et al. Characterization of protocols for primary trophoblast purification, optimized for functional investigation of sFlt-1 and soluble endoglin. Pregnancy Hypertens. 2014;4(4):287–295.
- Jensen EC. Quantitative analysis of histological staining and fluorescence using Image. J Anat Rec (Hoboken). 2013;296(3):378–381.
- Team RDC. R: A language and environment for statistical computing. Vienna, Austria: R Foundation for Statistical Computing; 2011.
- Liang XY, Chen X, Jin YZ, et al. Expression and significance of the imprinted gene PEG10 in placenta of patients with preeclampsia. Genet Mol Res. 2014;13(4):10607–10614.
- Horne CH, Towler CM, Pugh-Humphreys RG, et al. Pregnancy specific beta1-glycoprotein – a product of the syncytiotrophoblast. Experientia. 1976;32(9):1197.
- Novakovic B, Yuen RK, Gordon L, et al. Evidence for widespread changes in promoter methylation profile in human placenta in response to increasing gestational age and environmental/stochastic factors. BMC Genomics. 2011;12:529.
- Price EM, Cotton AM, Penaherrera MS, et al. Different measures of “genome-wide” DNA methylation exhibit unique properties in placental and somatic tissues. Epigenetics. 2012;7(6):652–663.
- Anton L, Brown AG, Bartolomei MS, et al. Differential methylation of genes associated with cell adhesion in preeclamptic placentas. PLoS One. 2014;9(6):e100148.
- Hogg K, Blair JD, McFadden D. E., et al. Early onset pre-eclampsia is associated with altered DNA methylation of cortisol-signalling and steroidogenic genes in the placenta. PLoS One. 2013;8(5):e62969.
- Chu T, Bunce K, Shaw P, et al. Comprehensive analysis of preeclampsia-associated DNA methylation in the placenta. PLoS One. 2014;9(9):e107318.
- Pavlicev M, Wagner GP, Chavan AR, et al. Single-cell transcriptomics of the human placenta: inferring the cell communication network of the maternal-fetal interface. Genome Res. 2017;27(3):349–361.
- Tsang JC, Vong JS, Ji L, et al. Integrative single-cell and cell-free plasma RNA transcriptomics elucidates placental cellular dynamics. Proc Nat Acad Sci. 2017;114(37):E7786–E7795.
- Green BB, Houseman EA, Johnson KC, et al. Hydroxymethylation is uniquely distributed within term placenta, and is associated with gene expression. FASEB J. 2016;30(8):2874–2884.
- Hernandez Mora JR, Sanchez-Delgado M, Petazzi P, et al. Profiling of oxBS-450K 5-hydroxymethylcytosine in human placenta and brain reveals enrichment at imprinted loci. Epigenetics. 2018;13(2):182–191.
- Finer S, Mathews C, Lowe R, et al. Maternal gestational diabetes is associated with genome-wide DNA methylation variation in placenta and cord blood of exposed offspring. Hum Mol Genet. 2015;24(11):3021–3029.
- Ruchat SM, Houde AA, Voisin G, et al. Gestational diabetes mellitus epigenetically affects genes predominantly involved in metabolic diseases. Epigenetics. 2013;8(9):935–943.
- Hillman SL, Finer S, Smart MC, et al. Novel DNA methylation profiles associated with key gene regulation and transcription pathways in blood and placenta of growth-restricted neonates. Epigenetics. 2015;10(1):50–61.
- Gu TP, Guo F, Yang H, et al. The role of Tet3 DNA dioxygenase in epigenetic reprogramming by oocytes. Nature. 2011;477(7366):606–610.
- Koh KP, Yabuuchi A, Rao S, et al. Tet1 and Tet2 regulate 5-hydroxymethylcytosine production and cell lineage specification in mouse embryonic stem cells. Cell Stem Cell. 2011;8(2):200–213.
- Kafer GR, Li X, Horii T, et al. 5-Hydroxymethylcytosine marks sites of DNA damage and promotes genome stability. Cell Rep. 2016;14(6):1283–1292.
- Jin SG, Jiang Y, Qiu R, et al. 5-Hydroxymethylcytosine is strongly depleted in human cancers but its levels do not correlate with IDH1 mutations. Cancer Res. 2011;71(24):7360–7365.
- Rakoczy J, Padmanabhan N, Krzak AM, et al. Dynamic expression of TET1, TET2, and TET3 dioxygenases in mouse and human placentas throughout gestation. Placenta. 2017;59:46–56.
- Li X, Wu C, Shen Y, et al. Ten-eleven translocation 2 demethylates the MMP9 promoter, and its down-regulation in preeclampsia impairs trophoblast migration and invasion. J Biol Chem. 2018;293(26):10059–10070.
- Hamilton N. Quantification and its applications in fluorescent microscopy imaging. Traffic. 2009;10(8):951–961.