
ABSTRACT
DNA methylation is an epigenetic mechanism important for the regulation of gene expression, which plays a vital role in the interaction between genetic and environmental factors. Aberrant epigenetic changes are implicated in the pathogenesis of diabetes and diabetic complications, but the role of DNA methylation in diabetic peripheral neuropathy (DPN) is not well understood. Therefore, our aim in this study was to explore the role of DNA methylation in the progression of DPN in type 2 diabetes. We compared genome-wide DNA methylation profiles of human sural nerve biopsies from subjects with stable or improving nerve fibre counts to biopsies from subjects with progressive loss of nerve fibres. Nerve fibre counts were determined by comparing myelinated nerve fibre densities between an initial and repeat biopsy separated by 52 weeks. Subjects with significant nerve regeneration (regenerators) and subjects with significant nerve degeneration (degenerators) represent the two extreme DPN phenotypes. Using reduced representation bisulfite sequencing, we identified 3,460 differentially methylated CpG dinucleotides between the two groups. The genes associated with differentially methylated CpGs were highly enriched in biological processes that have previously been implicated in DPN such as nervous system development, neuron development, and axon guidance, as well as glycerophospholipid metabolism and mitogen-activated protein kinase (MAPK) signalling. These findings are the first to provide a comprehensive analysis of DNA methylation profiling in human sural nerves of subjects with DPN and suggest that epigenetic regulation has an important role in the progression of this prevalent diabetic complication.
Introduction
In 2017, it was estimated that 451 million people worldwide suffer from diabetes, including 30 million Americans [Citation1,Citation2], with type 2 diabetes (T2D) accounting for approximately 90% to 95% of the diagnosed cases. T2D is primarily characterized by hyperglycaemia, hyperlipidaemia, and insulin resistance [Citation3]. Both subjects with type 1 (T1D) and T2D experience diabetes-related microvascular complications which have a negative impact on the quality of life and affect multiple tissues including the nerve (diabetic neuropathy), kidney (diabetic nephropathy) and eye (diabetic retinopathy) [Citation4]. Diabetic neuropathy is the most common microvascular complication of both T1D and T2D and can present in multiple ways, including small-fibre predominant neuropathy or autonomic neuropathy. However, diabetic peripheral neuropathy (DPN), a distal symmetric small and large fibre sensory-predominant neuropathy, is the most common type of diabetic neuropathy affecting the peripheral nervous system [Citation5,Citation6]. Affecting an estimated 50% of the patients with diabetes, DPN is a chronic, symmetrical, progressive disorder of the peripheral nervous system with early symptoms of pain, allodynia, and paraesthesias [Citation7]. DPN initially affects the longest axons in the extremities and progresses in a distal to proximal, ‘stocking-glove’ pattern. The principal pathological abnormalities in DPN are axonal degeneration and segmental demyelination [Citation8]. The sural nerve is a sensory nerve in the calf and quantitation of myelinated fibre density (MFD) of the sural nerve is considered one of the most reliable criteria for neuropathy diagnosis [Citation9].
The pathogenesis of T2D and DPN is largely driven by lifestyle factors such as limited physical activity and poor diet [Citation10]. However, there is a clear polygenic risk to developing T2D and DPN [Citation11,Citation12], and growing evidence suggests that in response to behavioural and environmental stressors, epigenetic mechanisms also contribute significantly to diabetes and its complications [Citation13–Citation15]. Indeed, epigenetic modifications are hypothesized as a way to bridge the gap between lifestyle factors and genetics [Citation16]. In contrast to genetic alterations, epigenetic mechanisms regulate gene expression without changes in the underlying DNA sequence [Citation17]. Aberrant epigenetic modifications, including DNA methylation, post-translational modifications of histones, chromatin remodelling, and non-coding RNAs [Citation18], result in the dysregulation of up to 10% of the genes in humans [Citation18,Citation19].
DNA methylation refers to the covalent attachment of a methyl group to a cytosine adjacent to a guanine (CpG) by DNA methyltransferases [Citation20]. While most commonly occurring in the promoter region of a gene, DNA methylation can also occur in various other genetic locations, including exons, introns, or even non-transcribed intergenic regions [Citation21]. DNA methylation may have different influences on gene expression dependent upon where methylation takes place in the gene sequence [Citation22,Citation23]. DNA methylation is involved in the regulation of gene expression, maintenance of DNA structure, and control of transposable elements [Citation24]; therefore, it plays an important role in many biological functions, including tissue differentiation and disease susceptibility [Citation25,Citation26]. Differential DNA methylation is also implicated in T2D development, insulin resistance, and obesity and may contribute to an intermediate stage of T2D pathogenesis [Citation18,Citation27,Citation28]. Altered DNA methylation patterns are observed in multiple tissues of subjects with T2D compared to healthy controls [Citation22,Citation29–Citation31]. Additionally, genome-wide and gene-specific studies support the idea that aberrant DNA methylation contributes to macro- and microvascular complications in diabetic subjects [Citation32–Citation34], and changes in DNA methylation are reported in other diabetic microvascular complications, such as in the kidneys of subjects with diabetic nephropathy [Citation33,Citation35] and in the blood of patients with diabetic retinopathy [Citation34]. Furthermore, DNA methylation is associated with DPN in the transcriptional analysis of mouse models [Citation3]. However, genome-wide DNA methylation patterns in subjects with DPN remain unexplored.
In this study, our aim was to explore the role of DNA methylation in the progression of DPN in T2D. Using reduced representation bisulfite sequencing (RRBS), we compared genome-wide DNA methylation in sural nerve biopsies obtained from subjects with T2D and either stable or improving DPN to subjects with progressive and worsening DPN. Our study provides the first comprehensive analysis of nerve-specific DNA methylation profiles and identifies a role for epigenetic regulation of previously implicated genes and pathways in nerve degeneration in T2D and DPN. Additionally, it identifies possible targets for the development of much-needed therapies for this common, morbid diabetic complication.
Results
Study population and genome-wide DNA methylation profiling
To identify pathways that are altered by epigenetic regulation in DPN, we first established genome-wide methylation patterns using RRBS in sural nerves samples from 12 DPN subjects from a larger double-blind placebo-controlled clinical trial where there was no effect of treatment [Citation36,Citation37]. Sural nerve samples were from subjects who had significant nerve degeneration (degenerators, n = 6) or regeneration (regenerators, n = 6) over a 52-week period as measured by myelinated fibre density (MFD). Subject characteristics and neuropathy phenotyping are presented in and . In total, an average of 88.2 million aligned reads were generated for each sample, with read lengths up to 48 bps, of which about 51.5 million could be uniquely mapped to the hg19 reference genome (unique mapping rate ranging from 56% to 60.9%). The overall percentage of methylated CpG sites ranged between 32.2% and 41.0% across the 12 samples (Supplemental Table S1), with no significant difference between degenerators and regenerators.
Table 1. Subject characteristics.
Table 2. Subject neuropathy phenotyping.
Sample information, alignment, and final cytosine methylation summary
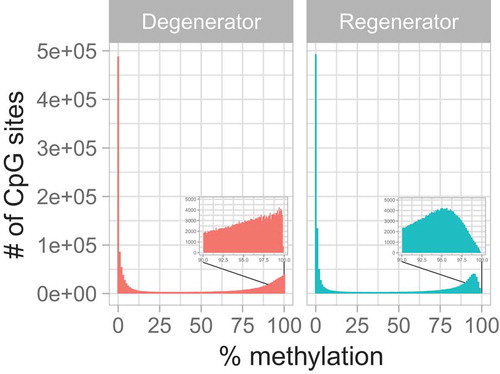
Sample read coverage distribution per base as determined by methylKit [Citation38] analysis of sequence alignment/map (SAM) data confirmed that the results had little to no PCR duplication bias, as no secondary peak was observed near the right side of the histograms (Supplemental Figure S1). A total of 1,527,600 CpG sites (excluding CpG sites in chromosomes X and Y) were identified across all 12 samples. Methylated CpG sites were classified by methylation levels into five sets: <5%, <10%, 10–90%, >90%, and >95% CpGs (Supplemental Table S2). More than half of the methylated CpG sites in each sample showed less than 10% methylation, regardless of the subject groups (P = 0.9). However, there was a significant difference in CpG sites with >95% methylation between the two groups (P = 0.0085), where the degenerators had greater overall hyper-methylation of CpG sites compared to regenerators (). The DNA methylation clustering patterns identified by Ward’s hierarchical clustering methods illustrate that regenerator samples, and to a lesser extent degenerator samples, were tightly clustered, suggesting a distinct methylation footprint in regenerators vs. degenerators (Supplemental Figure S2).
Figure 1. Distribution of percentage methylation within groups. This histogram illustrates the overall distribution of the percent methylation of the measured 1,527,600 CpG sites. The boxes within each panel represent zoomed-in images covering the percent methylation between 90% and 100%.
Differential CpG methylation in degenerator versus regenerator sural nerve tissue
Using methylKit analysis of SAM data, we next determined the locations of differential DNA methylation in sural nerves of subjects with DPN. We identified a total of 3,460 differentially methylated CpGs (DMCpGs; 1,913 hypo-methylated and 1,547 hyper-methylated) using the regenerator group as reference (Supplemental Table S3). The numbers of DMCpGs per chromosome ranged between 67 and 293; however, there was no difference in DMCpG distribution (per one million base pairs) between chromosomes (Supplemental Figure S3 and supplemental Table S4).
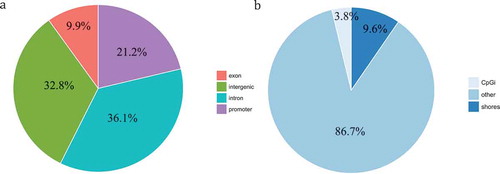
Effects on gene expression are dependent on the location of DNA methylation within the gene sequence [Citation22]. We therefore next determined which parts of the genome were affected by altered methylation using genomation [Citation39] tool. Approximately 21.2% of DMCpGs were located in promoter regions, 9.9% in exons, 36.1% in introns, and 32.8% in intergenic regions ()). The distribution of the DMCpG sites in relation to CpG islands (regions along the genome with a high number of CpG sites; GC fractions >0.5, lengths >200 bp, and a ratio of observed-to-expected CpG > 0.6) is shown in ). We found 130 CpG sites (3.8%) in CpG islands, and 331 CpG (9.6%) sites in CpG shores (regions within 2 kb of a CpG island). Moreover, approximately 86.7% of DMCpGs were found in non-CpG-rich regions, which were >2 kb from a CpG island (denoted as ‘other’ in the figure).
Figure 2. Distribution of DMCpGs (degenerators compared to regenerators) according to the gene region. (a) Pie chart showing the percentage of DMCpGs located in promoters, exons, introns, and intergenic regions. (b) Pie chart showing the percentage of DMCpGs located in CpG islands (CpGi), CpG shores (regions within 2 kb of a CpG island), and others.
Annotating differential methylation events
To better understand how DMCpGs may result in functional changes in the genome, using genomation analysis DMCpGs were mapped to 2,835 unique genes on the basis of their genomic location to identify hypo- or hyper-methylated genes (Supplemental Table S3). Among the observed DMCpGs, 1,913 corresponded to 1,607 unique genes exhibiting hypo-methylation, while 1,547 DMCpGs corresponded to 1,352 unique genes exhibiting hyper-methylation in degenerator samples compared to regenerator samples. The top 15 most differentially methylated CpGs and their annotated genes (DMGs) are presented in and include multiple non-coding and microRNAs (miRNAs) as well as coding genes. Among all differentially methylated genes (DMGs), 102 genes (represented by 102 Ensemble transcript IDs) did not have valid official gene symbols and were therefore removed from further analyses. Of the remaining genes, 516 included two or more DMCpGs. Moreover, 1,295 out of 2,835 genes had DMCpGs located within a 5 kb distance from their transcript start sites (TSSs) (DMCpGs located primarily within promotor and enhancer regions).
Table 3. Top 15 differentially methylated CpGs and their annotated genes.
Enriched biological functions among DMCpGs
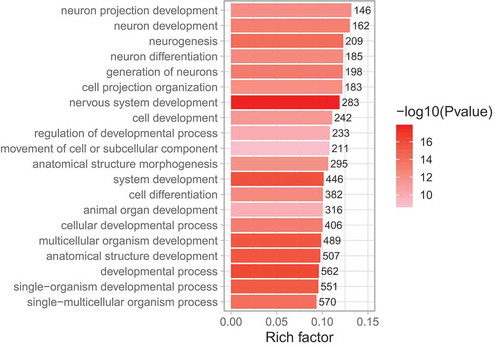
To determine potential biological functions of the identified DMCpGs and their corresponding DMGs, enrichment analysis was performed on DMGs using Gene Ontology (GO) terms and Kyoto Encyclopedia of Genes and Genomes (KEGG) pathways. Using GO analysis, DMGs in degenerators compared to regenerators were primarily involved in biological processes related to the nervous system, such as ‘nervous system development’, ‘neuron development’, and ‘neuron differentiation’ (; Supplemental Table S5). Within these pathways, top DMGs included genes highly involved in nerve function and repair, such as netrin-4 and dihydropyrimidinase like 2.
Figure 3. GO enrichment analysis of sural nerve DMGs (degenerators compared to regenerators). The top 20 most significantly enriched GO terms among DMGs are shown. Rich factor is the proportion of DMGs to all genes belonging in each GO term. The values on each bar correspond to the numbers of DMGs in each GO term, and colour gradient (see colour scale right of the figure) indicates the level of significance.
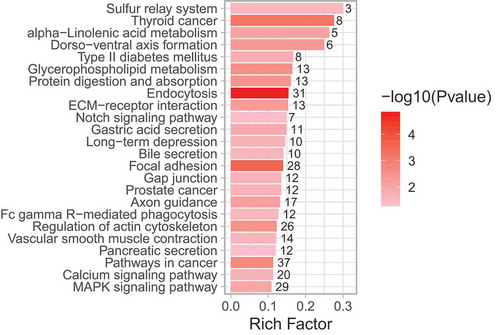
KEGG analysis showed a significant enrichment of pathways know to be involved in diabetes and DPN, such as ‘MAPK signalling’ and ‘glycerophospholipid metabolism’, as well as nervous system pathways including ‘axon guidance’ (; Supplemental Table S6). Significant DMGs that were highly different between degenerators and regenerators within these pathways included genes related to lipid metabolism and diabetes, such as: phospholipase A2, phosphatidylserine decarboxylase, and vascular endothelial growth factor.
Figure 4. KEGG pathway enrichment analysis of sural nerve DMGs (degenerators compared to regenerators). All significantly enriched KEGG terms among DMGs are shown. Rich factor is the proportion of DMGs to all genes belonging in each KEGG pathway. The size of dot corresponds to the numbers of DMGs in each KEGG pathway, and colour gradient (see colour scale right of the figure) indicates the level of significance.
Validation of DMCpGs and DMGs
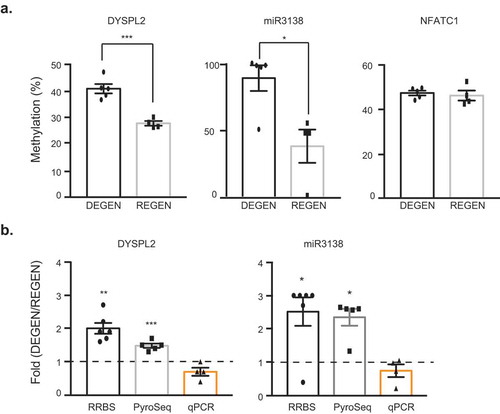
To perform a targeted validation of the results obtained by the genome-wide DNA methylation analysis, we quantified DNA methylation by pyrosequencing. Three CpG sites (Supplemental Table S7) located in promoter regions (< 1kb from TSSs) were selected based on functional enrichment analysis (Supplemental Tables S5 and S6) or degree of differential methylation from a list of the top 30 DMGs (Supplemental ). Of the three selected, dihydropyrimidinase like 2 (DPYSL2; a gene implicated in nervous system development) showed a significantly higher degree of methylation in the degenerator group compared to the regenerator group by pyrosequencing (p = 0.0005), and similar results were observed for miR3138, the most differentially methylated miRNA in our analysis (p = 0.0130) ()). For DPYSL2 and miR3138, the fold difference between the regenerator mean percent methylation and the degenerator samples presented a similar pattern between genome-wide RRBS and loci-specific pyrosequencing methylation analyses. In addition, their gene expression as measured by RT-PCR followed a decreasing trend compared to their increased methylation ()). In contrast, significant changes in methylation between the two groups for the nuclear factor of activated T cells 1 (NFATC1) were observed only with RRBS but not with pyrosequencing ()).
Figure 5. Cross-validation of methylation profiling and sequence-specific methylation of DYSPL2 and miR3138. (a) Percent CpG methylation for DPYSL2, miR3138, and NFATC1 measured by conventional pyrosequencing. The data are presented as mean ± SEM, and an unpaired t-test was used. (b) Methylation and gene expression fold change in the degenerators relative to the regenerators within analysis platform (RRBS, pyrosequencing, and qPCR). Dashed line represents the average gene expression by qPCR analysis of the regenerator group. *p < 0.05, **p < 0.01, ***p < 0.001. For RRBS: DEGEN n = 6; REGEN n = 4. For pyrosequencing: DEGEN n = 5; REGEN n = 4. For qPCR: DEGEN n = 4, REGEN n = 3.
Discussion
We have previously reported changes in gene expression in nerves from mouse models [Citation3,Citation40,Citation41] as well as from human subjects with DPN [Citation42]. In the current study, we examined the epigenetic modifications of human sural nerves from subjects with varying degrees of DPN. RRBS was used to determine differential methylation in DPN subjects who had significant sural nerve degeneration over a one-year period compared to subjects who had stable disease or significant regeneration [Citation4]. Using this technique, we identified 3,460 DMCpGs mapped to 2,835 unique genes. Among the DMCpGs, 1,913 (with 1,607 unique genes) were hypo-methylated and 1,547 (with 1,352 unique genes) were hyper-methylated. Functional analysis indicated that epigenes were enriched in biological pathways related to nervous system development, axon guidance, glycerophospholipid metabolism, and MAPK signalling; several of which have previously been shown to be involved in DPN [Citation42–Citation44]. Further, we validated our results using pyrosequencing and RT-PCR, confirming changes in methylation as well as a trend for a change in gene expression of DPYSL2 and miR3138. Our results suggest that gene expression and associated pathophysiological pathways implicated in DPN progression may be under epigenetic control.
DNA methylation occurs in various regions along the gene [Citation45]. The sites of DNA methylation can effect gene transcription, for example, gene transcription can be halted by methylation within promoter regions and activity can be increased when methylation occurs within intragenic regions [Citation23]. However, while aberrant promoter methylation is a hallmark of diseases such as cancer and is associated with gene silencing [Citation46], changes in DNA methylation commonly occur in regulatory regions rather than in promoter regions in diabetes and diabetic kidney disease [Citation35,Citation47]. These findings are consistent with the high percentage of DMCpGs in intergenic and intronic regions observed in our study. Changes in DNA methylation within regulatory regions may also affect the expression of long non-coding RNAs or miRNAs. MiRNAs themselves play an important role in health and disease [Citation48]. Moreover, epigenetic regulation of miRNAs, including regulation via methylation, is involved in neurodegenerative disorders [Citation49]. In the current study, we observed multiple DMCpGs mapped to annotated miRNAs and long non-coding RNAs.
To better understand the potential biological implications of changes in DNA methylation with progressive DPN, we performed pathway enrichment of significant DMCpGs using GO and KEGG analysis. Given that subject groups were stratified based on sural nerve degeneration vs. regeneration, it is not surprising that pathway analysis revealed multiple significantly enriched pathways related to nervous system development and axon guidance. Within these enriched pathways, a significant DMG in the current study was netrin-4 (NTN4), a gene which promotes neurite elongation and outgrowth [Citation50,Citation51]. In a report comparing methylation profiles in subjects with diabetic nephropathy, differential methylation of saliva netrin-4 was associated with end-stage renal disease [Citation33]. In the nervous system, netrin-4 plays a key role in thermal and mechanical sensitivity during neuropathic pain [Citation52], and we have previously reported an association between peripheral nerve Ntn4 gene expression and DPN phenotype in the db/db mouse model of T2D and DPN [Citation40,Citation41,Citation44]. Taken together, our data suggest that differential DNA methylation of NTN4 regulates its gene expression, which in turn plays an important role in nerve regeneration and repair in DPN.
Glycerophospholipid metabolism was another significantly enriched pathway identified between degenerators and regenerators. Glycerophospholipids are major components of neural membranes and changes in their levels are linked to neurological disorders [Citation53]. Our findings suggest that differential DNA methylation of glycerophospholipid metabolism pathway genes contributes to DPN pathogenesis and disease progression. Importantly, particular DMGs of interest within the glycerophospholipid metabolism pathway were those previously associated with nerve injury, including phospholipase A2 and phosphatidylserine decarboxylase. Phospholipase A2 is involved in inflammation-mediated metabolic disorders, including diabetes and obesity [Citation54]. Phospholipase A2 is also required for neurite growth in the peripheral nervous system [Citation55] and is involved in myelin breakdown during Wallerian degeneration [Citation56]. Phosphatidylserine decarboxylase, an enzyme that catalyses the reaction from phosphatidylserine to phosphatidylethanolamine, is associated with neurodegeneration [Citation57,Citation58]. Further, phosphatidylethanolamine supplementation prevents myelination deficits and restores nerve function in a Charcot-Marie-Tooth disease 1A animal model [Citation59]. Collectively, our results coupled with the established roles of glycerophospholipids in nerve function highlight important roles for phospholipase A2 and phosphatidylserine decarboxylase that require further investigation [Citation57,Citation60].
Another significantly enriched pathway in the degenerator group compared to regenerators was ‘MAPK signalling’. The MAPK signalling pathway responds to a variety of signals and has roles in regulating cell death, differentiation, growth, and inflammation [Citation61]. In addition, it modulates central and peripheral nociceptive information in animal models of neuropathic pain [Citation62], and is well recognized in many neurodegenerative disorders [Citation63], including DPN [Citation64]. Furthermore, the three arms of the MAPK signalling family, ERK (extracellular signal-regulated kinases), JNK (c-Jun N-terminal kinases), and p38 are altered in multiple DPN models as well as in humans with DPN [Citation65,Citation66]. Additionally, ERK, JNK, and p38 are critical for myelination of the axons and are involved in nervous system degeneration and regeneration [Citation64]. In the current study, the enrichment of MAPK DMGs in the regenerator group supports a role for MAPK signalling in DPN progression and suggests that MAPK enzymes may be potential disease-modifying therapeutic targets.
We performed pyrosequencing and RT-PCR validation of DPYSL2 (Dihydropyrimidinase Like 2; also known as CRMP2), NFATC1 (Nuclear Factor Of Activated T Cells 1), and miR3138. DPYSL2 was one of the genes chosen for pyrosequencing as it was highly significantly different between groups within both GO and KEGG pathway analyses. Studies have implicated DPYSL2 in the regulation of neuron guidance, growth, polarity [Citation67], and synaptic signalling [Citation68,Citation69]. Additionally, altered DPYSL2 levels are associated with neurodegenerative diseases, as well as with neuropathic pain [Citation69–Citation71]. We previously reported a significant decrease in the gene expression of Dpysl2 in the sciatic nerves of db/db neuropathic mice compared to normal controls [Citation43]. As expected, differential methylation of DPYSL2 was confirmed with pyrosequencing and was associated with a change in gene expression as measured by RT-PCR. Our results indicate that differential DNA methylation is a potential regulator of DPYSL2, a gene with a known role in nervous system function and neuropathy.
Also chosen for validation was the most highly differentially methylated miRNA between the degenerators and regenerators, miR3138, a miRNA involved in tumour suppression [Citation72]. While little is known about its role in diabetes and diabetic complications, its predicted targets (according to the target prediction database, miRDB [Citation73]) include DMGs or gene families observed in our results, including the immune system related nuclear factor of activated T-cells and neurexin 2, a gene encoding for cell adhesion molecules. Additionally, we cross-referenced predicted and known targets of this miR3138 from miRDB and DIANA-TarBase (database of experimentally validated microRNA target) [Citation74] against the differentially expressed genes between progressive (similar to degenerator) and non-progressive (similar to regenerator) DPN from our previous microarray-based gene expression study in human sural nerves [Citation42]. Using this approach, we identified erb-b2 receptor tyrosine kinase 4 (ERBB4) as a target of miR3138 and a significant gene involved in the progression of DPN [Citation42]. ERBB4 has also previously been associated with sensory nerve loss and nerve regeneration [Citation75,Citation76], providing evidence for a potential regulatory role of miR3138 in nerve degeneration and regeneration in DPN. We confirmed that this differential methylation seen by RRBS and pyrosequencing was associated with a trending decrease in miR3138 gene expression in degenerator sural nerves. These data suggest that epigenetic downregulation of miR3138 expression may play a role in DPN progression. Further studies are needed to fully understand its role in DPN.
Our results suggest that DNA methylation is altered in sural nerves from subjects with DPN, and that the state of methylation may contribute to the regenerative ability of the nerve. Limitations of this study include sample size, and the limited scope of RRBS (as it interrogates only about 10% CpGs of the human genome [Citation77]). Additionally, while two of the three chosen sites were confirmed using pyrosequencing, one (NFATC1) failed. This may be due to the number of CpG sites, as more heavily populated CpG regions did not pass pyrosequencing quality control or validation. In particular, the amplicon analysed for NFATC1 contained up to six potential CpG sites, and homopolymeric sequences limit accurate sequence resolution with genome-wide methylation profiling [Citation78], and therefore may have introduced ambiguity in the RRBS measurements. Lastly, the current analysis did not account for cell-type heterogeneity of sural nerves that may be altered between the two study groups. Adjusting for changes in cell-type composition would provide new insights into the cell-specific processes that drive neuropathy pathogenesis. Future experiments are warranted to investigate functional and cell-specific changes due to differences in methylation in highly methylated regions and connection to gene expression at corresponding loci in a larger cohort of patients.
In summary, our study is the first to examine changes in DNA methylation in human sural nerves of subjects with DPN, and links specific DNA methylation profiles with DPN pathogenesis, specifically disease progression. In particular, DNA methylation contributes to the regulation of functional pathways, such as nervous system development, axon guidance, glycerophospholipid metabolism, and MAPK signalling. As such, it provides novel and important insights into epigenetic regulation of critical disease-modifying pathways that can be targeted to understand DPN pathogenesis and develop mechanism-based therapies.
Materials and methods
Subject selection and characteristics
Biopsies from human sural nerves were obtained during a previous 52-week double-blind placebo-controlled clinical trial of acetyl-L-carnitine treatment for DPN [Citation36,Citation37]. Criteria for enrolment in the larger cohort from which the samples for this manuscript were selected is detailed in a previously published study [Citation36]. Briefly, adult male and female subjects diagnosed with T1D or T2D for a minimum of 1 yr and a HbA1c > 5.9% were included. Additionally, all subjects were phenotyped for neuropathy by a minimum of two neurological findings, including clinical symptoms or abnormal electrophysiological tests (nerve conduction velocity or vibration perception threshold) [Citation79,Citation80]. Subjects with complicating diseases (such as HIV or significant cardiac or hepatic disorders), alcohol or drug abuse, or other causes of neuropathy were excluded. MFD of the sural nerve is considered the most reliable morphological criteria for DPN diagnosis [Citation9]. Within this cohort, acetyl-L-carnitine treatment did not affect MFD, and we previously reported that there were separate groups of subjects with DPN who demonstrated either significant peripheral nerve degeneration or significant regeneration (denoted as degenerators and regenerators, respectively), as measured by MFD percent changes over 52 weeks [Citation4]. Degenerators (n = 6) and regenerators (n = 6) with the largest changes in MFD were selected for the current methylation profiling study. All selected subjects were diagnosed with T2D and were male; subject characteristics are summarized in , and neuropathy phenotyping is presented in (See Supplemental Tables S8 and S9 for the individual subject-level data). The use of human sural nerve samples was approved by the University of Michigan Institutional Review Board for Human Subject Research.
DNA extraction and RRBS
DNA was extracted from sural nerve tissue and prepared for RRBS by the University of Michigan Epigenomics Core. Briefly, DNA extraction followed the protocol published by Garrett-Bakelman et al. [Citation81]. Sample quantity was measured using a Qubit fluorometer, and the quality of the genomic DNA (gDNA) was evaluated using the gDNA assay on Agilent’s TapeStation. High-quality gDNA was digested with the MspI restriction enzyme and purified using phenol:chloroform extraction and ethanol precipitation, before blunt-end digestion, phosphorylation, and ligation of an adapter duplex with methylated cytosines. The ligated fragments were cleaned and processed for size selection on an agarose gel. Selected fragments were bisulfite converted, followed by PCR amplification and cleanup with AMPure XP beads. The libraries were quantified using the Qubit assay and Agilent’s High Sensitivity D1000 assay, and then sequenced on the Illumina Hi-Seq 4000 platform to generate raw sequence RRBS reads.
DNA sequence processing and alignment
The raw sequence reads were evaluated and processed using software and methods as outlined previously [Citation82]. Briefly, the reads were first assessed for quality using FastQC (version 0.11.5, Babraham Bioinformatics, UK), and then low-quality reads were trimmed off using Trim Galore (version 0.4.2, Babraham Bioinformatics, UK). Only the bases with a Phred > 30 were kept for downstream analysis and Illumina adaptors were also removed. A special setting designed for trimming RRBS data (–rrbs) in Trim Galore was also used. Specifically, Trim Galore trimmed the first two bases from the 3′ end of the reads so the cytosine (C) base closest to the second enzyme-cut site was not included in methylation calling, since the RRBS approach introduces artificial CpG sites at the end. Trimmed reads were then aligned and mapped with Bismark version 0.16.3 [Citation83]/Bowtie2 version 2.2.9 [Citation84] to an in silico bisulfite converted human reference genome (GRCh38). The unique alignment was then identified and used to make a methylation call after discarding reads with multiple mapping.
Methylome characterization and differential methylation calculation
Generated sequence alignment/map (SAM) format files were sorted and then directly read in R using the methylKit package version 1.2.4 [Citation38]. Read coverage per base and percent methylation per base as the basic information were calculated and displayed, and the methylation level at each cytosine was estimated by #C/(#C+#T), where #C is the number of methylated reads and #T is the number of unmethylated reads. CpG sites with minimum read coverage of >10 and minimum Phred quality scores >20 were selected for further analysis. Genome-wide methylation patterns were compared using Pearson’s correlation test. Clustering analysis was carried out using Ward’s minimum variance method to determine methylation levels and patterns [Citation85].
DMCpGs were defined as a > 25% difference in cytosine methylation level between regenerators and degenerators, with a q-value from MethylKit, equivalent to false discovery rate (FDR) adjusted p-value, <0.01. Briefly, p-values of DMCpGs were calculated using logistic regression by comparing the number of methylated reads (Cs) and unmethylated reads (Ts) between degenerators and regenerators, and then corrected for multiple testing using FDR. For DMR analysis, a sliding windows approach with 1 kb width was used to summarize the methylation information on those tiles. Then, the same significance criteria were used to determine DMRs (>25% change with a q-value < 0.01).
Filtered DMCpGs and DMRs were annotated based on genes and CpG island features, including gene bodies and 2, 5, and 10 kb regions upstream from TSSs using genomation [Citation39] R package. CpG islands were identified by three criteria; GC fractions > 0.5, lengths > 200 bp, and a ratio of observed-to-expected CpG > 0.6. CpG shores were identified by length (2 kb) and adjacent positions to CpG islands. Annotation of human CpG islands was obtained from the University of California, Santa Cruz (http://genome.ucsc.edu/; hg38), and annotation of the human genes was obtained from Ensembl (http://www.ensembl.org/; protein-coding genes).
Functional enrichment analysis
To identify common biological functions among the nearest genes of DMCpGs, deemed as DMGs, and their promotor regions (1 kb upstream of TSSs), gene set enrichment analysis was performed to identify significantly over-represented biological functions in terms of GO (http://www.geneontology.org) biological process terms and KEGG (http://www.genome.jp/kegg/) pathways. Hypergeometric test was used to examine the statistical significance of over-representation, with an adjusted p-value of < 0.05 as cutoff.
Pyrosequencing
Design of primers for DPYSL2, NFATC1, and miR3138 and preparation of the pyrosequencing amplicons were done at the University of Michigan Epigenomics Core using a published protocol [Citation86]. Briefly, 20 ng of bisulfite-treated DNA was used for PCR amplification (45 cycles) using HotStarTaq Master Mix Kit (203443; Qiagen) and 200 pM of amplicon-specific primers (Supplemental Table S7). For DYSPL2, 5% DMSO was added to the PCR reaction. To verify the expected size of the amplicons, 5 μl of each PCR reaction was run on an ethidium bromide-agarose gel. The amplicons were submitted to the University of Michigan Sequencing Core for sample preparation and pyrosequencing on the PyroMark Q96 MD [Citation87].
Gene expression
Sural nerve RNA was isolated using a RNeasy fibrous tissue mini kit (74704; Qiagen). cDNA template was generated using 200 ng of total RNA and iScript Supermix (1708840; BioRad) in a 40 μl reaction. The reaction was diluted 1:1 with dH2O. qPCR reactions were performed in triplicate using TaqMan™ 2X gene expression Master Mix (4369016; ThermoFisher/Applied Biosystems), 2 μl of template, and sequence-specific TaqMan™ probes (ThermoFisher/Applied Biosystems; Supplemental Table S7) in an Applied Biosystems StepOneTM RT-PCR system. The conditions used were: 40x cycles of 30 s at 95º C, 60 s at 55–60º C, and 30 s at 72º C. This was followed by a 5 min final phase at 72º C. CT values were used to calculate ΔCT and ΔΔCT (with YHWAZ as a housekeeping control and regenerators as the relative control group; Supplemental Table S7). Data are expressed as the mean of the relative quantity of gene expression (2−ΔΔCT) [Citation88]. Statistically significant differences were calculated using a t-test with GraphPad Prism 7 software (GraphPad software Inc.).
Supplemental Material
Download Zip (1.6 MB)Acknowledgments
The authors thank Dr. Benjamin Murdock and Dr. Stacey Sakowski-Jacoby at the University of Michigan for their expert editorial advice. Some of the data were presented as an abstract at the Keystone Bioenergetics and Metabolic Disease Symposia in Keystone, CO in January 2018.
Supplementary material
Supplemental data for this article can be accessed here.
Additional information
Funding
Related Research Data
References
- Centers for Disease Control and Prevention. National Diabetes Statistics Report, 2017. Atlanta, GA: Centers for Disease Control and Prevention, U.S. Dept of Health and Human Services; 2017.
- Cho N, Shaw J, Karuranga S, et al. IDF diabetes atlas: global estimates of diabetes prevalence for 2017 and projections for 2045. Diabetes Res Clin Pract. 2018;138:271–281.
- Hur J, O’Brien PD, Nair V, et al. Transcriptional networks of murine diabetic peripheral neuropathy and nephropathy: common and distinct gene expression patterns. Diabetologia. 2016;59(6):1297–1306.
- Hur J, Sullivan KA, Callaghan BC, et al. Identification of factors associated with sural nerve regeneration and degeneration in diabetic neuropathy. Diabetes Care. 2013;36(12):4043–4049.
- Association AD. Economic costs of diabetes in the US in 2012. Diabetes Care. 2013;36(4):1033–1046.
- Gordois A, Scuffham P, Shearer A, et al. The health care costs of diabetic peripheral neuropathy in the US. Diabetes Care. 2003;26(6):1790–1795.
- Edwards JL, Vincent AM, Cheng HT, et al. Diabetic neuropathy: mechanisms to management. Pharmacol Ther. 2008;120(1):1–34.
- Veves A, Malik R, Lye R, et al. The relationship between sural nerve morphometric findings and measures of peripheral nerve function in mild diabetic neuropathy. Diabetic Med. 1991;8(10):917–921.
- Behse F, Buchthal F, Carlsen F. Nerve biopsy and conduction studies in diabetic neuropathy. J Neurol Neurosurg. 1977;40(11):1072–1082.
- Chatterjee S, Khunti K, Davies MJ. Type 2 diabetes. Lancet. 2017;389(10085):2239–2251.
- Jhamb S, Vangaveti VN, Malabu UH. Genetic and molecular basis of diabetic foot ulcers: clinical review. J Tissue Viability. 2016 Nov;25(4):229–236. PubMed PMID: 27372176. DOI:10.1016/j.jtv.2016.06.005
- Witzel II, Jelinek HF, Khalaf K, et al. Identifying common genetic risk factors of diabetic neuropathies. Front Endocrinol (Lausanne). 2015;6:88. PubMed PMID: 26074879; PubMed Central PMCID: PMCPMC4447004. DOI:10.3389/fendo.2015.00088
- Sterns JD, Smith CB, Steele JR, et al. Epigenetics and type II diabetes mellitus: underlying mechanisms of prenatal predisposition. Front Cell Dev Biol. 2014;2:15.
- Murea M, Ma L, Freedman BI. Genetic and environmental factors associated with type 2 diabetes and diabetic vascular complications. Rev Diabet Stud. 2012;9(1):6.
- Dean L, McEntyre J. The genetic landscape of diabetes [Internet]. Bethesda (MD): National Center for Biotechnology Information (US); 2004.
- Jaenisch R, Bird A. Epigenetic regulation of gene expression: how the genome integrates intrinsic and environmental signals. Nat Genet. 2003;33:245.
- Richards EJ. Inherited epigenetic variation—revisiting soft inheritance. Nat Rev Genet. 2006;7(5):395.
- van Dijk SJ, Molloy P, Varinli H, et al. Epigenetics and human obesity. Int J Obesity. 2015;39(1):85.
- Li J, Harris RA, Cheung SW, et al. Genomic hypomethylation in the human germline associates with selective structural mutability in the human genome. PLoS Genet. 2012;8(5):e1002692.
- Bird A. DNA methylation patterns and epigenetic memory. Genes Dev. 2002;16(1):6–21.
- Rauscher GH, Kresovich JK, Poulin M, et al. Exploring DNA methylation changes in promoter, intragenic, and intergenic regions as early and late events in breast cancer formation. BMC Cancer. 2015 Oct 29;15:816. PubMed PMID: 26510686; PubMed Central PMCID: PMCPMC4625569. DOI:10.1186/s12885-015-1777-9
- Dayeh TA, Olsson AH, Volkov P, et al. Identification of CpG-SNPs associated with type 2 diabetes and differential DNA methylation in human pancreatic islets. Diabetologia. 2013;56(5):1036–1046.
- Rideout WM, Coetzee GA, Olumi AF, et al. 5-Methylcytosine as an endogenous mutagen in the human LDL receptor and p53 genes. Science. 1990;249(4974):1288–1290.
- Varriale A. DNA methylation, epigenetics, and evolution in vertebrates: facts and challenges. Int J Evol Biol. 2014;2014:1–7.
- Moore LD, Le T, Fan G. DNA methylation and its basic function. Neuropsychopharmacology. 2013 Jan;38(1):23–38. PubMed PMID: 22781841; PubMed Central PMCID: PMCPMC3521964. DOI:10.1038/npp.2012.112
- Reik W. Stability and flexibility of epigenetic gene regulation in mammalian development. Nature. 2007 May 24;447(7143):425–432. PubMed PMID: 17522676. DOI:10.1038/nature05918
- Zhao J, Goldberg J, Bremner JD, et al. Global DNA methylation is associated with insulin resistance: a monozygotic twin study. Diabetes. 2012;61(2):542–546.
- Sala P, de Miranda Torrinhas RSM, Fonseca DC, et al. Tissue-specific methylation profile in obese patients with type 2 diabetes before and after Roux-en-Y gastric bypass. Diabetol Metab Syndr. 2017;9:15. PubMed PMID: 28250848; PubMed Central PMCID: PMCPMC5322591. DOI:10.1186/s13098-017-0214-4
- Dayeh T, Volkov P, Salö S, et al. Genome-wide DNA methylation analysis of human pancreatic islets from type 2 diabetic and non-diabetic donors identifies candidate genes that influence insulin secretion. PLoS Genet. 2014;10(3):e1004160.
- Nilsson E, Jansson PA, Perfilyev A, et al. Altered DNA methylation and differential expression of genes influencing metabolism and inflammation in adipose tissue from subjects with type 2 diabetes. Diabetes. 2014;63(9):2962–2976.
- Nitert MD, Dayeh T, Volkov P, et al. Impact of an exercise intervention on DNA methylation in skeletal muscle from first-degree relatives of patients with type 2 diabetes. Diabetes. 2012;61(12):3322–3332.
- Liu -Z-Z, Zhao X-Z, Zhang X-S, et al. Promoter DNA demethylation of Keap1 gene in diabetic cardiomyopathy. Int J Clin Exp Pathol. 2014;7(12):8756.
- Sapienza C, Lee J, Powell J, et al. DNA methylation profiling identifies epigenetic differences between diabetes patients with ESRD and diabetes patients without nephropathy. Epigenetics. 2011;6(1):20–28.
- Agardh E, Lundstig A, Perfilyev A, et al. Genome-wide analysis of DNA methylation in subjects with type 1 diabetes identifies epigenetic modifications associated with proliferative diabetic retinopathy. BMC Med. 2015;13(1):182.
- Ko Y-A, Mohtat D, Suzuki M, et al. Cytosine methylation changes in enhancer regions of core pro-fibrotic genes characterize kidney fibrosis development. Genome Biol. 2013;14(10):R108.
- Sima AA, Calvani M, Mehra M, et al. Acetyl-L-carnitine improves pain, nerve regeneration, and vibratory perception in patients with chronic diabetic neuropathy: an analysis of two randomized placebo-controlled trials. Diabetes Care. 2005;28(1):89–94.
- Wiggin TD, Sullivan KA, Pop-Busui R, et al. Elevated triglycerides correlate with progression of diabetic neuropathy. Diabetes. 2009;58(7):1634–1640.
- Akalin A, Kormaksson M, Li S, et al. methylKit: a comprehensive R package for the analysis of genome-wide DNA methylation profiles. Genome Biol. 2012;13(10):R87.
- Akalin A, Franke V, Vlahoviček K, et al. Genomation: a toolkit to summarize, annotate and visualize genomic intervals. Bioinformatics. 2014;31(7):1127–1129.
- Hur J, Dauch JR, Hinder LM, et al. The metabolic syndrome and microvascular complications in a murine model of type 2 diabetes. Diabetes. 2015Sep;64(9):3294–3304.
- Hinder LM, Park M, Rumora AE, et al. Comparative RNA‐Seq transcriptome analyses reveal distinct metabolic pathways in diabetic nerve and kidney disease. J Cell Mol Med. 2017;21:2140–2152.
- Hur J, Sullivan KA, Pande M, et al. The identification of gene expression profiles associated with progression of human diabetic neuropathy. Brain. 2011;134(11):3222–3235.
- Pande M, Hur J, Hong Y, et al. Transcriptional profiling of diabetic neuropathy in the BKS db/db mouse: a model of type 2 diabetes. Diabetes. 2011;Jul;60(7):1981–1989.
- Hinder LM, Murdock BJ, Park M, et al. Transcriptional networks of progressive diabetic peripheral neuropathy in the db/db mouse model of type 2 diabetes: an inflammatory story. Exp Neurol. 2018;305:33–43.
- Kulis M, Esteller M. DNA methylation and cancer. Adv Genet. 2010;70:27–56. PubMed PMID: 20920744. DOI:10.1016/B978-0-12-380866-0.60002-2
- Esteller M. Epigenetics in cancer. N Engl J Med. 2008;358(11):1148–1159.
- Chen Z, Miao F, Paterson AD, et al. Epigenomic profiling reveals an association between persistence of DNA methylation and metabolic memory in the DCCT/EDIC type 1 diabetes cohort. Proc Nat Acad Sci. 2016;May 24;113(21):E3002–11.
- Bayoumi AS, Sayed A, Broskova Z, et al. Crosstalk between long noncoding RNAs and microRNAs in health and disease. Int J Mol Sci. 2016;17(3):356.
- Piletič K, Kunej T. MicroRNA epigenetic signatures in human disease. Arch Toxicol. 2016;90(10):2405–2419.
- Koch M, Murrell JR, Hunter DD, et al. A novel member of the netrin family, β-netrin, shares homology with the β chain of laminin: identification, expression, and functional characterization. J Cell Biol. 2000;151(2):221–234.
- Reuten R, Patel TR, McDougall M, et al. Structural decoding of netrin-4 reveals a regulatory function towards mature basement membranes. Nat Commun. 2016;7:13515.
- Hayano Y, Takasu K, Koyama Y, et al. Dorsal horn interneuron-derived Netrin-4 contributes to spinal sensitization in chronic pain via Unc5B. J Exp Med. 2016;213(13):2949–2966.
- Farooqui AA, Horrocks LA, Farooqui T. Glycerophospholipids in brain: their metabolism, incorporation into membranes, functions, and involvement in neurological disorders. Chem Phys Lipids. 2000;106(1):1–29.
- Hui DY. Phospholipase A2 enzymes in metabolic and cardiovascular diseases. Curr Opin Lipidol. 2012;23(3):235.
- Jang Y, Jung J, Kim H, et al. Axonal neuropathy-associated TRPV4 regulates neurotrophic factor-derived axonal growth. J Biol Chem. 2012;287(8):6014–6024.
- De S, Trigueros MA, Kalyvas A, et al. Phospholipase A2 plays an important role in myelin breakdown and phagocytosis during Wallerian degeneration. Mol Cell Neurosci. 2003;24(3):753–765.
- Di Bartolomeo F, Wagner A, Daum G. Cell biology, physiology and enzymology of phosphatidylserine decarboxylase. Biochim Biophys Acta (BBA)-Mol Cell Biol Lipids. 2017;1862(1):25–38.
- Calzada E, Onguka O, Claypool SM. Phosphatidylethanolamine metabolism in health and disease. Int Rev Cell Mol Biol. 2016;321:29–88. Elsevier.
- Fledrich R, Abdelaal T, Rasch L, et al. Targeting myelin lipid metabolism as a potential therapeutic strategy in a model of CMT1A neuropathy. Nat Commun. 2018;9(1):3025.
- Leslie CC. Cytosolic phospholipase A2: physiological function and role in disease. J Lipid Res. 2015;jlr:R057588.
- Seger R, Krebs EG. The MAPK signaling cascade. Faseb J. 1995;9(9):726–735.
- Obata K, Noguchi K. MAPK activation in nociceptive neurons and pain hypersensitivity. Life Sci. 2004;74(21):2643–2653.
- Kim EK, Choi E-J. Pathological roles of MAPK signaling pathways in human diseases. Biochim Biophys Acta Mol Basis Dis. 2010;1802(4):396–405.
- Cavaletti G, Miloso M, Nicolini G, et al. Emerging role of mitogen-activated protein kinases in peripheral neuropathies. J Peripher Nerv Syst. 2007;12(3):175–194.
- Daulhac L, Mallet C, Courteix C, et al. Diabetes-induced mechanical hyperalgesia involves spinal MAPKs activation in neurons and microglia via NMDA-dependent mechanisms. Mol Pharmacol. 2006;70:1246–1254.
- Purves T, Middlemas A, Agthong S, et al. A role for mitogen-activated protein kinases in the etiology of diabetic neuropathy. Faseb J. 2001;15(13):2508–2514.
- Taylor A, Wang K-S. Association between DPYSL2 gene polymorphisms and alcohol dependence in Caucasian samples. J Neural Transm. 2014;121(1):105–111.
- Brittain JM, Piekarz AD, Wang Y, et al. An atypical role for collapsin response mediator protein 2 (CRMP-2) in neurotransmitter release via interaction with presynaptic voltage-gated calcium channels. J Biol Chem. 2009;284(45):31375–31390.
- Brittain JM, Duarte DB, Wilson SM, et al. Suppression of inflammatory and neuropathic pain by uncoupling CRMP-2 from the presynaptic Ca 2+ channel complex. Nat Med. 2011;17(7):822.
- Martins‐de‐Souza D, Cassoli JS, Nascimento JM, et al. The protein interactome of collapsin response mediator protein‐2 (CRMP2/DPYSL2) reveals novel partner proteins in brain tissue. Proteomics Clin Appl. 2015;9(9–10):817–831.
- Kuter K, Kratochwil M, Marx S-H, et al. Native DIGE proteomic analysis of mitochondria from substantia nigra and striatum during neuronal degeneration and its compensation in an animal model of early Parkinson’s disease. Arch Physiol Biochem. 2016;122(5):238–256.
- Braoudaki M, Lambrou G, Papadodima S, et al. MicroRNA expression profiles in pediatric dysembryoplastic neuroepithelial tumors. Med Oncol. 2016;33(1):5.
- Wong N, Wang X. miRDB: an online resource for microRNA target prediction and functional annotations. Nucleic Acids Res. 2014;43(D1):D146–D152.
- Karagkouni D, Paraskevopoulou MD, Chatzopoulos S, et al. DIANA-TarBase v8: a decade-long collection of experimentally supported miRNA-gene interactions. Nucleic Acids Res. 2018 Jan 4;46(D1):D239–D245. PubMed PMID: 29156006; PubMed Central PMCID: PMCPMC5753203.
- Chen S, Rio C, Ji -R-R, et al. Disruption of ErbB receptor signaling in adult non-myelinating Schwann cells causes progressive sensory loss. Nat Neurosci. 2003;6(11):1186.
- Audisio C, Nicolino S, Scevola A, et al. ErbB receptors modulation in different types of peripheral nerve regeneration. Neuroreport. 2008;19(16):1605–1609.
- Walker DL, Bhagwate AV, Baheti S, et al. DNA methylation profiling: comparison of genome-wide sequencing methods and the infinium human methylation 450 bead chip. Epigenomics. 2015;7(8):1287–1302.
- Potapova A, Albat C, Hasemeier B, et al. Systematic cross-validation of 454 sequencing and pyrosequencing for the exact quantification of DNA methylation patterns with single CpG resolution. BMC Biotechnol. 2011;11(1):6.
- Greene DA, Arezzo J, Brown M, et al. Effect of aldose reductase inhibition on nerve conduction and morphometry in diabetic neuropathy. Neurology. 1999;53(3):580–581.
- O’Brien PC. Procedures for comparing samples with multiple endpoints. Biometrics. 1984;40:1079–1087.
- Garrett-Bakelman FE, Sheridan CK, Kacmarczyk TJ, et al. Enhanced reduced representation bisulfite sequencing for assessment of DNA methylation at base pair resolution. J Vis Exp. 2015 Feb 24;(96):e52246. PubMed PMID: 25742437; PubMed Central PMCID: PMCPMC4354670. DOI:10.3791/52246.
- Korkmaz FT, Kerr DE. Genome-wide methylation analysis reveals differentially methylated loci that are associated with an age-dependent increase in bovine fibroblast response to LPS. BMC Genomics. 2017 May 25;18(1):405. PubMed PMID: 28545453; PubMed Central PMCID: PMCPMC5445414. DOI:10.1186/s12864-017-3796-1
- Krueger F, Andrews SR. Bismark: a flexible aligner and methylation caller for Bisulfite-Seq applications. Bioinformatics. 2011;27(11):1571–1572.
- Langmead B, Salzberg SL. Fast gapped-read alignment with Bowtie 2. Nat Methods. 2012;9(4):357.
- Murtagh F, Legendre P. Ward’s hierarchical agglomerative clustering method: which algorithms implement Ward’s criterion? J Classif. 2014;31(3):274–295.
- Delaney C, Garg SK, Yung R. Analysis of DNA methylation by pyrosequencing. Methods Mol Biol. 2015;1343:249–264. PubMed PMID: 26420722; PubMed Central PMCID: PMCPMC4772880. DOI:10.1007/978-1-4939-2963-4_19
- Figueroa-Romero C, Hur J, Bender DE, et al. Identification of epigenetically altered genes in sporadic amyotrophic lateral sclerosis. PLoS One. 2012;7(12):e52672.
- Figueroa-Romero C, Hur J, Lunn JS, et al. Expression of microRNAs in human post-mortem amyotrophic lateral sclerosis spinal cords provides insight into disease mechanisms. Mol Cell Neurosci. 2016;71:34–45.