
 ?Mathematical formulae have been encoded as MathML and are displayed in this HTML version using MathJax in order to improve their display. Uncheck the box to turn MathJax off. This feature requires Javascript. Click on a formula to zoom.
ABSTRACT
Assisted reproductive technologies are known to alter the developmental environment of gametes and early embryos during the most dynamic period of establishing the epigenome. This may result in the introduction of errors during active DNA methylation reprogramming. Controlled ovarian hyperstimulation, or superovulation, is a ubiquitously used intervention which has been demonstrated to alter the methylation of certain imprinted genes. The objective of this study was to investigate whether ovarian hyperstimulation results in genome-wide DNA methylation changes in mouse early embryos. Ovarian hyperstimulation was induced by treating mice with either low doses (5 IU) or high doses (10 IU) of PMSG and hCG. Natural mating (NM) control mice received no treatment. Zygotes and 8-cell embryos were collected from each group and DNA methylomes were generated by whole-genome bisulfite sequencing. In the NM group, mean CpG methylation levels slightly decreased from zygote to 8-cell stage, whereas a large decrease in mean CpG methylation level was observed in both superovulated groups. A separate analysis of the mean CpG methylation levels within each developmental stage confirmed that significant genome-wide erasure of CpG methylation from the zygote to 8-cell stage only occurred in the superovulation groups. Our results suggest that superovulation alters the genome-wide DNA methylation erasure process in mouse early pre-implantation embryos. It is not clear whether these changes are transient or persistent. Further studies are ongoing to investigate the impact of ovarian hyperstimulation on DNA methylation re-establishment in later stages of embryo development.
Introduction
Since the first assisted conception 40 years ago, assisted reproductive technologies (ART) have enabled infertile couples to give birth to almost 5 million children. ART refers to a variety of assisted reproductive techniques in which both oocytes and sperms are handled ex vivo in the laboratory. These techniques include controlled ovarian hyperstimulation or superovulation, in vitro fertilization (IVF), intra-cytoplasmic sperm injection (ICSI), embryo transfer, embryo biopsy, and gamete or embryo cryopreservation. These technologies create artificial microenvironments for oocyte growth and early embryo development. For example, during all ART cycles, high doses of synthetic hormones are injected in order to override the natural endocrine regulatory system in the body, so that multiple oocytes can mature. Subsequently, after these oocytes are retrieved, they are fertilized in vitro, and the resulting embryos are then incubated in appropriate culture medium for several days. As such, ART introduces some of the most dramatic and the most direct environmental changes during the earliest stage of human development, through super-physiological hormone levels, mechanical manipulations, or cryopreservation of gametes and embryos. These artificial environmental alterations may interact with the highly modifiable epigenome, potentially leading to long-lasting adverse effects both in these embryos and in future generations.
Waves of DNA methylation erasure and re-establishment occur initially in primordial germ cells (PGCs), and then again after fertilization in pre-implantation embryos [Citation1]. These waves of DNA methylation changes in oocytes and embryos are essential for resetting differentiation potential, establishing the germline, and marking correct developmental genes [Citation2–Citation5]. In humans, the process of DNA methylome erasure in PGCs and in pre-implantation embryos resembles what was previously described in mice, although some significant differences exist [Citation2,Citation6–Citation11]. The DNA demethylation dynamics in human PGCs between developmental week 5 to 19 is overall similar to those of mice between embryonic day (E) 10.5 to 13.5. As in the mouse, the loss of CpG methylation does not correlate with changes in gene expression in the human germline, suggesting that erasure of epigenetic memory is a key purpose of demethylation [Citation2]. However, in mouse PGCs, the inactive X chromosome is reactivated between E8.5 and E12.5 after PGCs migrate to the genital ridge, whereas hypomethylation of imprints in humans occurs before PGCs colonize the genital ridge and X reactivation in human PGCs occurs prior to 4 weeks of development [Citation7,Citation8]. The most marked genome-wide demethylation in mouse embryos occurs mainly at the zygote stage, with mild gradual demethylation until the blastocyst stage, whereas in human embryo a dramatic decrease in DNA methylation occurs from fertilization to the 2-cell stage with a small reduction in methylation from that point to the blastocyst stage. Following implantation, a sharp increase in the level of methylation is observed in both mouse and human DNA methylomes [Citation11].
ART interventions involve changing the developmental environment of gametes and early embryos, as well as mechanical manipulations during this most dynamic period of establishing the epigenome, and therefore may introduce errors during the active DNA methylation reprogramming period in gametes and pre-implantation embryos. Studies in children and animals born after ART have raised concerns that ART techniques may cause increased imprinting errors and possible epigenomic instability [Citation12–Citation21]. For example, in vitro embryo culture was found to result in large offspring syndrome in sheep, which was due to abnormal Igf2r methylation [Citation22]. Cardiovascular dysfunction was observed in mice and their offspring after ART, which was caused by altered methylation in the eNos gene [Citation23]. Prior studies have mostly focused on aberrant methylation of a few imprinted genes. Little is known about the effect of ART on the epigenomic landscapes in pre-implantation embryos, partly due to technical limitations that precluded epigenome-wide studies in a small number of cells. With the newly available single-cell whole genome bisulfite sequencing (WGBS) techniques [Citation24–Citation26], we are now able to investigate the effect of ART on DNA methylomes using a limited number of pre-implantation embryos. Previous human studies also had the limitation of being unable to distinguish the impact of ART from the effects of infertility diagnoses on epigenetic perturbations. A mouse model therefore has the advantage of eliminating the effects of confounding factors that would be difficult to control for in human studies, such as infertility, maternal age, dosage and protocols of ovarian stimulation, and the heterogeneity of patient population.
Controlled ovarian hyperstimulation, or superovulation, is one intervention ubiquitously used in ART. Multiple oocyte growth and maturation is achieved through super-physiological stimulation of ovaries using gonadotropins. Ovarian hyperstimulation was the only ART intervention in some cases of imprinting disorders including Angelman and Beckwith-Wiedemann Syndromes [Citation27,Citation28]. In mouse studies, superovulation alone was shown to alter the methylation of select maternal and paternal imprinted genes in a dose-dependent manner [Citation29]. However, it is not known whether consistent DNA methylation changes are seen on a genomic level after ovarian hyperstimulation. The objective of this study is to investigate the impact of ovarian hyperstimulation on genome-wide DNA methylation changes in mouse early embryos.
Results
WGBS data from zygotes or 8-cell embryos were generated from three groups of mice: 1) natural mating (NM) group received no hormone treatment; 2) low dose ovarian hyperstimulation (5IU) group received 5IU of PMSG and 5IU of hCG; 3) high dose ovarian hyperstimulation (10IU) group received 10IU of PMSG and 10IU of hCG. An average of 3,447,975 CpG sites (SD = 1,181,818) were covered in each group/developmental stage category with ≥3 reads (). Bisulfite conversion rates were calculated using spiked-in λ DNA, and all libraries had bisulfite conversion rates of 98% or above (). Hierarchical clustering showed that libraries within each group and developmental stage clustered together, indicating reproducibility among different biological replicates (Supplemental Figure 1(a)).
Table 1. WGBS dataset summary. Listed are the sequencing statistics for the WGBS datasets used in this study. Datasets are from combined individual WGBS libraries from two or more biological samples. Also included are the methylation statistics for the combined datasets for each dosage and stage. The combined datasets were used for comparisons between stages and dosages.
We first compared the average CpG methylation levels between the zygote and 8-cell stages within each experimental group. In the natural mating (NM) control group, mean CpG methylation levels did not show a dramatic change from zygote to 8-cell stage (∆meth = −6.33%, 95% CI: −6.47%, −6.20%), whereas a substantial decrease in mean CpG methylation level was observed in both superovulated groups (∆meth = −27.50%, 95% CI: −27.56%, −27.42% in 5IU group; ∆meth = −18.51%, 95% CI: −18.61%, −18.40% in 10 IU group). The effect sizes associated with the differences in mean methylation were much higher for the superovulated groups compared to NM (Cohen’s d = 0.159, 0.789, and 0.499 for NM, 5IU, and 10IU groups, respectively). The distribution of CpG methylation levels are shown in the violin plots and the global decrease in CpG methylation levels in 5IU and 10IU groups as compared to NM group in 8-cell embryos can be clearly visualized ()). The majority of CpG sites are distributed at very low methylation levels in the superovulation groups (5IU and 10IU) at the 8-cell stage (median = 33.3%, 0%, and 0% for NM, 5IU, and 10IU groups, respectively).
Figure 1. Distribution of CpG methylation at shared sites.
Violin plots displaying the distribution of methylation levels at shared CpG sites within each stage or treatment group. The x-axis represents the CpG methylation level, 0–100%. The number of shared CpG sites, ‘n’, and the percentage of total CpG sites (%) are provided above each graph and the mean methylation level () is provided beneath its respective violin plot. White dots: median methylation levels. (a) Within each treatment group, the distribution of methylated CpGs in zygote and 8-cell stage is plotted. (b) Within each developmental stage, NM was compared to 5 IU or 10 IU treated groups.
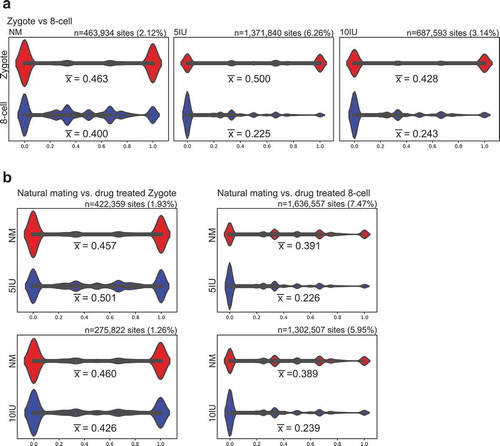
A separate analysis using a similar approach compared the overlapping CpG sites between individual superovulation groups and the NM group within each developmental stage. At the zygote stage, CpG methylation levels were similar between NM and superovulation at either dosage (∆meth = 4.33%, 95% CI: 4.18%, 4.47%; and −3.45%, 95% CI: −3.64%, −3.27% for 5IU and 10IU groups, respectively) and effect size was minor (Cohen’s d = 0.102 and 0.079). However, at the 8-cell stage mean CpG methylation was markedly decreased in the superovulation groups as compared to the NM group (∆meth = −16.50%, 95% CI: −16.55%, −16.45%; and −14.94%, 95% CI: −15.00%, −14.88% for 5IU and 10IU, respectively), and these differences were associated with much higher effect sizes (Cohen’s d = 0.527 and 0.468). The violin plots show a larger percentage of CpG sites at low methylation levels in the superovulation groups (5IU or 10IU) at the 8-cell stage, whereas the distributions are similar among all three groups at the zygote stage ()).
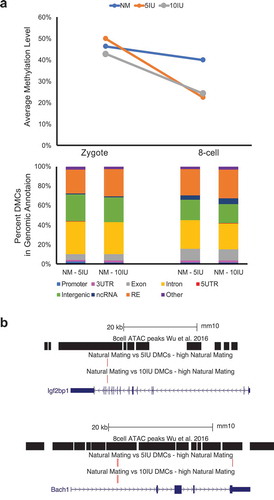
We next focused our analysis on the differentially methylated CpG sites (DMCs), which are a small percentage of sites that showed statistically significant differences in the methylation levels in pairwise comparisons. When the direction of change of DMCs was summarized, the majority of DMCs in the two superovulation groups showed decreased methylation in the 8-cell stage, which was markedly different from the trend seen in the natural mating group ()). The DMCs were distributed across the genome, indicating that the perturbations in DNA methylation associated with superovulation in the 8-cell stage are genome-wide ()). Various genomic features are represented in the DMCs including promoters, exons, introns, and repetitive elements such as satellites, LINEs, SINEs (), Supplemental Figure 1(b)). Among the genomic features, we specifically examined the accessible chromatin regions annotated by ATAC-seq based on previously published data in mouse 8-cell embryos [Citation30], because DMCs located in these regions may interact with other epigenetic regulatory elements and mark developmentally important genes. Of the 43,360 ATAC-seq peaks identified in 8-cell mouse embryo, 289 overlapped a DMC in the NM versus 5IU comparison and 319 overlap a DMC in the NM versus 10IU comparison. Of these, 263 and 296 overlapped a DMC with a higher methylation level in the NM group when compared to 5IU and 10IU, respectively. A total of 45 ATAC-seq peaks contain DMCs with higher methylation levels in NM group as compared to both superovulation groups, i.e., shared by the two pairwise comparisons (NM-5IU and NM-10IU). The genes nearest these 45 peaks with overlapping DMCs are listed in Supplemental . The ATAC-seq peaks and DMCs of two of these key developmental genes, Igf2bp1 and Bach1, are shown as examples in ).
Figure 2. Differentially methylated CpGs genome-wide.
(a) The number of significant (p < 0.01) differentially methylated CpGs (DMCs) is shown in the table for each comparison. DMCs can only be calculated for shared CpG sites in each pairwise comparison. The percentage after each number represents the percentage of shared CpG sites. (b) Circos plot showing the methylation levels of DMCs across the genome. Outer circle: DMCs for the 8-cell NM versus 5IU comparison; Inner circle: DMCs for 8-cell NM versus 10IU. Red dots: DMC methylation levels in the NM group; Blue dots: DMC methylation levels in superovulation (SO) groups.
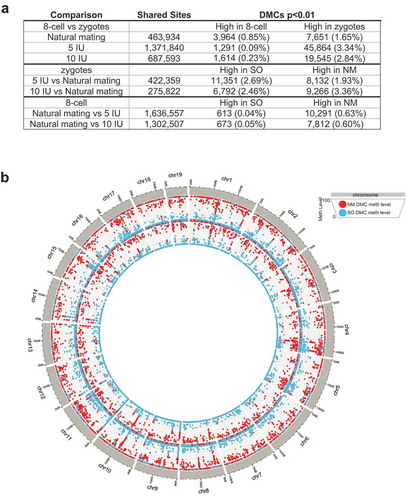
Figure 3. Global and local CpG methylation changes.
(a) Top: mean CpG methylation levels at each stage and treatment group. Bottom: Percent of DMCs in each genome annotation. Only the DMCs with higher methylation levels in the NM group in the NM versus SO comparisons were shown here. (b) Two examples of genes with DMCs (in red bars, NM versus SO) in the ATAC-seq peaks. Top: Igf2bp1; Bottom: Bach1.
Discussion
By comparing the DNA methylomes of early mouse embryos after superovulation to those without hormone treatments, we found that ovarian hyperstimulation resulted in a significant decrease in global CpG methylation levels at the 8-cell stage. The natural process of DNA methylation erasure in early embryo development may be altered by superovulation, and the effect does not appear to be dependent on the dosage of gonadotropins.
Previous work in mice showed that DNA methylation of some imprinted genes is altered by superovulation in a dose-dependent manner [Citation29]. Not only maternal imprinted genes such as Snrpn, Peg3, Kcnq1ot1, but also the paternal imprinted gene H19 demonstrated perturbation after superovulation in mouse blastocysts, suggesting potentially broad effects of ovarian stimulation on other regions of the genome [Citation29]. A study in children born after ART showed changes in DNA methylation correlating with changes in transcription for multiple genes [Citation31]; however, in human studies, it was difficult to differentiate which ART procedure or infertility diagnosis contributes to the genome-wide changes.
A major strength of our study is our genome-wide approach using methods that were not available until recently. By using WGBS techniques that were recently proven to be feasible in single cells [Citation24,Citation25], we are able to study the DNA methylome in cells with limited quantity such as early embryos. We chose to focus on the ovarian hyperstimulation aspect of ART first, because it is an essential step used in all ART cycles, and solid evidence existed for the perturbation of imprinted genes by superovulation in mouse blastocysts. We ensured all libraries included in the study had valid negative controls and positive controls, and bisulfite conversion rates of at least 98%. All embryos were examined under the microscope to ensure homogeneous developmental stages, and measures were taken to eliminate other cell types, which are all important considerations for a DNA methylome study. We analysed the genome-wide DNA methylation patterns from several different angles, including pairwise comparisons between either the treatment groups or the developmental stages as well as the DMCs, which all reached consistent conclusions showing genome-wide perturbations of DNA methylation by superovulation when the embryo reaches 8-cell stage.
Our study has several limitations. We only included embryos in two early stages of development, and the impact of superovulation on later embryo development remains to be investigated. Due to the nature of DNA methylome studies in a very small number of cells, the coverage and depth of each library is limited; therefore, we merged the libraries from each group and developmental stage. Although this approach is commonly used in genome-wide studies, it does not allow us to draw confident conclusions on regions with small changes or small regions with low coverage. We therefore focused most of our analysis and data interpretation on the global pattern of DNA methylation changes after superovulation in the earliest stages of mouse embryo development. Since our experiments were designed to focus on the genome-wide DNA methylation patterns, we did not mate mice of different strains to distinguish alleles. The main study that showed dose response changes with superovulation [Citation29] used mice from crosses of C57BL/6 (CAST7) females and C57BL/6 (B6) males in order to study allele-specific DNA methylation in imprinted genes. We used C57BL/6 male and female mice, and the lack of allele specificity makes the DNA methylation level at the imprinted regions the average of the two alleles. Therefore, the smaller changes in imprinted regions would have been missed by our study. In addition, not every blastocyst in the previous study showed dose-dependent changes, so after averaging the changes observed in several embryos, our study would not be able to detect small changes especially in the imprinted regions. Due to these reasons, our study was not designed to accurately assess imprinted genes.
Even though we restricted our conclusions and main focus to the global patterns of DNA methylome changes, we did determine the DMCs and found a genome-wide distribution with no enrichment in particular genomic features. We also analysed the accessible chromatin regions using published data to identify genes close to these regulatory regions that showed DNA methylation changes. These genes (listed in Supplemental ) potentially are potentially more developmentally important and DNA methylation perturbations in the open chromatin regions near the genes may likely result in regulatory consequences. Two genes, Igf2bp1 and Bach1, were shown as examples in ), and these two genes play important epigenetic regulatory roles in embryogenesis and stem cell proliferation [Citation32,Citation33] and showed transcriptional alterations in pre-implantation mouse embryos under non-physiological culture conditions [Citation34].
In summary, clear changes in global DNA methylation levels after superovulation were observed as early as the 8-cell stage in our study and these changes appeared to be genome-wide. Further studies are ongoing to examine whether these changes are transient or persist into later embryo development and even into the next generation, and the effect of these DNA methylation changes on the transcriptome and health outcomes.
Methods
Mouse embryo collection
Approval from University of Washington Institutional Animal Care and Use Committee (IACUC) was obtained prior to the study. Mouse experiments were conducted at University of Washington Mouse Transgenic Core Facility. Three groups of 6-week old C57BL/6 female mice were included in our study: 1) natural mating (NM) without any hormone treatment, 2) low dose stimulation (5IU), 3) high dose stimulation (10IU). Superovulated mice were injected with 5IU (low dose) or 10IU (high dose) of PMSG to stimulate multiple oocyte growth, followed by 5IU or 10IU of hCG 48 hours later to induce ovulation. The control group did not receive any hormonal injection and were set up for mating timed with spontaneous ovulation cycles. Female mice were mated with fertile male mice overnight, and the occurrence of mating was determined by the presence of a vaginal plug the following morning. Zygotes were collected at day 0.5 postcoitum, and 8-cell embryos were collected at day 2.5 postcoitum. Each embryo was examined under microscope. At E0.5, only cells with two pronuclei were collected as zygotes in order to eliminate the possibility of collecting unfertilized oocytes. All zygotes were treated with hyaluronidase for 1 minute and cumulus cells were completely washed off the zona pellucida in M2 media. At E2.5, only 8-cell embryos were collected in order to maintain the homogeneity of the embryonic developmental stage. Embryos were washed at least three times in droplets of PBS before being cryopreserved at −80°C. Each sample consisted of 3–5 embryos in less than 5µl of PBS. For each control and experimental group, embryo collections were performed multiple times, and embryos analyzed were recovered from multiple animals. We chose to include 3–5 embryos per sample so that we can collect each sample from the same mouse in order to account for the heterogeneity resulted from individual differences. Even though including a large number of embryos per sample may increase the coverage, the mixture of many embryos from multiple individuals also leads to the signals being averaged at each cytosine site. By combining only a few embryos in each sample, we can balance the coverage, individual variations, and cost of WGBS.
WGBS
WGBS library preparations were carried out in a clean PCR hood designated for this study. Each experiment consisted of 2–3 samples, a negative control (water), and a positive control (λ DNA). Each embryo sample was lysed using 1 mL of proteinase K in M-Digestion buffer (Zymo Research) at 50°C for 30 min. After the cell lysis step, unmethylated λ DNA (Promega) was spiked in each sample (10 pg/sample). No DNA purification or quantification steps are done in this ‘one-tube’ method designed for very low input DNA amount. A Pico Methyl-Seq kit (Zymo Research) was used for library preparation according to the protocol. Bisulfite treatment was performed by adding 130 μl of lightening conversion reagent to each sample and incubating at 98°C for 8 minutes and 54°C for 60 minutes. This step simultaneously fragmentises and bisulfite-converts DNA. Then, complimentary strands are synthesized by using random PreAmp primers, with 2 cycles of incubation at 98°C for 2 minutes, 8°C for 5 minutes, 16°C, 22°C, 28°C, 36°C, 36.5°C for 1 minute each, and 37°C for 8 minutes. DNA clean-up was carried out on Zymo-Spin IC columns following manufacturer’s protocol. Library amplification step consists of 10 PCR cycles at the settings of 94°C, 45°C, 55°C for 30 seconds each, and 68°C for 1 minute. The library preparation is completed by PCR amplification with Illumina indexed primers. The incubation setting for amplification is: 94°C and 58°C for 30 seconds each, 68°C for 1 minute, for a total of 10 cycles. The indexed libraries were assessed for quality using High-Sensitivity DNA chips on the Agilent Bioanalyzer 2100. Only those experiments with flat bioanalyzer tracing for the negative control were included in the analysis. The quantity of each sequencing library was measured with a Qubit fluorometer. Two to three libraries were multiplexed and sequenced on one lane of an Illumina HiSeq2500 for 150-bp single-end sequencing. All libraries in this study were sequenced during three HiSeq runs, each of which included multiple samples from different groups, in order to decrease technical variations.
Data analysis
Raw sequence reads were trimmed to remove the adaptor contamination and poor-quality reads using Trim Galore! (v0.3.7, www.bioinformatics.babraham.ac.uk/projects/trim_galore). To account for random priming introduced during library preparation, an additional five bases were trimmed from the 5ʹ end of each read. Trimmed sequences were mapped to the Mus Musculus genome (GRCm38.p6) with Bismark (v0.16.1, www.bioinformatics.babraham.ac.uk/projects/bismark) using the non_directional mode. All trimmed sequences were also mapped to the Enterobacteria phage l genome (GenBank: J02459.1) to obtain the bisulfite conversion rate of each sample. Duplicate reads were removed and methylation calls were made using MethPipe (v3.4.2, www.smithlabresearch.org/software/methpipe).
Only CpG sites with adequate coverage (≥3 reads) in each comparison group were included in the pair-wise analyses. Differentially methylated CpG sites (DMCs) were identified using MethPipe, which implements a one-directional version of Fisher’s exact test. DMCs were defined as the CpG sites where the methylation level is statistically significantly different between the two comparison groups (Fisher’s exact test, p-value<0.01). HOMER (v4.10, www.homer.ucsd.edu) was used to annotate genomic features of DMCs and shinyCircos (www. yimingyu.shinyapps.io/shinycircos/) was used to generate the Circos plot. All other statistical analysis was performed using R. Differences in mean methylation levels, ∆meth, and 95% confidence intervals were calculated by bootstrapping using 1,000 re-samplings of CpG methylation data.
Despite the large differences in ∆meth, the change in methylation between the zygote and 8-cell stage was statistically significant for all three groups (p < 2.2e-16 for NM, 5IU and 10IU, Wilcoxon signed rank test with continuity correction), which was not surprising due to the large sample sizes of CpG sites [Citation35]. Thus, to evaluate the substantive significance of these changes in methylation, we computed the effect size for each group using Cohen’s d, which defines a small effect as 0.2, medium as 0.5, and a large effect size as 0.8 [Citation35]. Cohen’s d was used to calculate the effect size of differences in mean CpG methylation between two groups:
where and
are the means of the two groups and s is the pooled standard deviation of the mean methylation levels:
Hierarchical clustering was performed using the methylKit R package (v1.4.1, www.bioconductor.org/packages/methylKit). Violin plots were generated using the Seaborn Python package (v0.7.1, www.seaborn.pydata.org).
Authors’ contributions
BY conceived and supervised the project, designed the experiments, optimized the protocols, and wrote the manuscript. THS performed the data analysis and wrote part of the manuscript. SLB performed the experiments and data analysis. SF performed the experiments. RDH provided expertise on epigenetics and edited the manuscript.
Availability of data and materials
The datasets supporting the conclusions of this article are available in the National Center for Biotechnology Information (NCBI) Sequence Read Archive (SRA), SRA accession ID PRJNA495861.
Consent for publication
Not applicable.
Ethics approval and consent to participate
Approval from University of Washington Institutional Animal Care and Use Committee (IACUC) was obtained prior to the study.
Supplemental Material
Download MS Excel (10.5 KB)Supplemental Material
Download PDF (911.9 KB)Acknowledgments
The authors would like to acknowledge Kathy Kafer and Robert Hunter at University of Washington Mouse Transgenic Core Facilities, and Dr. Miranda Bernhardt at Washington State University Animal Production Core Facility for their assistance in mouse embryo collection.
Disclosure statement
No potential conflict of interest was reported by the authors.
Supplementary material
Supplemental data for this article can be accessed here.
Additional information
Funding
References
- Smallwood SA, Kelsey G. De novo DNA methylation: a germ cell perspective. Trends Genet. 2012;28:33–42.
- von Meyenn F, Reik W. Forget the parents: epigenetic reprogramming in human germ cells. Cell. 2015;161:1248–1251.
- Hargan-Calvopina J, Taylor S, Cook H, et al. Stage-specific demethylation in primordial germ cells safeguards against precocious differentiation. Dev Cell. 2016;39:75–86.
- Bogdanovic O, Smits AH, de la Calle Mustienes E, et al. Active DNA demethylation at enhancers during the vertebrate phylotypic period. Nat Genet. 2016;48:417–426.
- Hon GC, Rajagopal N, Shen Y, et al. Epigenetic memory at embryonic enhancers identified in DNA methylation maps from adult mouse tissues. Nat Genet. 2013;45:1198–1206.
- Gkountela S, Zhang KX, Shafiq TA, et al. DNA demethylation dynamics in the human prenatal germline. Cell. 2015;161:1425–1436.
- Guo F, Yan L, Guo H, et al. The transcriptome and DNA methylome landscapes of human primordial germ cells. Cell. 2015;161:1437–1452.
- Tang WW, Dietmann S, Irie N, et al. A unique gene regulatory network resets the human germline epigenome for development. Cell. 2015;161:1453–1467.
- Guo JU, Su Y, Shin JH, et al. Distribution, recognition and regulation of non-CpG methylation in the adult mammalian brain. Nat Neurosci. 2014;17:215–222.
- Smith ZD, Chan MM, Humm KC, et al. DNA methylation dynamics of the human preimplantation embryo. Nature. 2014;511:611–615.
- Guo H, Zhu P, Yan L, et al. The DNA methylation landscape of human early embryos. Nature. 2014;511:606–610.
- Gosden R, Trasler J, Lucifero D, et al. Rare congenital disorders, imprinted genes, and assisted reproductive technology. Lancet. 2003;361:1975–1977.
- Maher ER. Imprinting and assisted reproductive technology. Hum Mol Genet. 2005;14 Spec No 1:R133–R138.
- Sutcliffe AG, Peters CJ, Bowdin S, et al. Assisted reproductive therapies and imprinting disorders – a preliminary British survey. Hum Reprod. 2006;21:1009–1011.
- DeBaun MR, Niemitz EL, Feinberg AP. Association of in vitro fertilization with Beckwith-Wiedemann syndrome and epigenetic alterations of LIT1 and H19. Am J Hum Genet. 2003;72:156–160.
- Gicquel C, Gaston V, Mandelbaum J, et al. In vitro fertilization may increase the risk of Beckwith-Wiedemann syndrome related to the abnormal imprinting of the KCN1OT gene. Am J Hum Genet. 2003;72:1338–1341.
- Sato A, Otsu E, Negishi H, et al. Aberrant DNA methylation of imprinted loci in superovulated oocytes. Hum Reprod. 2007;22:26–35.
- Khosla S, Dean W, Brown D, et al. Culture of preimplantation mouse embryos affects fetal development and the expression of imprinted genes. Biol Reprod. 2001;64:918–926.
- Rivera RM, Stein P, Weaver JR, et al. Manipulations of mouse embryos prior to implantation result in aberrant expression of imprinted genes on day 9.5 of development. Hum Mol Genet. 2008;17:1–14.
- Mann MR, Lee SS, Doherty AS, et al. Selective loss of imprinting in the placenta following preimplantation development in culture. Development. 2004;131:3727–3735.
- Doherty AS, Mann MR, Tremblay KD, et al. Differential effects of culture on imprinted H19 expression in the preimplantation mouse embryo. Biol Reprod. 2000;62:1526–1535.
- Young LE, Fernandes K, McEvoy TG, et al. Epigenetic change in IGF2R is associated with fetal overgrowth after sheep embryo culture. Nat Genet. 2001;27:153–154.
- Rexhaj E, Paoloni-Giacobino A, Rimoldi SF, et al. Mice generated by in vitro fertilization exhibit vascular dysfunction and shortened life span. J Clin Invest. 2013;123:5052–5060.
- Gravina S, Dong X, Yu B, et al. Single-cell genome-wide bisulfite sequencing uncovers extensive heterogeneity in the mouse liver methylome. Genome Biol. 2016;17:150.
- Yu B, Dong X, Gravina S, et al. Genome-wide, single-cell DNA methylomics reveals increased non-CpG methylation during human oocyte maturation. Stem Cell Reports. 2017;9:397–407.
- Smallwood SA, Lee HJ, Angermueller C, et al. Single-cell genome-wide bisulfite sequencing for assessing epigenetic heterogeneity. Nat Methods. 2014;11:817–820.
- Chang AS, Moley KH, Wangler M, et al. Association between Beckwith-Wiedemann syndrome and assisted reproductive technology: a case series of 19 patients. Fertil Steril. 2005;83:349–354.
- Ludwig M, Katalinic A, Gross S, et al. Increased prevalence of imprinting defects in patients with Angelman syndrome born to subfertile couples. J Med Genet. 2005;42:289–291.
- Market-Velker BA, Zhang L, Magri LS, et al. Dual effects of superovulation: loss of maternal and paternal imprinted methylation in a dose-dependent manner. Hum Mol Genet. 2010;19:36–51.
- Wu J, Huang B, Chen H, et al. The landscape of accessible chromatin in mammalian preimplantation embryos. Nature. 2016;534:652–657.
- Katari S, Turan N, Bibikova M, et al. DNA methylation and gene expression differences in children conceived in vitro or in vivo. Hum Mol Genet. 2009;18:3769–3778.
- Mahaira LG, Katsara O, Pappou E, et al. IGF2BP1 expression in human mesenchymal stem cells significantly affects their proliferation and is under the epigenetic control of TET1/2 demethylases. Stem Cells Dev. 2014;23:2501–2512.
- Davudian S, Mansoori B, Shajari N, et al. BACH1, the master regulator gene: a novel candidate target for cancer therapy. Gene. 2016;588:30–37.
- Rinaudo PF, Giritharan G, Talbi S, et al. Effects of oxygen tension on gene expression in preimplantation mouse embryos. Fertil Steril. 2006;86:1252–1265, 1265 e1251–e1236.
- Sullivan GM, Feinn R. Using effect size – or why the P value is not enough. J Grad Med Educ. 2012;4:279–282.