
 ?Mathematical formulae have been encoded as MathML and are displayed in this HTML version using MathJax in order to improve their display. Uncheck the box to turn MathJax off. This feature requires Javascript. Click on a formula to zoom.
ABSTRACT
Human exposure to trichloroethylene (TCE) is linked to kidney cancer, autoimmune diseases, and probably non-Hodgkin lymphoma. Additionally, TCE exposed mice and cell cultures show altered DNA methylation. To evaluate associations between TCE exposure and DNA methylation in humans, we conducted an epigenome-wide association study (EWAS) in TCE exposed workers using the HumanMethylation450 BeadChip. Across individual CpG probes, genomic regions, and globally (i.e., the 450K methylome), we investigated differences in mean DNA methylation and differences in variability of DNA methylation between 73 control (< 0.005 ppm TCE), 30 lower exposed (< 10 ppm TCE), and 37 higher exposed ( 10 ppm TCE) subjects’ white blood cells. We found that TCE exposure increased methylation variation globally (Kruskal-Wallis p-value = 3.75e-3) and in 25 CpG sites at a genome-wide significance level (Bonferroni p-value < 0.05). We identified a 609 basepair region in the TRIM68 gene promoter that exhibited hypomethylation with increased exposure to TCE (FWER = 1.20e-2). Also, genes that matched to differentially variable CpGs were enriched in the ‘focal adhesion’ biological pathway (p-value = 2.80e-2). All in all, human exposure to TCE was associated with epigenetic alterations in genes involved in cell-matrix adhesions and interferon subtype expression, which are important in the development of autoimmune diseases; and in genes related to cancer development. These results suggest that DNA methylation may play a role in the pathogenesis of TCE exposure-related diseases and that TCE exposure may contribute to epigenetic drift.
Introduction
Trichloroethylene (TCE) is a volatile organic compound that was widely used in industrial settings and is now a widespread environmental contaminant that is present in drinking water, indoor environments, surface water, ambient air, groundwater, and soil. Multiple lines of evidence support a link between TCE exposure and cancer, particularly kidney cancer and probably non-Hodgkin lymphoma (NHL), which led the International Agency for Research on Cancer (IARC) to classify TCE as a Group 1 carcinogen [Citation1]. TCE also produces other toxic effects including neurotoxicity, immunotoxicity, developmental cardiac toxicity, kidney toxicity, liver toxicity, and male reproductive toxicity [Citation2]. The link between TCE and autoimmune dysfunction is particularly intriguing since it has been implicated in several diseases such as rheumatoid arthritis (RA), systemic lupus erythematosus (SLE), and Sjögren syndrome (SS) [Citation3,Citation4].
Despite the associations of TCE exposure with a range of cancer and non-cancer outcomes, the molecular mechanism(s) of TCE-induced health effects are unclear. A potential mechanism contributing to TCE toxicity might be through alterations of DNA methylation. This commonly studied epigenetic mark involves the addition of a methyl group to cytosine that is adjacent to a guanine (a CpG) site. DNA methylation modulates transcription by altering accessibility of proteins to DNA and it is a key regulator of a number of important processes such as aging, disease, and development [Citation5]. DNA methylation has also become increasingly recognized as a mediator of toxicity of environmental chemical exposures [Citation6].
TCE induces epigenetic aberrations in various model systems. For example, TCE exposure led to dissociation of DNA methyltransferase 3a from heterochromatin in a dose-dependent manner in HeLa and HEK293 cells, which resulted in global DNA hypomethylation [Citation7]. In mouse effector/memory CD4 + T cells, TCE exposure led to DNA methylation alterations that were enriched in polycomb protein binding sites [Citation8], along with hypermethylation and increased variance of DNA methylation of the interferon-gamma promoter [Citation9]. Also, cardiac myoblast cells and rat embryonic cardiac tissue exposed to TCE exhibited Serca2 promoter region hypermethylation [Citation10].
To our knowledge, there have been no epigenetic studies in TCE exposed humans. The objective of this epigenome-wide association study (EWAS) was to investigate differences of blood DNA methylation between three comparison groups (higher TCE exposed, lower TCE exposed, and controls) whose exposure status to TCE and other hazardous chemicals was well characterized and biologically verified [Citation11]. This EWAS utilized the Illumina Infinium HumanMethylation450 BeadChip to quantify DNA methylation. Studies of relationships between DNA methylation and a particular phenotype are commonly focused on the identification of differences of mean DNA methylation between comparison groups. A complementary assessment of differential mean DNA methylation is differential variability, which describes changes in DNA methylation value variability across comparison groups – potentially characterizing environmental contributors of epigenetic drift. Increased DNA methylation variability has been described in cancer [Citation12] and RA [Citation13]. We therefore examined differential variability of methylation in addition to differential mean methylation in relation to the three comparison groups of controls, lower TCE exposed, and higher TCE exposed.
Results
We examined genome-wide DNA methylation in the blood of 73 control (< 0.005ppm), 30 lower TCE exposed (< 10 ppm), and 37 higher TCE exposed ( 10 ppm) workers. A cutoff of 10ppm as an 8-hour time weighted average was used to differentiate lower and higher TCE exposed subjects, as this is the occupational standard in many countries. Demographic characteristics were comparable among the three groups (). Blood cell counts varied among the three groups; most notably the average number of lymphocytes decreased from 2,115,616 (36%) in controls to 2,065,333 (32%) in the lower TCE exposed group, and to 1,685,946 (30%) in the higher TCE exposed group. The present study was approved by the Institutional Review Boards at the U.S. National Cancer Institute and the Guangdong National Poison Control Center, China and is described in detail elsewhere [Citation11].
Table 1. Demographic characteristics and TCE exposure level.
TCE exposure associates with variance of global DNA methylation
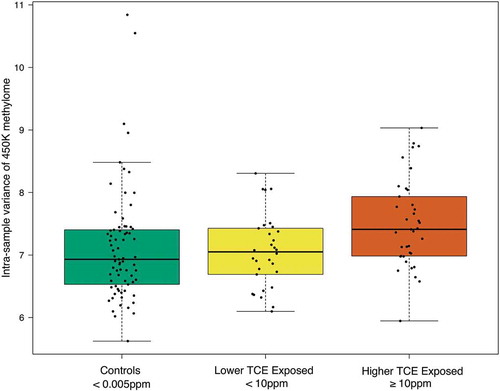
Differences in global DNA methylation across the three comparison groups were assessed using CpG probes on the 450K array. Thus, this assessment is only a representative measure of global DNA methylation of the 450K array, and not the entire genome. The variance of global DNA methylation was significantly different across the TCE exposure groups (Kruskal-Wallis test p-value = 0.00375) (). The pairs of TCE exposure groups that differed significantly from each other in terms of this variance were the higher TCE exposed subjects and lower TCE exposed subjects (Dunn test Benjamini-Hochberg adjusted p-value = 0.0108), and the higher TCE exposed subjects and control subjects (Dunn test Benjamini-Hochberg adjusted p-value = 0.0018). The lower TCE exposed subjects and control subjects did not differ significantly from each other in terms of the variance of global DNA methylation. We observed no statistically significant change in global DNA methylation means or medians across TCE exposure groups.
Figure 1. Global effect of human exposure to TCE. Box/scatter plots of the variance of methylation (M-value) values across all 399,439 CpG probes, categorized by varying levels of occupational exposure to TCE. Each point represents one subjects’ variance of global DNA methylation and the boxplots display the exposure-specific distribution of these points. Data was analyzed with the Kruskal-Wallis test and with Dunn’s post-hoc test. There were statistically significant differences in the variance of global DNA methylation between the TCE exposure groups (Kruskal-Wallis test p-value = 3.75e-3). The pairs that differed significantly from each other were the higher and lower TCE exposed (Dunn test Benjamini-Hochberg adjusted p-value = 0.0108) and the higher TCE exposed and controls (Dunn test Benjamini-Hochberg adjusted p-value = 0.0018).
Association between TCE exposure and DNA CpG methylation
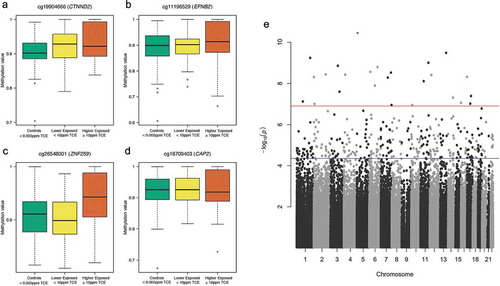
Across the three comparison groups, we identified differentially methylated CpG sites/probes in terms of the mean (DMPs) and variability (DVPs). We adjusted for measured blood cell counts (granulocytes, B cells, NK cells, CD4 cells, CD8 cells), body mass index, age, smoking, and sex. No DMP achieved genome-wide significance (Bonferroni corrected p-value < 0.05) or significance based on a Benjamini-Hochberg (BH) adjusted p-value < 0.05. The genomic inflation factor GC for the DMP results was 1.039, suggesting no inflation of the DMP p-values. For the DVP analysis, 301 probes achieved significance based on the BH correction, and 25 probes achieved genome-wide significance based on the Bonferroni correction (). Significant probes that matched to single nucleotide polymorphisms (SNPs) specific to the East Asian super-population (EAS) were filtered out. This population-specific SNP filtering resulted in the removal of 13 of the 301 BH-significant DVPs. None of the 25 genome-wide significant DVPs matched to EAS SNPs (Supplementary Table S1). Four of the five most significant DVPs are shown in ) (CTNND2, EFNB2, CAP2, ZNF259), and are related to immune disorders and cancer. A Manhattan plot of the DVP results is shown in . The
GC for the DVP results was 1.181, suggesting minimal inflation of the DVP p-values.
Table 2. Genome-wide significant (Bonferroni corrected p-value < 0.05) differentially variable probes (DVPs) between the higher TCE exposed, lower TCE exposed, and control subjects.
Figure 2. Differentially variable CpG probes (DVPs) in genes CTNND2 (a), EFNB2 (b), ZNF259 (c), and CAP2 (d) following varying levels of exposure to TCE and Manhattan plot of DVP results (e). The three boxplots displayed for each DVP (A-D) juxtapose the distribution of methylation values (β-values) with the levels of TCE exposure. A wide box is an indicator of increased variability of methylation, and a compressed box is indicative of decreased variability of methylation. The Manhattan plot (e) shows the negative log10 p-value for each CpG probe when tested for differences in variability across the three comparison groups. The red horizontal line (–log10(p) about 7) denotes the threshold for genome-wide significance (Bonferroni corrected p-value < 0.05) and the blue horizontal line (–log10(p) around 4.5) denotes the threshold for DVPs that achieved a Benjamini-Hochberg corrected p-value < 0.05.
Regions of DNA methylation associate with TCE exposure
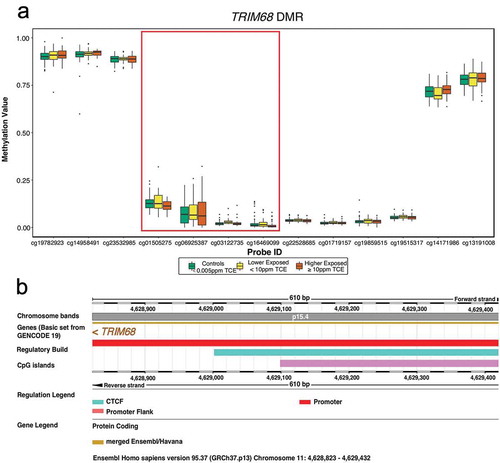
Examination of differential mean methylation across genomic regions considered both small-scale regions of CpG probes (DMRs) and large open-sea cluster regions, or ‘blocks’, of CpG probes (DMBs). DMR and DMB analyses adjusted for the same measured nuisance variables as DMP and DVP analyses. For the DMR analysis, 1,197 candidate regions were identified and 69 achieved significance based on an unadjusted p-value < 0.05 (Supplementary Table S2). One DMR with 4 CpGs achieved genome-wide significance based on a family-wise error rate (FWER) < 0.05 (). This genome-wide significant DMR spans 609 basepairs and overlaps with the TRIM68 promoter, a CpG island, and a CCCTC-binding factor (CTCF) region (). For the DMB analysis, 168 candidate blocks were identified: 15 achieved significance based on an unadjusted p-value < 0.05 (Supplementary Table S3) and no DMB achieved genome-wide significance.
Table 3. Top 10 differentially mean methylated regions (DMRs) between the higher TCE exposed, lower TCE exposed, and control subjects.
Figure 3. Genome-wide significant differentially methylated region (DMR) comprised of 4 CpG probes and exhibiting hypomethylation with increased exposure to TCE (a). The DMR spans 610 basepairs on chromosome 11 and is located in the TRIM68 gene promoter (b). Also in this region is a CpG island and binding site for CTCF, an insulator protein that regulates chromatin opening and closing (b). The TRIM68 gene is represented by 13 CpG probes on the 450K array and, for each of these CpG probes, the TCE exposure-specific distribution of methylation values (β-values) is shown (a). The 4 probes emphasized in (a) are those that constitute the DMR (cg01505275, cg06925387, cg03122735, and cg16469099). The DMR was annotated with Ensembl version GRCh37.p13.
Overlap of differential methylation with genomic features and biological pathways
The following results were mapped to genes: 288 DVPs that achieved a false discovery rate (FDR) threshold of 0.05 and did not match to EAS SNPs (Supplementary Table S1(N-P)); 69 DMRs that achieved an unadjusted p-value < 0.05 (Supplementary Table S2(I-K)); and 15 DMBs that achieved an unadjusted p-value < 0.05 and (Supplementary Table S3(I-K)). Successful overlap with genes occurred for 209 (73%) of the 288 DVPs, which linked to 219 genes; 58 (84%) of the 69 DMRs, which linked to 74 genes; and 13 (87%) of the 15 DMBs, which linked to 42 genes. Genes HAT1, ANP32A, and FBXO31 were found to be the same across the DVP and DMR genes. One gene, SYCP2, overlapped across the DVP and DMB genes.
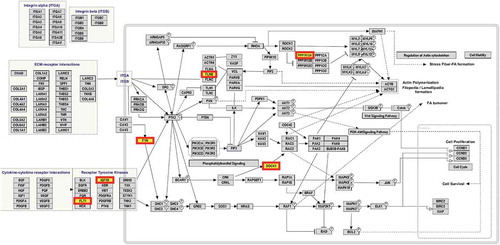
The list of 219 genes that matched to the 288 BH-significant DVPs were considered in a biological pathway analysis using WikiPathways. This resulted in the identification of 5 potentially altered pathways (), but only one, ‘focal adhesion’, was significant (p-value = 0.0208) (). The 219 candidate genes were also compared to the Comparative Toxicogenomics Database (CTD) and the query included genes that have been previously associated with TCE exposure, NHL, kidney cancer, liver cancer, and various autoimmune diseases. 33 of the 219 candidate DVP genes overlapped with genes from the CTD query (Supplementary Table S1(Q)). 4 of these 33 genes overlapped with multiple entries from the CTD query: PXK has been associated with RA and SLE; GLIPR1 with TCE exposure and kidney cancer; IGF1R with liver cancer and autoimmune diseases; and CD2 with RA and other autoimmune diseases.
Table 4. Biological pathways identified from genes that matched to differentially variable probes (DVPs) which achieved Benjamini-Hochberg adjusted p-value < 0.05 and did not match to East Asian super-population SNPs.
Figure 4. Focal adhesion pathway with enriched genes DOCK1, FLNB, FLT1, FYN, IGF1R, PPP1R12A.. Analysis of biological pathways with WikiPathways considered a list of 219 candidate genes which matched to 288 significant DVPs that achieved Benjamini-Hochberg corrected p-value < 0.05 and did not match to East Asian superpopulation SNPs. Six of the candidate genes were found to be enriched in the focal adhesion pathway and are emphasized in the figure.
Discussion
This is the first EWAS in TCE-exposed humans. The results indicate that there are global, regional, and CpG-wide methylation alterations that are associated with TCE exposure. Across many CpGs and globally (i.e., the 450K methylome), we found that increased exposure to TCE associated with increased variability of DNA methylation. We also identified a 609 basepair region of 4 probes that exhibited hypomethylation with increased TCE exposure. This region is located in the TRIM68 gene, which is involved in interferon subtype expression. Differentially variable CpGs were enriched in genes involved in cancer development and cell-matrix adhesions. These study results suggest that TCE exposure may contribute to epigenetic drift and that DNA methylation may play a role in the pathogenesis of TCE exposure-related diseases.
Consistent with previous studies, the findings of differential variability support the links between TCE exposure and autoimmune dysfunction, and TCE exposure and cancer [Citation3,Citation4]. Furthermore, these results suggest that increased epigenetic variability may contribute to immunotoxicity and cancer resulting from TCE exposure. The phenomenon of increased epigenetic variability is considered to be a result of epigenetic instability or the loss of epigenetic control of genomics [Citation14], and it has been described incancer [Citation12] and RA [Citation13]. The most significant and biologically relevant DVPs were found in genes CTNND2 (Catenin Delta 2), EFNB2 (Ephrin B2), CAP2 (Cyclase Associated Actin Cytoskeleton Regulatory Protein 2), and ZNF259 (Zinc Finger Protein ZPR1/259), which have all been related to cancer and autoimmune disease [Citation15–Citation18]. Also, almost all of the 25 genome-wide significant DVPs were hypermethylated (Supplementary Table S1(J-M)) and, interestingly, this pattern was hypothesized in [Citation9]. Perhaps increased variability of DNA CpG methylation may be precursor to changes in mean DNA CpG methylation? In this study, maybe there was enough power to observe DVPs, but not DMPs? These possibilities remain speculative. Additional research is required to determine if differential variability of methylation is connected with differential mean methylation, and if TCE-induced health outcomes are related to TCE-induced epigenetic drift.
Examination of the genome-wide significant DMR in the promoter region of TRIM68 led to the formulation of another speculative, yet relevant, molecular mechanism. TRIM68 (Tripartite Motif Containing 68) is involved in immunity and cancer and has been shown to negatively regulate an antagonist of interferon gamma, interferon beta [Citation19]. A time-dependent effect of TCE on interferon gamma gene expression and protein expression was observed in mice [Citation9]. Also, an increase in interferon gamma has previously been reported as an effect of occupational exposure to TCE [Citation20]. Therefore, we suspect that TCE exposure might increase interferon gamma levels by lowering levels of interferon beta through elevated expression of TRIM68. This postulated molecular mechanism could contribute to autoimmune disease and cancer resulting from TCE exposure. Molecular assays are recommended to evaluate whether TCE-induced hypomethylation of the TRIM68 gene promoter in blood leads to increased expression of interferon gamma via decreased expression of interferon beta.
Biological pathway analysis identified the ‘focal adhesion’ pathway, which may be implicated in response to TCE exposure. Focal adhesions are multi-protein complexes created at cell-extracellular matrix contact points, involving actin filament bundles being anchored to transmembrane integrin-family receptors. These integrin-mediated adhesions dynamically form and are key regulators in cell migration, cell survival, and cell proliferation: processes that are involved in the development and progression of cancer and autoimmune disease [Citation21]. Interestingly, this pathway is also involved in the regulation of macrophage migration and decreased pulmonary macrophage phagocytosis has been reported in mice exposed to TCE via inhalation [Citation22]. An inspection of the genes in the focal adhesion pathway shows that the following six protein coding genes may be perturbed by TCE: DOCK1 (Dedicator of Cytokinesis 1), FLNB (Filamin B), FLT1 (Fms Related Tyrosine Kinase 1), FYN (FYN Proto-Oncogene, Src Family Tyrosine Kinase), IGF1R (Insulin Like Growth Factor 1 Receptor), PPP1R12A (Protein Phosphatase 1 Regulatory Subunit 12A). Further experimentation is essential to determine if the focal adhesion pathway, rather than the genes per se, is a target of TCE exposure.
The results of this study should be considered alongside the study’s limitations. The sample was from a Chinese population, which limits generalizability. Also, considering the smaller sample size and the number of sites assayed in the 450K array, none of the mean comparisons for individual CpG sites (DMPs) were significant after accounting for multiple testing. Still, there was enough statistical power in this study to observe significant variability comparisons for individual CpG sites (DVPs) after multiple hypothesis correction. The WikiPathways analysis was limited by the gene list being used as input, so the probe bias (i.e., the bias introduced by having a different number of CpG probes for each gene) could not be accounted for [Citation23]. However, since the gene list in this study was established from DVPs which achieved an FDR threshold of 0.05, the impact of probe bias is likely less severe. It is well known that differential DNA methylation in blood cells may be confounded by blood cell composition variations [Citation24]. It has also been shown that occupational exposure to TCE is associated with alterations of lymphocyte subset counts [Citation11], and in this study lymphocytes decreased with increased exposure to TCE. Thus, it was particularly crucial to account for differences in cell counts in this study. CBC and lymphocyte subsets were measured on the same day that the PBMCs were collected from the subjects, so we were able to adjust for the measured counts of granulocytes, B cells, NK cells, CD4 cells, and CD8 cells when linear models were fit to methylation probes. We also adjusted for body mass index, age, smoking, and sex. Due to the bio specimen and statistical protocols utilized in this study, the DNA methylation differences we identified are probably not due to confounding by blood cell composition variations. Nevertheless, to extend these findings, it is important to replicate them in larger studies and in other exposed populations. Also, it is unknown how human exposure over time might influence epigenetic changes, or if the observed alterations are reversible. Inferences regarding TCE-induced exposure effects over time cannot be made from this study, a limitation of all cross-sectional designs. Contrastingly, we would be remiss to not mention the strengths of this study which include (1) a rigorous design that incorporated technical replicates of DNA and measured (not estimated) cell count and phenotypic information for each subject, which is described in detail elsewhere [Citation11]; (2) a conservative methodology aimed at minimizing false discoveries, which included denotation of genome-wide significance only for results that achieved an FWER threshold of 0.05 (i.e., Bonferroni corrected p-values < 0.05) and stabilized t-statistics which have been shown to increase statistical power and perform better compared to ordinary t-statistics [Citation25]; and (3) assessment of differential DNA methylation in a variety of spatial (individual CpGs, genomic regions, and global/methylome) and statistical contexts (mean and variability).
In conclusion, this EWAS provided new insights on potential genes and pathways that may be involved in the human response to TCE exposure. These findings provide additional evidence that DNA methylation plays a role in the pathogenesis of TCE-related diseases. The results implicate several genes and the focal adhesion pathway. Further examination of the downstream effects of these TCE-induced methylation patterns on gene and protein expression are warranted; especially in the context of TRIM68 promoter hypomethylation and interferon subtype expression since these results suggest a mechanism that could explain the increase in interferon gamma from occupational exposure to TCE.
Methods
Study design
This cross-sectional study of TCE exposed workers and controls was performed in Guangdong Province, China [Citation11]. Exposed subjects were sampled from six factories that used TCE in manufacturing processes; had no detectable benzene, styrene, ethylene oxide, formaldehyde, or epichlorohydrin levels; and had low to negligible levels of other chlorinated solvents. Unexposed control subjects were sampled from four factories that were in the same geographical region as the factories that used TCE and controls were frequency-matched by sex and age (± 5 years) to exposed workers. Participation was voluntary and all subjects provided written informed consent. Any participant with a history of cancer, radiotherapy, chemotherapy, or a previous occupation with notable exposure to benzene, styrene, butadiene, and/or ionizing radiation was removed from the study. The study was approved by the Institutional Review Boards at the U.S. National Cancer Institute and the Guangdong National Poison Control Center, China. Subjects were categorized into three groups based on TCE exposure levels (controls, < 10 ppm, and ≥ 10 ppm as an 8-hour time-weighted average).
Exposure measurement and sample collection
Using 3M organic vapor monitoring (OVM) badges, full-shift personal air exposure measurements were taken over a three-week time-period, before blood collection. All samples were analyzed for TCE. A subset of 48 TCE exposed workers was analyzed for a panel of organic hydrocarbons including benzene, methylene chloride, perchloroethylene and epichlorohydrin. A subset of control workers was analyzed for TCE with the OVM badges. After exposure measurement, subject interviews were conducted in the form of a questionnaire that requested demographic, lifestyle, and occupational information. Subjects were asked to provide a 29 ml peripheral blood sample and undergo a physical examination.
DNA methylation assay
Within six hours of being collected, peripheral blood samples were delivered to the laboratory. On the same day that a peripheral blood sample was collected, the complete blood count (CBC) and lymphocyte subsets were analyzed. 155 samples (82 controls and 73 exposed workers) were selected for DNA methylation assay. DNA was extracted from blood cells by the phenol-chloroform extraction method. 14 technical replicates were selected at random from study samples in the control group (if available, otherwise cases were used) with the highest available DNA mass. 1000ng of sample DNA, according to Quant-iT PicoGreen dsDNA quantitation (Life Technologies, Grand Island, NY), was treated with sodium bisulfite using the EZ-96 DNA Methylation MagPrep Kit (Zymo Research, Irvine, CA) according to manufacturer-provided protocol. Bisulfite converted DNA samples were hybridized to the 12 sample Illumina HumanMethylation450 BeadChips using the Infinium HD Methylation protocol (Document 15,019,519 v01). The proportion of DNA methylation at each CpG site (also called the methylation β-value) is obtained as a ratio of the intensities of fluorescent signals. A β-value of 0 represents a completely unmethylated CpG site and a β-value of 1 represents a fully methylated CpG site. The logit2 transform of the β-value, the M-value, is utilized in downstream statistical analyses that incorporate parametric techniques.
DNA methylation data preprocessing
To reliably assess DNA methylation from the 450K array, data preprocessing is essential and commonly considers quality control, probe and sample filtering, normalization, and batch effect correction [Citation26]. The quality of the data and the experiment was investigated with the quality control report provided by the minfi software package [Citation27] on Bioconductor [Citation28]. No abnormalities, such as bisulfite conversion outliers, were detected from the strip plots of all internal control probes. No sample exhibited an irregular distribution of methylation values according to the density plots. However, additional sample-specific quality control led to the identification of 23 samples with greater than 1% of failed probes and 6 samples with low raw signal intensities (> 10 average log median signal in the methylated and unmethylated channels). Based on the quality control, the following filtering approaches were considered: (1) removing samples with a high proportion (> 1%) of failed probes; (2) removing samples with a high proportion (> 1%) of failed probes and removing probes; and (3) removing samples with a high proportion (> 1%) of failed probes, removing probes, and removing samples with low raw signal intensities. Probe filtering consisted of omitting probes that failed to hybridize to the array (detection p-value > .01), non-CpG probes, SNP-related probes according to Zhou [Citation29], multi-hit/cross-reactive probes, and probes located on sex chromosomes (Supplementary Table S4) [Citation26]. Among the three filtering approaches, the most conservative filtering approach (3) led to the highest correlation between technical replicates (Supplementary Table S5), measured with the limma [Citation30] duplicateCorrelation algorithm [Citation31] on Bioconductor. After this filtering (filtering samples with a high proportion of failed probes, filtering probes, and filtering samples with low signal intensities), 399,439 probes and 140 samples remained. Multiple normalizations from minfi and ENmix [Citation32] software were considered. The normalizations addressed various combinations of background correction, dye-bias correction, and probe-type bias correction [Citation26]. Minfi’s Illumina normalization resulted in the highest correlation between technical replicates, so it was retained for downstream analysis (Supplementary Table S6). The Illumina normalization implements the same normalization used in Genome Studio, the software provided by Illumina. After normalization, batch effects remained in the data due to the sample plate (Supplementary Figure S1). These batch effects were detected and visualized with the singular value decomposition (SVD) method [Citation33], provided by ChAMP [Citation34] software on Bioconductor. The SVD method assesses the significant components of variation in the data and, in an ideal scenario, the significant components of variation in the data would correlate with biological factor(s). However, after normalization, there still appeared to be a high amount of variation in the data due to the sample plate (Supplementary Figure S1). Hence, after normalization, methylation M-values were adjusted for sample plate using the sva ComBat algorithm [Citation35] on Bioconductor.
Association of DNA CpG methylation with TCE exposure
Genome-wide differential methylation analysis across comparison groups (37 higher exposed, 10 ppm TCE exposure; 30 lower exposed, < 10 ppm TCE exposure; and 73 controls, < 0.005 ppm TCE exposure) was performed with limma [Citation30] and missMethyl [Citation36] functionality, both available on Bioconductor [Citation28]. To measure differential mean DNA methylation (DMPs), linear models were fit to each of the 399,439 residualized (corrected for measured granulocytes, B cells, NK cells, CD4 cells, CD8 cells, BMI, age, smoking, and sex) methylation probe M-values by generalized least squares. To measure differentially variable DNA methylation (DVPs), linear models were fit to the absolute deviations from the group specific mean for each CpG probe [Citation37]. The same group of variables were controlled for in the DVP linear model as those included in the DMP linear model. It is well known that a simple t-test can result in many false discoveries in high-dimensional data, so after fitting the linear models we employed an empirical Bayes modelling framework to stabilize the t-statistics, which results in increased statistical power and better performance compared to ordinary t-statistics [Citation25]. The statistical significance was p-value < 0.05 for individual CpGs. To compare the genome-wide distribution of the p-values with the expected null distribution (DMP and DVP), we calculated the genomic inflation factor
GC [Citation38] from the results returned by the DMP and DVP analyses. Genome-wide significance was based on a family-wise error rate (FWER) threshold of 0.05 for p-values adjusted with the Bonferroni correction. CpGs that met a false discovery rate (FDR) threshold of 0.05 for p-values adjusted with the Benjamini-Hochberg method were filtered for population-specific genetic polymorphisms and then matched to genomic features and considered in pathway analysis. The filtering of genetic polymorphisms removed CpG probes annotated to East Asian super-population (EAS) SNPs. EAS was selected as the population because the Guangdong Province of China is large and inhabited by many Chinese ethnicities. The population-specific SNP annotation is provided by the omicsPrint software [Citation39] on Bioconductor.
Identification of differentially methylated regions and blocks associated with TCE exposure
We used the minfi software [Citation27] implementation of the bumphunter algorithm [Citation40] to examine differences in mean DNA methylation (M-values) across small scale regions of CpG probes (DMRs) and large, open-sea cluster regions of CpG probes, or blocks (DMBs), for the three comparison groups: 37 higher exposed ( 10 ppm TCE exposure), 30 lower exposed (< 10 ppm TCE exposure), and 73 controls (< 0.005 ppm TCE exposure). For the DMR analysis, clusters of probes were defined with a maximum separation of 1,000 base pairs and 1,000 bootstrap samples were drawn to generate a null distribution. Loess smoothed regression coefficients above (in absolute value) the 99th quantile of the bootstrap sampled null distribution defined the cutoff to select candidate regions. For the DMB analysis, loess smoothed regression coefficients above 0.1 defined the cutoff to select candidate blocks and 1,000 bootstrap samples generated the null distribution to test for statistical significance of the blocks. For both the DMR and the DMB analysis, regressions adjusted for the same covariates included in the DVP/DMP analyses (measured granulocytes, B cells, NK cells, CD4 cells, CD8 cells, BMI, age, smoking, and sex) and regions/blocks comprised of less than 3 CpG probes were filtered out. The bootstrap-based family-wise error rate (FWER) < 0.05 was defined as the threshold to denote genome-wide statistical significance of regions and blocks. DMRs and DMBs that achieved p-value < 0.05 and FWER
0.05 were considered individually (not genome-wide) statistically significant.
Association of global DNA methylation with TCE exposure
Global DNA methylation analysis considered the 399,439 CpG probes that remained after filtering and is therefore only a representative measure of a global DNA methylation for the 450K probes. For each subject, the mean, median, and variance of DNA methylation M-values was calculated using all 399,439 probes. Next, subjects were grouped together based on their TCE exposure status: higher exposed ( 10 ppm TCE exposure); lower exposed (< 10 ppm TCE exposure); and controls (< 0.005 ppm TCE exposure). We utilized ANOVA (or a similar alternative) to compare the means, medians, and variances of global DNA methylation across the TCE exposure groups. If any significant difference was detected, we examined which pair of groups showed a difference.
Overlap of significant findings with genomic features and biological pathways
Individually significant, p-value < 0.05, DMRs and DMBs were mapped to gene identifiers with BioMart – Ensembl (version GRCh37.p13) [Citation41]. DMPs and DVPs that met an FDR threshold of 0.05 and were not annotated as EAS SNPs were matched with gene information in the 450K array annotation file provided by Illumina (HumanMethylation450 v1.2 Annotation File), and this gene information established a list of candidate genes for downstream analyses. Using the publicly available Comparative Toxicogenomics Database (CTD) [Citation42], we compared our list of candidate genes to the CTD list of genes that have previously been shown to be associated with TCE exposure and its related diseases. Gene set enrichment analysis (GSEA) was performed using the Cytoscape [Citation43] ClueGO app [Citation44] and the WikiPathways repository (wikipathways.org), an open-source database of biological pathways [Citation45]. The candidate gene list that corresponded to significant results was used as input for GSEA. GSEA grouped genes together based on their involvement in the same biological pathway. The selection criteria for pathways were based on the candidate gene list: at least 3 genes and at least 2% of the total number of genes involved in a pathway. Pathway statistical inference was calculated using Fisher’s Exact Test, which considers the total number of genes present in pathways in relation to the candidate genes used as input for GSEA. An important limitation of this WikiPathways analysis is that the list of genes (not probes) were used as input for GSEA. Thus, the probe bias introduced by the design of the array, where there are varying numbers of probes per gene, could not be accounted for. The severity of this probe bias has been reported in GSEA where gene lists are established from probes which achieve significance based on a p-value < 0.05, but not in GSEA where gene lists are established from probes which achieve a threshold based on a multiple testing correction [Citation23]. Therefore, in this GSEA, the impact of unaccounted for probe bias is likely less severe.
Supplemental Material
Download MS Excel (99.4 KB)Supplemental Material
Download MS Word (695 KB)Acknowledgments
We thank Professor Andres Cardenas for critical reading and useful comments on the manuscript.
Disclosure statement
No potential conflict of interest was reported by the authors.
Supplementary material
Supplemental data for this article can be accessed here.
Additional information
Funding
Related Research Data
References
- International Agency for Research on C. IARC Monographs on the Evaluation of Carcinogenic Risks to Humans, Trichloroethylene, Tetrachloroethylene and Some Other Chlorinated Agents. Lyon: International Agency for Research on Cancer; 2014.
- Agency for Toxic S, Disease R. Toxicological Profile for Trichloroethylene (TCE). Atlanta, GA: U.S. Department of Health and Human Services, Public Health Service; 2014.
- Parks CG, De Roos AJ. Pesticides, chemical and industrial exposures in relation to systemic lupus erythematosus. Lupus. 2014 May;23(6):527–536. eng
- Huang Y, Xia L, Wu Q, et al. Trichloroethylene Hypersensitivity Syndrome Is Potentially Mediated through Its Metabolite Chloral Hydrate. PloS One. 2015;10(5):e0127101. eng.
- Jin Z, Liu Y. DNA methylation in human diseases. Genes Dis. 2018 Mar;5(1):1–8. eng
- Baccarelli A, Bollati V. Epigenetics and environmental chemicals. Curr Opin Pediatr. 2009 Apr;21(2):243–251. PubMed PMID: 19663042; PubMed Central PMCID: PMCPMC3035853.
- Cui Y, Choudhury SR, Irudayaraj J. Epigenetic Toxicity of Trichloroethylene: A Single-Molecule Perspective. Toxicol Res (Camb). 2016;5(2):641–650. eng
- Gilbert KM, Blossom SJ, Reisfeld B, et al. Trichloroethylene-induced alterations in DNA methylation were enriched in polycomb protein binding sites in effector/memory CD4+ T cells. Environ Epigenet. 2017 Jul;3(3). DOI:10.1093/eep/dvx013. eng.
- Gilbert KM, Blossom SJ, Erickson SW, et al. Chronic exposure to trichloroethylene increases DNA methylation of the Ifng promoter in CD4+ T cells. Toxicol Lett. 2016 Oct 17;260:1–7. eng.
- Palbykin B, Borg J, Caldwell PT, et al. Trichloroethylene induces methylation of the Serca2 promoter in H9c2 cells and embryonic heart. Cardiovasc Toxicol. 2011 Sept;11(3):204–214. eng.
- Lan Q, Zhang L, Tang X, et al. Occupational exposure to trichloroethylene is associated with a decline in lymphocyte subsets and soluble CD27 and CD30 markers. Carcinogenesis. 2010 Sept;31(9):1592–1596. eng.
- Teschendorff AE, Widschwendter M. Differential variability improves the identification of cancer risk markers in DNA methylation studies profiling precursor cancer lesions. Bioinformatics. 2012 Jun 01;28(11):1487–1494. eng.
- Webster AP, Plant D, Ecker S, et al. Increased DNA methylation variability in rheumatoid arthritis-discordant monozygotic twins. Genome Med. 2018 Sept 04;10(1):64. eng.
- Hansen KD, Timp W, Bravo HC, et al. Increased methylation variation in epigenetic domains across cancer types. Nat Genet. 2011 Jun 26;43(8):768–775. eng.
- Ghose S, Min Y, Lin PC. δ-Catenin activates Rho GTPase, promotes lymphangiogenesis and growth of tumor metastases. PloS One. 2015;10(1):e0116338. eng
- Luo H, Broux B, Wang X, et al. EphrinB1 and EphrinB2 regulate T cell chemotaxis and migration in experimental autoimmune encephalomyelitis and multiple sclerosis. Neurobiol Dis. 2016 Jul;91:292–306. eng.
- Shibata R, Mori T, Du W, et al. Overexpression of cyclase-associated protein 2 in multistage hepatocarcinogenesis. Clin Cancer Res. 2006 Nov 15;12(18):5363–5368. eng.
- Gangwani L. Deficiency of the zinc finger protein ZPR1 causes defects in transcription and cell cycle progression. J Biol Chem. 2006 Dec 29;281(52):40330–40340. eng.
- Wynne C, Lazzari E, Smith S, et al. TRIM68 negatively regulates IFN-β production by degrading TRK fused gene, a novel driver of IFN-β downstream of anti-viral detection systems. PloS One. 2014;9(7):e101503. eng.
- Iavicoli I, Marinaccio A, Carelli G. Effects of occupational trichloroethylene exposure on cytokine levels in workers. J Occup Environ Med. 2005 May;47(5):453–457. eng
- Zhao X, Guan J-L. Focal adhesion kinase and its signaling pathways in cell migration and angiogenesis. Adv Drug Deliv Rev. 2011 Jul 18;63(8):610–615. eng.
- Selgrade MK, Gilmour MI. Suppression of pulmonary host defenses and enhanced susceptibility to respiratory bacterial infection in mice following inhalation exposure to trichloroethylene and chloroform. J Immunotoxicol. 2010 Oct- undefined 12;7(4):350–356. eng.
- Geeleher P, Hartnett L, Egan LJ, et al. Gene-set analysis is severely biased when applied to genome-wide methylation data. Bioinformatics. 2013 Aug 1;29(15):1851–1857. PubMed PMID: 23732277.
- Jacoby M, Gohrbandt S, Clausse V, et al. Interindividual variability and co-regulation of DNA methylation differ among blood cell populations. Epigenetics. 2012 Dec 01;7(12):1421–1434. eng.
- Phipson B, Lee S, Majewski IJ, et al. Robust Hyperparameter Estimation Protects Against Hypervariable Genes and Improves Power to Detect Differential Expression. Ann Appl Stat. 2016;10(2):946–963. eng.
- Morris TJ, Beck S. Analysis pipelines and packages for Infinium HumanMethylation450 BeadChip (450k) data. Methods. 2015 Jan 15;72:3–8. eng.
- Aryee MJ, Jaffe AE, Corrada-Bravo H, et al. Minfi: a flexible and comprehensive Bioconductor package for the analysis of Infinium DNA methylation microarrays. Bioinformatics. 2014 May 15;30(10):1363–1369. eng.
- Gentleman RC, Carey VJ, Bates DM, et al. Bioconductor: open software development for computational biology and bioinformatics. Genome Biol. 2004;5(10):R80. eng.
- Zhou W, Laird PW, Shen H. Comprehensive characterization, annotation and innovative use of Infinium DNA methylation BeadChip probes. Nucleic Acids Res. 2017 Feb 28;45(4):e22. PubMed PMID: 27924034; PubMed Central PMCID: PMCPMC5389466.
- Ritchie ME, Phipson B, Wu D, et al. limma powers differential expression analyses for RNA-sequencing and microarray studies. Nucleic Acids Res. 2015 Apr 20;43(7):e47. eng.
- Smyth GK, Michaud J, Scott HS. Use of within-array replicate spots for assessing differential expression in microarray experiments. Bioinformatics. 2005 May 01;21(9):2067–2075. eng.
- Xu Z, Niu L, Li L, et al. ENmix: a novel background correction method for Illumina HumanMethylation450 BeadChip. Nucleic Acids Res. 2016 Feb 18;44(3):e20. PubMed PMID: 26384415; PubMed Central PMCID: PMCPMC4756845.
- Teschendorff AE, Menon U, Gentry-Maharaj A, et al. An epigenetic signature in peripheral blood predicts active ovarian cancer. PloS One. 2009 Dec 18;4(12):e8274. eng.
- Tian Y, Morris TJ, Webster AP, et al. ChAMP: updated methylation analysis pipeline for Illumina BeadChips. Bioinformatics. 2017 Dec 15;33(24):3982–3984. eng.
- Leek JT, Johnson WE, Parker HS, et al. The sva package for removing batch effects and other unwanted variation in high-throughput experiments. Bioinformatics. 2012 Mar 15;28(6):882–883. eng.
- Phipson B, Maksimovic J, Oshlack A. missMethyl: an R package for analyzing data from Illumina’s HumanMethylation450 platform. Bioinformatics. 2016 Jan 15;32(2):286–288. eng.
- Phipson B, Oshlack A. DiffVar: a new method for detecting differential variability with application to methylation in cancer and aging. Genome Biol. 2014 Sept 23;15(9):465. eng.
- Devlin B, Roeder K. Genomic control for association studies. Biometrics. 1999 Dec;55(4):997–1004. PubMed PMID: 11315092.
- van Iterson M, Cats D, Hop P, et al. omicsPrint: detection of data linkage errors in multiple omics studies. Bioinformatics. 2018 Jun 15;34(12):2142–2143. PubMed PMID: 29420690.
- Jaffe AE, Murakami P, Lee H, et al. Bump hunting to identify differentially methylated regions in epigenetic epidemiology studies. Int J Epidemiol. 2012 Feb;41(1):200–209. eng.
- Zerbino DR, Achuthan P, Akanni W, et al. Ensembl 2018. Nucleic Acids Res. 2018 Jan 04;46(D1):D754–D761. eng.
- Davis AP, Grondin CJ, Johnson RJ, et al. The Comparative Toxicogenomics Database: update 2017. Nucleic Acids Res. 2017 Jan 04;45(D1):D972–D978. eng.
- Shannon P, Markiel A, Ozier O, et al. Cytoscape: a software environment for integrated models of biomolecular interaction networks. Genome Res. 2003 Nov;13(11):2498–2504. eng.
- Bindea G, Mlecnik B, Hackl H, et al. ClueGO: a Cytoscape plug-in to decipher functionally grouped gene ontology and pathway annotation networks. Bioinformatics. 2009 Apr 15;25(8):1091–1093. eng.
- Slenter DN, Kutmon M, Hanspers K, et al. WikiPathways: a multifaceted pathway database bridging metabolomics to other omics research. Nucleic Acids Res. 2018 Jan 04;46(D1):D661–D667. eng.