
ABSTRACT
EZH2 is overexpressed in poor-prognostic chronic lymphocytic leukaemia (CLL) cases, acting as an oncogene; however, thus far, the EZH2 target genes in CLL have not been disclosed. In this study, using ChIP-sequencing, we identified EZH2 and H3K27me3 target genes in two prognostic subgroups of CLL with distinct prognosis and outcome, i.e., cases with unmutated (U-CLL, n = 6) or mutated IGHV genes (M-CLL, n = 6). While the majority of oncogenic pathways were equally enriched for EZH2 target genes in both prognostic subgroups, PI3K pathway genes were differentially bound by EZH2 in U-CLL versus M-CLL. The occupancy of EZH2 for selected PI3K pathway target genes was validated in additional CLL samples (n = 16) and CLL cell lines using siRNA-mediated EZH2 downregulation and ChIP assays. Intriguingly, we found that EZH2 directly binds to the IGF1R promoter along with MYC and upregulates IGF1R expression in U-CLL, leading to downstream PI3K activation. By investigating an independent CLL cohort (n = 96), a positive correlation was observed between EZH2 and IGF1R expression with higher levels in U-CLL compared to M-CLL. Accordingly, siRNA-mediated downregulation of either EZH2, MYC or IGF1R and treatment with EZH2 and MYC pharmacological inhibitors in the HG3 CLL cell line induced a significant reduction in PI3K pathway activation. In conclusion, we characterize for the first time EZH2 target genes in CLL revealing a hitherto unknown implication of EZH2 in modulating the PI3K pathway in a non-canonical, PRC2-independent way, with potential therapeutic implications considering that PI3K inhibitors are effective therapeutic agents for CLL.
Introduction
Dynamic regulation of covalent histone modifications at both promoter and enhancer regions plays a crucial role in modulating gene expression and cell fate specification [Citation1]. Polycomb group proteins represent major epigenetic regulators that control gene expression and are often found deregulated and involved in cancer initiation, progression and drug resistance [Citation2]. Enhancer of zeste homolog 2 (EZH2), one of the core members of the polycomb repressive complex 2 (PCR2), catalyzes trimethylation of lysine residue 27 of histone 3 (H3K27me3), a prototypical polycomb-associated repressive mark [Citation3]. EZH2 is frequently overexpressed in both solid tumours and haematological malignancies and associated with disease aggressiveness and a poor clinical outcome [Citation4,Citation5].
Multiple regulatory loops control EZH2 expression and activity through different transcription factors [Citation6], miRNAs [Citation7,Citation8] and long non-coding RNAs [Citation9], in addition to post-translational modifications [Citation10]. The latter are also critical for controlling EZH2 canonical (PRC2-dependent) and non-canonical biological functions (PRC2-independent) and contribute to the repression of tumour suppressor genes and activation of oncogenes in both solid tumours and haematological malignancies [Citation11].
We and others have reported that EZH2 is overexpressed in CLL and that its expression levels correlate to disease aggressiveness [Citation12,Citation13]. In detail, EZH2 was demonstrated to be significantly increased in clinically aggressive CLL patients carrying unmutated immunoglobulin heavy variable (IGHV) genes (U-CLL), as compared to IGHV-mutated CLL patients (M-CLL) who generally follow a more indolent disease course [Citation14]. Moreover, we have demonstrated a negative correlation between the expression of EZH2 and that of its negative regulators, such as miR26A1 [Citation8] and miR101 [Citation7], in CLL. In contrast, downregulation of EZH2, by either overexpressing miR26A1 [Citation8] or siRNA-mediated downmodulation of EZH2 expression or pharmacological inhibition of EZH2 catalytic activity [Citation14] induced increased CLL cell apoptosis, hence implying a pro-survival role of EZH2 in aggressive CLL.
Considering recent pre-clinical evidence that EZH2 inhibition may represent a promising treatment strategy for lymphomas [Citation15] including CLL [Citation8,Citation14], it is of utmost importance to characterize the EZH2 target genes in order to obtain insight into the precise functional role of EZH2 in CLL pathobiology. To this end, we performed ChIP-sequencing, allowing global mapping of epigenetic modifications and transcription factors interacting with DNA, in well-characterized CLL samples belonging to both U-CLL and M-CLL. Overall, we identified numerous EZH2 target genes and different oncogenic pathways enriched within both prognostic subgroups. Most notably, the PI3K/AKT pathway, known to be activated in CLL [Citation16], was identified as a key pathway preferentially targeted by EZH2 in U-CLL patients. We also found that EZH2 directly binds and recruits MYC onto the IGF1R promoter and upregulates its expression in U-CLL, leading to PI3K pathway activation in CLL primary cells [Citation17]. This finding appears particularly relevant considering the crucial role of immune signalling in CLL pathogenesis and the efficacy of the PI3Kδ inhibitor idelalisib in high-risk CLL [Citation18].
Results
Genome-wide mapping of EZH2 and H3K27me3 target genes in CLL
We performed ChIP-seq with EZH2 and H3K27me3 antibodies in 6 U-CLL and 6 M-CLL cases. Classification of EZH2 and H3K27me3 target genes into different gene categories showed that the majority were related to protein-coding genes in both U-CLL and M-CLL samples ()). After mapping the EZH2 target peaks across the genome, we observed that the majority (63–67%) were located on gene promoters; a similar distribution of EZH2 occupancy was observed in both U-CLL and M-CLL (Supplemental Figure 1A). In order to identify EZH2 target genes, we focused on genes (2,676 protein-coding genes) containing overlapping peaks of both EZH2 and H3K27me3 peaks (with a minimum of one base pair overlap) that were significantly enriched in either M-CLL or U-CLL or both groups. These genes are referred as EZH2-OP genes (genes with EZH2 overlapping peaks) (Supplementary Figure 1B). The remaining 10,239 EZH2-target genes that did not show any overlap with H3K27me3 peaks were termed EZH2-NOP (EZH2 non-overlapping genes). Additional Venn diagrams for EZH2 in M-CLL and U-CLL are shown in Supplemental Figure 1B; full gene lists are provided in Supplemental Table 3. When the EZH2 enrichment levels were compared between M-CLL and U-CLL samples for EZH2-OP genes, 45.5% (n = 1,218) of genes were found to be overlapping between M-CLL and U-CLL, whereas 44.5% (n = 1,190) of genes were specifically enriched in U-CLL and only 10% (n = 268) of genes were enriched in M-CLL ()). In constrast, when all EZH2 genes were considered, around 90% overlap was observed between M-CLL and U-CLL samples (Supplementary Figure 1B).
Figure 1. Genome-wide distribution and peak enrichment of EZH2 and H3K27me3 target genes in CLL. (a) Bar plots showing the total number of EZH2 and H3K27me3 target genes in both M-CLL and U-CLL samples. (b) Venn diagram showing the overlap of protein-coding genes between M-CLL and U-CLL samples for EZH2-OP genes. The brown colour represents, the number of genes that are common between U-CLL and M-CLL, whereas the green and blue colour bars indicate the number of genes specific for U-CLL and M-CLL, respectively. The percentage of overlap is mentioned below the figure. (c) Heatmaps showing the ChIP-seq read densities of M-CLL (dark blue) and U-CLL (dark green) for EZH2 peaks and M-CLL (light blue) and U-CLL (light green) for H3K27me3 peaks across the TSS (±5 kb) for EZH2_OP target genes. White colour represents the degree of ChIP-seq signal enrichment on TSS. The colour code for peak enrichment scores is mentioned below the figure. On the top, the enrichment plots represent ChIP seq read density at TSS (±5 kb) for M-CLL and U-CLL sample peaks. Narrow peaks indicate stronger binding at TSS region and broader peaks indicate the distance of peak signal spread upstream and downstream to the TSS. The difference in median enrichment of the genes is determined using the Wilcoxon signed rank sum test. (d) Average ChIP-seq signal enrichment at TSS (±5 kb) for EZH2-NOP target genes between M-CLL and U-CLL samples. e) The enrichment plots showing ChIP seq read density at TSS (±5 kb) between M-CLL and U-CLL samples for EZH2_NOP and EZH2_OP PI3K pathway genes. f) Box plots showing enrichment levels between M-CLL and U-CLL samples for EZH2 and H3K27me3 peaks. p value analysed using Wilcoxon signed rank sum test for determining the median enrichment difference of the genes.
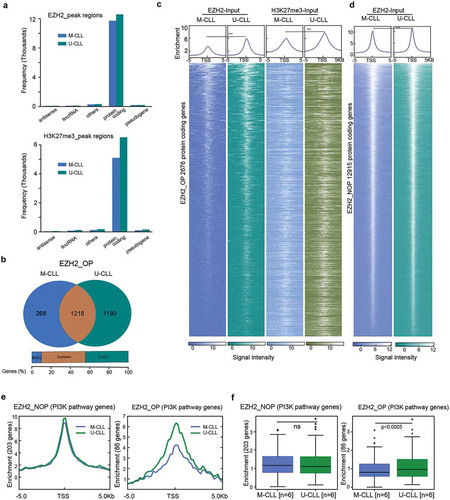
Next, using published CLL RNA-seq data [Citation19] we evaluated the expression levels for the 2676 EZH2-OP genes. Interestingly, despite having H3K27me3 peaks, 30% of genes (613 genes) displayed significant differential RNA expression (p < 0.05) between M-CLL and U-CLL samples with most of the genes upregulated in U-CLL compared to M-CLL samples (Supplementary Figure 1C), indicating that EZH2 may act as transcriptional activator, by interacting with other factors to overcome the effects of H3K27me3 for these genes in U-CLL.
,) shows the peak enrichment levels at TSS (±5 kb) for EZH2-OP and EZH2-NOP genes for both M-CLL and U-CLL. Overall, we observed a comparable distribution and classification of EZH2 target peaks in both M-CLL and U-CLL. Narrow and sharp EZH2 peaks around the TSS indicate high levels of EZH2 binding, whereas wide H3K27me3 peaks around the TSS indicate that the signal is spread across the TSS ()). Nevertheless, higher median enrichment levels were seen for EZH2-OP genes in U-CLL vs M-CLL ()).
EZH2 targets signalling pathways critical for CLL biology
In order to gain insight into the affected biological functions and processes, we performed enrichment analysis using the EZH2-OP genes (n = 2,676). KEGG pathway analysis identified numerous oncogenic pathways significantly enriched in one or both prognostic subgroups (Supplemental Figure 2A). Most pathways identified with enrichment of EZH2 target genes, such as the Wnt, TGF-beta, PI3K and Notch signalling pathways have previously been associated with CLL [Citation20,Citation21]. While the majority of pathways were highly enriched in both U-CLL and M-CLL, the PI3K pathway was identified as differentially enriched in U-CLL vs M-CLL regarding EZH2 binding (Supplemental Figure 2A). To further confirm the differential enriched pathways between M-CLL and U-CLL samples, we selected only U-CLL specific genes (1,190) and M-CLL specific genes (268) and again identified the PI3K pathway among the top differentially enriched pathways (Supplementary Figure 2B). Next, we analysed the peak enrichment between M-CLL and U-CLL for EZH2-OP (86 genes) and EZH2-NOP (203 genes) PI3K pathway genes. As expected, we observed a higher enrichment of EZH2 peaks in U-CLL versus M-CLL for EZH2-OP PI3K genes, while no significant difference was observed for EZH2-NOP PI3K genes (,)). A detailed list of all PI3K genes with peak scores is given in Supplemental Table 4, and the total number of both EZH2 PI3K pathway target genes that are overlapping and specific between M-CLL and U-CLL is shown in Supplemental Figure 2C.
EZH2 differentially regulates the PI3K pathway in CLL
Next, we selected the top five PI3K pathway genes that exhibited both differential EZH2 binding from the ChIP-sequencing data and differential expression levels between M-CLL versus U-CLL cases using published RNA-sequencing data [Citation19] (,)). Of these, the ITGA2B, ANGPT2 and IGF1R genes showed strong EZH2 binding in U-CLL cases, whereas the PRKCA and MET demonstrated strong EZH2 binding in M-CLL cases. In M-CLL, the MET and PRKCA genes displayed higher occupancy of EZH2 and decreased expression levels compared to U-CLL (Log2FC: −1.71 and −1.95; and p value: 0.019 and 0.0001, respectively). In U-CLL, the ITGAB2 gene showed increased occupancy of EZH2 resulting in lower expression compared to M-CLL (Log2FC: −0.93; p value: 0.014). Interestingly, IGF1R and ANGPT2, more enriched with EZH2 in U-CLL, demonstrated increased expression in U-CLL vs. M-CLL (Log2FC: 1.41 and 1.16; p value: 0.0001 and 0.011, respectively), indicating that EZH2 might also function non-canonically in activating these genes in clinically aggressive CLL.
Figure 2. Validating the EZH2 binding and expression levels on selected PI3K target genes. (a) Heatmap showing the W-score enrichment levels for the differential EZH2 binding PI3K genes revealed from ChIP-seq data. The scale for W-score enrichment level is mentioned above the heatmap. (b) Bar graph showing the top PI3K pathway genes with significant differential expression, log2FC values (calculated as log2 [mean (M-CLL)/mean (U-CLL)) from published RNA-seq data. Red bars indicate upregulated genes and green bars indicate down-regulated genes. Left side plot shows U-CLL specific target genes and right side plot shows M-CLL specific EZH2 target genes. (c and d) ChIP assay data showing the average fold enrichment of EZH2 (c) and H3K27me3 (d) for 5 U-CLL specific binding target genes and 2 M-CLL specific binding target genes using a total of 16 CLL samples belonging to M-CLL (n = 9) and U-CLL (n = 7). *indicates P value <0.05 and ** indicates P value<0.005. (e) Histogram plot showing relative band intensities for pAKT/AKT levels from the below Western blot analysis for 8 M-CLL and 8 U-CLL samples.
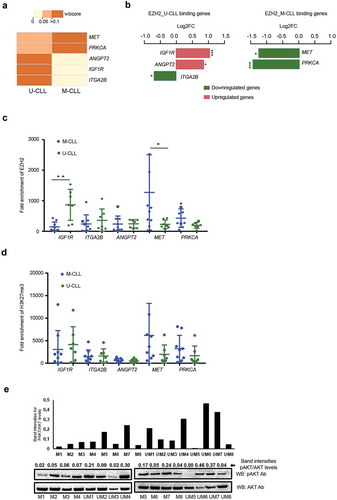
In order to validate our findings, we investigated EZH2 occupancy in PI3K genes in an independent set of 16 CLL samples. In line with our ChIP-seq data, all U-CLL EZH2 target genes (ITAG2B, IGF1R and ANGPT2) displayed stronger EZH2 binding in U-CLL, whereas M-CLL EZH2 target genes (PRKCA and MET) showed higher enrichment in M-CLL ()). Amongst these genes, IGF1R and MET demonstrated significant differences between U-CLL vs M-CLL samples ()). However, no difference was observed for H3K27me3 occupancy between U-CLL and M-CLL cases for these genes ()). To explore the possibility of differential activation of the PI3K pathway, we performed Western blot analysis showing a significantly higher activation (p = 0.01) of active AKT [calculated as the ratio between phosphorylated AKT (pAKT) and total AKT levels] in U-CLL (eight cases) versus M-CLL (eight cases; )), supporting the differential binding of PI3K genes based on our ChIP-seq data.
PI3K activation in CLL cell lines
To further validate the specificity and effect of EZH2 on PI3K pathway target genes, we performed ChIP assays in two CLL cell lines, HG3 [Citation22] and MEC1 [Citation23], using EZH2 and H3K27me3 antibodies. As shown in ), HG3 demonstrated enrichment of EZH2 compared to MEC1, whereas H3K27me3 occupancy was only observed in MEC1. Accordingly, when we analyzed pAKT and AKT protein levels in both cell lines, the PI3K pathway was more active in HG3 compared to MEC1 cells ()). Next, in order to check the specificity of EZH2 binding, we performed siRNA-mediated EZH2 downregulation in the HG3 cell line, and checked for EZH2 occupancy and changes in expression levels for the selected genes. Except PRKCA, all genes showed reduced EZH2 occupancy compared to controls, supporting EZH2 binding specificity on these target genes ()). Decreased expression levels after EZH2 silencing were found for ITGA2B and IGF1R while MET displayed increased expression (ANGPT2 and PRKCA were not expressed in this cell line) ()).
Figure 3. EZH2 occupancy and activation of the PI3K pathway in CLL cell lines. (a) ChIP assay data showing the average fold enrichment of EZH2 and H3K27me3 for the selected PI3K pathway target genes in the HG3 and MEC1 cell lines. (b) Western blot analysis showing protein levels for different antibodies in the HG3 and MEC1 cell lines. (c) Log10Fold change expression levels for the selected PI3K pathway target genes in EZH2 siRNA downregulated HG3 cells over control siRNA samples. (d) Western blot analysis showing protein levels for different antibodies in HG3 control siRNA and EZH2 siRNA transfected cells. (f and g) Western blot analysis showing protein levels for different antibodies using DZNep inhibitor drug and HMT inhibitor drug treatment (GSK353 and UNC1999) of HG3 cells. (h and i) The levels of active AKT analysed using the Akt Kinase activity assay kit for different EZH2 siRNA transfected and drug-treated HG3 cells.
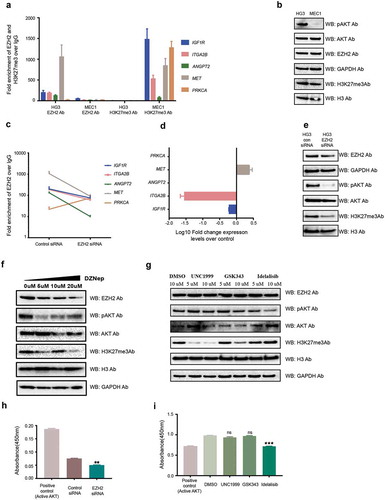
Upon siRNA-mediated down-regulation of EZH2, pAKT levels decreased in the HG3 cell line compared to control siRNA samples ()). At the same time, H3K27me3 decreased correlating with a decrease in EZH2 levels ()). We also treated the HG3 cell line with an EZH2 inhibitor drug, DZNep, to reduce global EZH2 levels. Similarly, increasing concentration of DZNep resulted in a gradual reduction in pAKT levels correlating with the reduction of EZH2 and H3K27me3 levels ()). To further support that EZH2 regulates the PI3K pathway in an H3K27me3-independent manner, we treated the HG3 cell line with two different EZH2 histone methyltransferase inhibitor drugs (UNC1999, which inhibits HMT activity of both EZH1 and EZH2, and GSK343, which inhibits specifically EZH2 HMT activity). No effect on pAKT levels was seen in HG3 cells with either drug treatment compared to controls, while, as expected, idelalisib treatment (used as positive control) showed a reduction in pAKT levels compared to control sample ()).
Finally, using a more quantitative technique (Akt Kinase Activity Assay Kit), we analysed the levels of active AKT in EZH2 siRNA transfected cells and drug-treated cells along with control samples. There was a significant reduction in active AKT levels in EZH2 siRNA HG3 cells and idelalisib treated HG3 cells compared to control, but no effect was observed upon HMT inhibitor treatment (,i)), supporting the above results obtained from Western blotting.
EZH2 directly controls IGF1R expression to activate the PI3K pathway in CLL
Published evidence suggests that IGF1R expression correlates with poor survival in CLL and is involved in the activation of the PI3K pathway in CLL primary cells [Citation17]. According to our ChIP-seq data, IGF1R demonstrated significant enrichment of EZH2 binding on the promoter region in U-CLL samples compared to M-CLL samples; however, the difference between H3K27me3 enrichment was not significant between M-CLL and U-CLL (,)). This data was further corroborated by EZH2 and H3K27me3 ChIP assays using another 16 CLL samples ()). We also analysed expression levels of EZH2 and IGF1R in an independent cohort of CLL cases (n = 96). Indeed, U-CLL samples exhibited higher occupancy of EZH2 along with higher expression levels of EZH2 and IGF1R mRNA (,)), indicating a non-canonical function of EZH2 in upregulating IGF1R. Moreover, both EZH2 and IGF1R expression showed a positive correlation in all CLL samples (r = 0.58; p < 0.0001) and in U-CLL samples only (r = 0.64; p < 0.0001) (Supplemental Figure 2D).
Figure 4. EZH2 regulates the PI3K pathway through IGF1R in the HG3 CLL cell line. (a) Snap shot of 100 kb region showing peak enrichment for EZH2 and HK27me3 on the EZH2 binding region on the IGF1R gene for M-CLL and U-CLL samples. (b) Box plots for EZH2 and H3K27me3 enrichment over the IGF1R gene between M-CLL and U-CLL samples based on ChIP-seq data. (c) ChIP assay data showing fold enrichment of EZH2 (right side) and H3K27me3 (left side) over IgG Ab on IGF1R promoter using 16 independent CLL samples. (d and e) Box plot showing expression levels of EZH2 and IGF1R between M-CLL and U-CLL samples. (f and g) ChIP assay data showing fold enrichment of EZH2 and different histone modifications over IGF1R gene promoter in EZH2 downregulated HG3 cells. (h) Fold change expression levels of EZH2 and IGF1R expression levels in EZH2 siRNA downregulated HG3 cells.
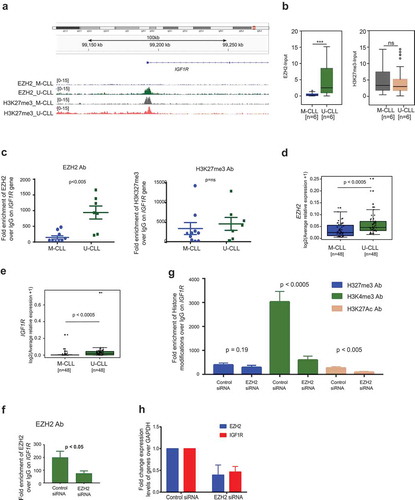
Next, to investigate the non-canonical function of EZH2 in IGF1R upregulation, we performed ChIP assay on the IGF1R gene promoter in both EZH2 siRNA and control siRNA transfected HG3 CLL cells. As shown in ,), we observed a loss of EZH2 binding on the IGF1R promoter upon siRNA downregulation of EZH2. While no change in H3K27me3 levels was observed, a significant decrease of two activation marks, H3K4me3 and H3K27Ac, on the IGF1R promoter was seen in EZH2 siRNA-treated cells vs control cells, indicating histone methyltransferase activity-independent upregulation of IGF1R by EZH2. In addition, and supporting this data, we observed decreased IGF1R expression in EZH2 siRNA-treated HG3 cells compared to control cells ()). Similar to the HG3 cell line, we also observed a reduction of IGF1R expression in the EZH2 siRNA downregulated mantle cell lymphoma (MCL) cell lines Mino and Jeko (Supplementary Figure 3A).
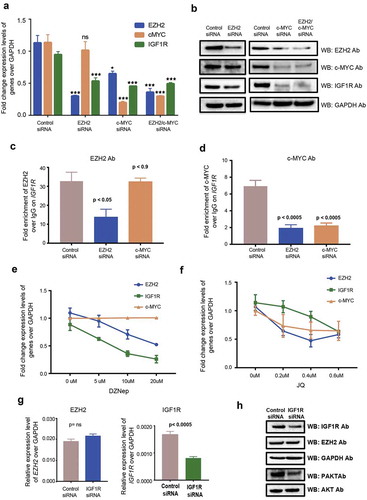
EZH2 recruits MYC to the IGF1R promoter
When we searched for transcription factor occupancy at the IGF1R promoter in the UCSC genome browser in different cell lines from the ENCODE/Broad institute datasets, we found a broad overlap of MYC transcription factor and EZH2 binding sites (Supplemental Figure 3B). To investigate the role of MYC occupancy on the IGF1R promoter, we performed siRNA-mediated transfections by downregulating EZH2 and/or MYC in the HG3 cell line. As expected, both mRNA and protein expression levels of IGF1R showed a significant reduction in EZH2, c-MYC and double-transfected samples compared to control siRNA (,)). Interestingly, ChIP assays performed on the IGF1R promoter using EZH2 and MYC antibodies showed a reduction in MYC occupancy for both EZH2 siRNA and MYC siRNA samples. However, binding of EZH2 was only reduced in EZH2 siRNA HG3 cells but not in MYC siRNA HG3 cells (,)). These results indicate that MYC is recruited through EZH2 to the IGF1R promoter and is important for regulation of IGF1R expression, as loss of EZH2 results in loss of MYC binding, whereas loss of MYC does not affect EZH2 binding. Along with siRNA-mediated downregulation, we also treated HG3 cells with the EZH2 inhibitor (DZNep) and MYC inhibitor (JQ-1) with increasing concentrations. As expected, we found a gradual decrease in IGF1R levels with increasing concentrations of the drugs supporting the transfection assays (,)). Interestingly, treatment of HG3 cells with JQ-1 also showed a reduction in global levels of EZH2 along with MYC levels ()). This could be due to the indirect effect of MYC reduction, which increases the levels of negative regulators of EZH2 such as miR26A1 [Citation24,Citation25].
Figure 5. EZH2 and c-MYC mediated IGF1R regulation. (a) Fold change of mRNA expression levels regarding EZH2, c-MYC and IGF1R in EZH2, c-MYC and double-transfected siRNA downregulated HG3 cells. (b) Western blot analysis showing protein levels for different antibodies in EZH2, c-MYC and double-transfected siRNA downregulated HG3 cells. (c and d) ChIP assay data showing fold enrichment of EZH2 and c-MYC antibody over IgG Ab on IGF1R promoter in EZH2 and c-MYC siRNA downregulated HG3 cells. (e and f) Fold change expression of EZH2, c-MYC and IGF1R in DZNep and JQ-1 treated HG3 cells. (g) Expression levels of EZH2 and IGF1R for IGF1R transfected HG3 samples. (h) Western blot analysis showing protein levels for different antibodies in IGF1R siRNA downregulated HG3 cells.
Finally, since IGF1R is upstream to the PI3K pathway, we investigated the role of IGF1R in upregulating the PI3K pathway in HG3 cells. Similar to EZH2, siRNA-mediated down-regulation of IGF1R also resulted in decreased levels of pAKT with an effect on the total AKT levels (,h)), indicating that IGF1R is involved in direct upregulation of the PI3K pathway in HG3 cells. Down-regulation of IGF1R resulted in a decrease of both mRNA and protein expression levels of IGF1R, but not EZH2 levels, indicating that EZH2 acts upstream to IGF1R (,h)).
Discussion
EZH2 is frequently overexpressed in different cancer types and was recently reported to be associated with a particularly aggressive clinical course in CLL [Citation12,Citation14]. Here, using ChIP-sequencing, we investigated for the first time downstream targets and pathways potentially mediating EZH2-driven effects in CLL. Overall, we observed that EZH2 predominantly targets protein-coding genes on promoter regions, supporting a prominent role of EZH2 in regulating gene expression and modulating cellular pathways implicated in CLL progression, including the PI3K, Wnt, Notch and Hedgehog anti-apoptotic signalling pathways [Citation20].
The well-studied mechanism by which EZH2 exerts its oncogenic function is to promote gene repression through its histone methyltransferase activity [Citation26]. Accordingly, a number of tumour suppressor genes such as INK4A/ARF [Citation27], E-cadherin [Citation28] and p57Kip2 [Citation29] are directly targeted by EZH2 and suppressed in a PRC2-dependent way. On the other hand, EZH2 may also function as an oncogenic factor acting in a non-canonical or PRC2-independent manner. For instance, EZH2 has been reported to directly interact and activate the androgen receptor in prostate cancer [Citation11], and modulate the NF-κB pathway by forming a complex with RELA and RELB in breast cancer [Citation30]. EZH2 has also been shown to directly interact with the estrogen receptor and β-catenin, inducing gene transactivation of estrogen and the Wnt signalling pathway [Citation31]. Prompted by our finding of increased EZH2 occupancy in PI3K pathway genes in U-CLL, we decided to explore the potential functional role of EZH2 in PI3K/AKT activation. First, to validate our ChIP-seq data, we confirmed EZH2 occupancy for selected PI3K pathway genes in an independent CLL patient material. Next, using siRNA-mediated EZH2 downregulation in the HG3 cell line, we observed reduced EZH2 binding and confirmed specificity for these genes. Notably, IGF1R, previously reported to be overexpressed in U-CLL versus M-CLL [Citation32], was one of the genes that displayed significant downregulation of gene expression upon EZH2 silencing. Hence, we further investigated the IGF1R gene, which was highly enriched with EZH2 at the promoter region in U-CLL. IGF1R also showed higher expression in U-CLL compared to M-CLL and a significant, positive correlation with EZH2 expression, implying a non-canonical activation by EZH2 with resultant activation of the PI3K/AKT pathway, in keeping with the literature [Citation17]. Moreover, EZH2 inhibitor treatment of HG3 cells resulted in reduced pAKT levels (where the global EZH2 levels decreased along with H3K27me3), while remaining unaffected by EZH2 HMT inhibitor treatment (where H3K27me3 levels were lowered but not EZH2 levels), further supporting a non-canonical function of EZH2.
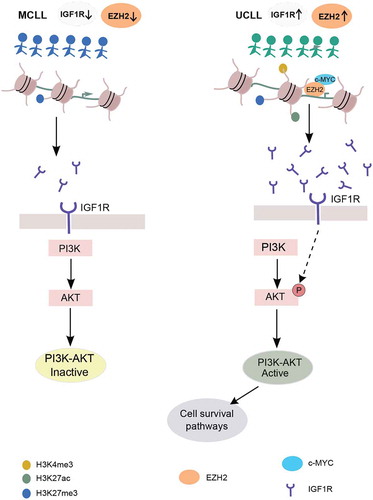
The MYC transcription factor is overexpressed in many cancer types and promotes oncogenesis by targeting genes involved in cell proliferation and apoptosis [Citation33–Citation35]. MYC is also known to cause overexpression of EZH2 in several solid tumours [Citation36,Citation37]. Both EZH2 and MYC have been shown to down-regulate the expression of tumour suppressor genes by directly binding onto the promoter and mediating H3K27me3 silencing [Citation38]. Interestingly, we found overlapping EZH2 and MYC binding sites on the IGF1R promoter, indicating that MYC also binds and regulates IGF1R along with EZH2. siRNA transfections and drug treatment assays of EZH2 and MYC confirmed the importance of both EZH2 and MYC binding for upregulating IGF1R expression in HG3 cells. Reduction of IGF1R expression has been shown to reduce pAKT without affecting the total AKT levels in MCL cell lines [Citation39]. Consistent with the HG3 cell line, both the Mino and Jeko MCL cell lines showed reduced IGF1R expression in EZH2 siRNA down-regulation, indicating that this effect is not specific for the HG3 cell line. Additionally, using ChIP assays with EZH2 and MYC antibodies we could show that EZH2 recruits MYC onto the IGF1R promoter. The IGF1R gene promoter was highly enriched with H3K27me3 marks in M-CLL, resulting in low expression levels and limited activation of the PI3K/AKT pathway. In contrast, in U-CLL, EZH2 directly binds and recruits MYC on the IGF1R promoter and upregulates its expression, resulting in downstream activation of the PI3K/AKT pathway (). This is particularly relevant considering the clinical efficacy of the PI3K inhibitors in high-risk CLL [Citation40]. Pharmacological inhibition of EZH2 using DZNep decreased the expression levels of EZH2, along with concomitant loss of H3K27 trimethylation, as shown here and by others, resulting in re-expression of epigenetically silenced targets associated with, e.g., apoptosis of cancer cells [Citation41,Citation42]. Hence, the combination of a drug targeting specifically PI3Kδ such as idelalisb, with an EZH2 inhibitor, could be an attractive future approach that would inhibit both HMT-dependent canonical and non-canonical functions.
Figure 6. Model proposing EZH2-mediated regulation of the PI3K pathway through IGFR1 in CLL. Left and right panels represent activation of PI3K pathway in M-CLL (indicated by blue colour) and U-CLL (indicated by green colour). Below is the IGF1R promoter region (brown-coloured circles indicate histones and black colour line indicates DNA wrapped around histones) histone tail modifications in different colours. IGF1R, IGF1R receptor, EZH2 and c-MYC proteins are indicated with different colours below the figure.
In conclusion, we fine-mapped the global target genes of EZH2 in CLL and highlighted its implication in the transcriptional regulation of oncogenic pathways crucial for CLL pathogenesis. More importantly, we revealed a novel mechanism through which EZH2 upregulates IGF1R by recruiting MYC in a non-canonical manner, resulting in downstream activation of the PI3K/AKT prosurvival pathway in clinically aggressive cases, with implications for mechanism and pathway-driven management of CLL.
Materials and methods
CLL patient samples
Peripheral blood samples of a total of 113 CLL patients were evaluated. Of these, 12 cases (six U-CLL and six M-CLL) were subjected to ChIP-seq analysis and the remaining samples were included in experiments performed for validating the ChIP-sequencing data (16 cases) and expression levels using real-time PCR analysis (82 cases). Molecular and clinical data for these patients are listed in Supplemental Table 1. CLL patients were diagnosed according to the iwCLL criteria [Citation43] and all patients were either untreated or off-therapy for at least 6 months prior to sampling. All patients provided informed consent in accordance with the Helsinki Declaration and the study was approved by the local ethics review boards.
Cell lines and cell culturing
CLL cell lines (HG3 [Citation22] and MEC1 [Citation23]) and MCL cell lines (Jeko and Mino) were cultured using RPMI 1640 with glutamine supplemented with 10% fetal bovine serum and 1X penicillin/streptomycin (FBS; Invitrogen, Carlsbad, USA) as described earlier [Citation44].
DNA and RNA extraction, real-time PCR analysis
DNA and RNA were extracted from CLL PBMC samples using a standard kit according to the manufacturer’s protocol (Qiagen, Hilden, Germany). cDNA synthesis was performed using the Superscript III FS synthesis supermix kit (Life technologies, Carlsbad, USA) according to the manufacturer’s protocol. Real-time PCR was performed using the Power SYBR Green PCR master mix and the 7900HT fast real-time PCR instrument (Applied Biosystems, Warrington, UK). qRT-PCR primers were designed with PRIMER3 (Broad Institute). The GAPDH gene was used as an internal loading control gene. The relative expression levels were calculated using the ΔΔCt method. All primers sequences are listed in Supplemental Table 2.
Chip-sequencing
ChIP was performed with the Ideal ChIP seq kit (Diagenode, C01010051) according to the manufacturer’s protocol using an EZH2 polyclonal antibody (Diagenode, C15410039) and an H3K27me3 polyclonal antibody (Diagenode, C15410069). ChIP DNA was quantified using Qubit 2 Fluorometer (ThermoFischer Scientific, Q32866) and around 10 ng of ChIP DNA was used to prepare sequencing libraries using the ThruPLEX-FD Prep Kit (Rubicon Genomics, Ann Arbor, USA) according to the manufacturer’s specifications. The final DNA libraries were sequenced (PE50) using an Illumina HiSeq 2500 instrument with approximately 40 to 50 million reads per sample.
Reads were filtered based on quality with TrimGalore (0.4.0) (https://github.com/FelixKrueger/TrimGalore). Alignment to hg19 was performed with Bowtie2 (2.2.6) [Citation45] with default parameters. Quality measures such as cross-correlation, cumulative enrichment and clustering were performed using phantompeakqualtools (1.1) (http://code.google.com/p/phantompeakqual-tools/) and deepTools (2.0.1) [Citation46]. Removal of duplicates and reads mapping to blacklisted regions were undertaken using Picard (2.2.4) (http://broadinstitute.github.io/picard/) and NGSUtils (0.5.9-b4caac3) [Citation47]. Peak calling was carried out with MACS2 (2.1.0.20140616) (https://pypi.python.org/pypi/MACS2) with a minimum FDR (q-value) cut-off for peak detection of 0.05. Peaks were normalized with their corresponding input using deepTools2. The weighted score (W-score) was calculated by dividing the average peak score (AveS) by range of the peak (R) for gene G and multiplying by the number of peaks associated with the gene G (N); (AveS/R*N)*100. EZH2 and H3K27me3 peaks were annotated in different genomic regions using W-score with cutoff 0.1 and 0.01. BedTools [Citation48] intersect command was applied to define the overlapping peaks between EZH2 and H3K27me3 (EZH2+ H3K27me3) with peak region of minimum one basepair overlap. BedTools subtract was used to find the unique peak regions of EZH2 and H3K27me3. The average bigWig file from input normalized bigWig for each CLL subgroups was generated using merge_bigWig script (http://wresch.github.io/2014/01/31/merge-bigwig-files.html). The average profile and density heatmaps obtained for window sizes ± 5KB of transcriptional start sites (TSS) in M-CLL and U-CLL were plotted using deepTools2. The pathways enriched in EZH2 and H3K27me3 overlapping regions of each CLL subgroups were identified using ChIP-Enrich [Citation49]. All the raw data has been deposited in GEO, with the accession number GSE115772, and will be available to download after release to the public. The raw data from published RNA-sequencing CLL samples [Citation19] was obtained and analysed as described earlier [Citation50]. Wilcoxon rank sum test in R-package was conducted to determine the differential expression of selected genes between M-CLL and U-CLL samples and also to determine the median enrichment difference between M-CLL and U-CLL samples. Pearson correlation method was used to determine the correlation between EZH2 and IGF1R mRNA expression in U-CLL and all CLL samples.
Nucleofection, chip assays and western blot analysis
Transient transfection was carried out on an Amaxa 4D-Nucleofector™ System (Lonza group AG, Basel, Switzerland) using the SF cell line Amaxa kit (V4XC-2032) according to the manufacturer’s instruction. 50 nM of Predesigned Stealth RNAi siRNAs (three each) were utilized against EZH2, MYC and IGF1R (HSS103462; HSS176652, and HSS176653 for EZH2; HSS105253, HSS105254 and HSS179797 for IGF1R and HSS106838, HSS106839 and HSS181389 for MYC; ThermoFischer Scientific, Waltham, USA) in equal concentrations. The silencer negative control siRNA (ThermoFischer Scientific, Waltham, USA) was used as control siRNA.
ChIP assays were performed using the iDeal ChIP-seq kit for Transcripton Factors (Diagenode, Liege, Belgium), according to the manufacturer’s instructions and Western blot analysis was performed as described earlier [Citation44]. Antibodies used for ChIP assays and Western blotting were EZH2 polyclonal antibody (Diagenode, C15410039), EZH2 (3147, Cell Signaling Technology, Danvers, USA), MYC (ab17355, Abcam), H3K27me3 (C15410069), H3K4me3 (C15410003), H3K27Ac (C15410174) polyclonal antibodies (Diagenode, Liege, Belgium), H3 (ab1791, Abcam), IGF1R (ab39675, Abcam), GAPDH (SC-25778; Santa Cruz Biotechnology, Dallas, USA), Phospho-Akt (Ser473; 9271) and AKT (9272) antibodies (Cell signaling technology, Netherlands).
Drug treatments and kinase activity assay
CLL cell lines were treated with UNC1999 (S7164; Selleckchem), GSK343 (S7165; Selleckchem), and the PI3Kδ inhibitor idelalisib (GS-1101; Selleckchem). DZNep (120964–45-6) and JQ-(1268524–70-4) (Sigma Aldrich) treatments were incubated for 3 days using a different range of concentrations as mentioned in the figures. The levels of active AKT was analysed using the Akt Kinase Activity Assay Kit (ab139436; Abcam) according to the manufacturer’s instructions.
Authorship contributions
MK, SK and MH performed research, analyzed the data and wrote the paper. SK did all the bioinformatics analysis in this study. NS and LM provided clinical samples and associated data. NP and CK analyzed data and wrote the paper. KS, RR and MK contributed to the design and analysis of the study and wrote the paper.
Supplemental Material
Download Zip (10.4 MB)Acknowledgments
The sequencing was performed by the SNP&SEQ Technology Platform in Uppsala. The facility is part of the National Genomics Infrastructure (NGI) Sweden and Science for Life Laboratory. This work is supported by grants from LUA/ALF (FoU Västra Götalandsregionen) and Swedish Cancer Society (CAN 2016/424 to M.K and CAN 2016/414 to R.R.). This work was also supported in part by the grants from the Knut and Alice Wallenberg Foundation (KAW 2014.0057 and KAW 2016.0373) and Swedish Research Council (Dnr 2017-02834 to C.K and Dnr 2016-02064 to R.R.); “ Co-financed by Greece and the European Union (European Social Fund- ESF) through the Operational Programme «Human Resources Development, Education and Lifelong Learning» in the context of the project “Reinforcement of Postdoctoral Researchers” (MIS-5001552), implemented by the State Scholarships Foundation (ΙΚΥ); TRANSCAN CGH-CLL; and a research grant from Gilead Sciences Hellas (Asklepios award) to N.P.
Disclosure statement
KS received research support from Jannsen Pharmaceutica. Remaining authors have no conflicts of interests or disclosures.
Supplementary material
Supplemental data for this article can be accessed here.
Additional information
Funding
Related Research Data
References
- Rada-Iglesias A, Bajpai R, Swigut T, et al. A unique chromatin signature uncovers early developmental enhancers in humans. Nature. 2011;470:279–283.
- Yamaguchi H, Hung MC. Regulation and role of EZH2 in cancer. Cancer Res Treat. 2014;46:209–222.
- Kim KH, Roberts CW. Targeting EZH2 in cancer. Nat Med. 2016;22:128–134.
- Varambally S, Dhanasekaran SM, Zhou M, et al. The polycomb group protein EZH2 is involved in progression of prostate cancer. Nature. 2002;419:624–629.
- Kleer CG, Cao Q, Varambally S, et al. EZH2 is a marker of aggressive breast cancer and promotes neoplastic transformation of breast epithelial cells. Proc Natl Acad Sci U S A. 2003;100:11606–11611.
- Vo BT, Li C, Morgan MA, et al. Inactivation of Ezh2 upregulates Gfi1 and drives aggressive Myc-driven group 3 medulloblastoma. Cell Rep. 2017;18:2907–2917.
- Papakonstantinou N, Ntoufa S, Chartomatsidou E, et al. Differential microRNA profiles and their functional implications in different immunogenetic subsets of chronic lymphocytic leukemia. Mol Med. 2013;19:115–123.
- Kopparapu PK, Bhoi S, Mansouri L, et al. Epigenetic silencing of miR-26A1 in chronic lymphocytic leukemia and mantle cell lymphoma: impact on EZH2 expression. Epigenetics. 2016;11:335–343.
- Chen QN, Chen X, Chen ZY, et al. Long intergenic non-coding RNA 00152 promotes lung adenocarcinoma proliferation via interacting with EZH2 and repressing IL24 expression. Mol Cancer. 2017;16:17.
- Cha TL, Zhou BP, Xia W, et al. Akt-mediated phosphorylation of EZH2 suppresses methylation of lysine 27 in histone H3. Science. 2005;310:306–310.
- Xu K, Wu ZJ, Groner AC, et al. EZH2 oncogenic activity in castration-resistant prostate cancer cells is Polycomb-independent. Science. 2012;338:1465–1469.
- Rabello Ddo A, Lucena-Araujo AR, Alves-Silva JC, et al. Overexpression of EZH2 associates with a poor prognosis in chronic lymphocytic leukemia. Blood Cells Mol Dis. 2015;54:97–102.
- Kanduri M, Sander B, Ntoufa S, et al. A key role for EZH2 in epigenetic silencing of HOX genes in mantle cell lymphoma. Epigenetics. 2013;8:1280–1288.
- Papakonstantinou N, Ntoufa S, Chartomatsidou E, et al. The histone methyltransferase EZH2 as a novel prosurvival factor in clinically aggressive chronic lymphocytic leukemia. Oncotarget. 2016;7:35946–35959.
- McCabe MT, Ott HM, Ganji G, et al. EZH2 inhibition as a therapeutic strategy for lymphoma with EZH2-activating mutations. Nature. 2012;492:108–112.
- Donahue AC, Fruman DA. Proliferation and survival of activated B cells requires sustained antigen receptor engagement and phosphoinositide 3-kinase activation. J Immunol. 2003;170:5851–5860.
- Yaktapour N, Ubelhart R, Schuler J, et al. Insulin-like growth factor-1 receptor (IGF1R) as a novel target in chronic lymphocytic leukemia. Blood. 2013;122:1621–1633.
- Brown JR, Byrd JC, Coutre SE, et al. Idelalisib, an inhibitor of phosphatidylinositol 3-kinase p110delta, for relapsed/refractory chronic lymphocytic leukemia. Blood. 2014;123:3390–3397.
- Ferreira PG, Jares P, Rico D, et al. Transcriptome characterization by RNA sequencing identifies a major molecular and clinical subdivision in chronic lymphocytic leukemia. Genome Res. 2014;24:212–226.
- Seke Etet PF, Vecchio L, Nwabo Kamdje AH. Interactions between bone marrow stromal microenvironment and B-chronic lymphocytic leukemia cells: any role for Notch, Wnt and Hh signaling pathways? Cell Signal. 2012;24:1433–1443.
- Romano S, Mallardo M, Chiurazzi F, et al. The effect of FK506 on transforming growth factor beta signaling and apoptosis in chronic lymphocytic leukemia B cells. Haematologica. 2008;93:1039–1048.
- Rosen A, Bergh AC, Gogok P, et al. Lymphoblastoid cell line with B1 cell characteristics established from a chronic lymphocytic leukemia clone by in vitro EBV infection. Oncoimmunology. 2012;1:18–27.
- Stacchini A, Aragno M, Vallario A, et al. MEC1 and MEC2: two new cell lines derived from B-chronic lymphocytic leukaemia in prolymphocytoid transformation. Leuk Res. 1999;23:127–136.
- Kuser-Abali G, Alptekin A, Cinar B. Overexpression of MYC and EZH2 cooperates to epigenetically silence MST1 expression. Epigenetics. 2014;9:634–643.
- Zhao X, Lwin T, Zhang X, et al. Disruption of the MYC-miRNA-EZH2 loop to suppress aggressive B-cell lymphoma survival and clonogenicity. Leukemia. 2013;27:2341–2350.
- Comet I, Riising EM, Leblanc B, et al. Maintaining cell identity: PRC2-mediated regulation of transcription and cancer. Nat Rev Cancer. 2016;16:803–810.
- Bracken AP, Kleine-Kohlbrecher D, Dietrich N, et al. The Polycomb group proteins bind throughout the INK4A-ARF locus and are disassociated in senescent cells. Genes Dev. 2007;21:525–530.
- Chang CJ, Yang JY, Xia W, et al. EZH2 promotes expansion of breast tumor initiating cells through activation of RAF1-beta-catenin signaling. Cancer Cell. 2011;19:86–100.
- Yang X, Karuturi RK, Sun F, et al. CDKN1C (p57) is a direct target of EZH2 and suppressed by multiple epigenetic mechanisms in breast cancer cells. PloS One. 2009;4:e5011.
- Lee ST, Li Z, Wu Z, et al. Context-specific regulation of NF-kappaB target gene expression by EZH2 in breast cancers. Mol Cell. 2011;43:798–810.
- Shi B, Liang J, Yang X, et al. Integration of estrogen and Wnt signaling circuits by the polycomb group protein EZH2 in breast cancer cells. Mol Cell Biol. 2007;27:5105–5119.
- Maura F, Mosca L, Fabris S, et al. Insulin growth factor 1 receptor expression is associated with NOTCH1 mutation, trisomy 12 and aggressive clinical course in chronic lymphocytic leukaemia. PloS One. 2015;10:e0118801.
- Dang CV, O’Donnell KA, Zeller KI, et al. The c-Myc target gene network. Semin Cancer Biol. 2006;16:253–264.
- Gurel B, Iwata T, Koh CM, et al. Nuclear MYC protein overexpression is an early alteration in human prostate carcinogenesis. Mod Pathol. 2008;21:1156–1167.
- Nilsson JA, Cleveland JL. Myc pathways provoking cell suicide and cancer. Oncogene. 2003;22:9007–9021.
- Koh CM, Iwata T, Zheng Q, et al. Myc enforces overexpression of EZH2 in early prostatic neoplasia via transcriptional and post-transcriptional mechanisms. Oncotarget. 2011;2:669–683.
- Sander S, Bullinger L, Klapproth K, et al. MYC stimulates EZH2 expression by repression of its negative regulator miR-26a. Blood. 2008;112:4202–4212.
- Zhang X, Zhao X, Fiskus W, et al. Coordinated silencing of MYC-mediated miR-29 by HDAC3 and EZH2 as a therapeutic target of histone modification in aggressive B-Cell lymphomas. Cancer Cell. 2012;22:506–523.
- Vishwamitra D, Shi P, Wilson D, et al. Expression and effects of inhibition of type I insulin-like growth factor receptor tyrosine kinase in mantle cell lymphoma. Haematologica. 2011;96:871–880.
- Furman RR, Sharman JP, Coutre SE, et al. Idelalisib and rituximab in relapsed chronic lymphocytic leukemia. N Engl J Med. 2014;370:997–1007.
- Fiskus W, Rao R, Balusu R, et al. Superior efficacy of a combined epigenetic therapy against human mantle cell lymphoma cells. Clin Cancer Res off J Am Assoc Cancer Res. 2012;18:6227–6238.
- Miranda TB, Cortez CC, Yoo CB, et al. DZNep is a global histone methylation inhibitor that reactivates developmental genes not silenced by DNA methylation. Mol Cancer Ther. 2009;8:1579–1588.
- Hallek M, Cheson BD, Catovsky D, et al. iwCLL guidelines for diagnosis, indications for treatment, response assessment, and supportive management of CLL. Blood. 2018;131:2745–2760.
- Kopparapu PK, Miranda C, Fogelstrand L, et al. MCPH1 maintains long-term epigenetic silencing of ANGPT2 in chronic lymphocytic leukemia. Febs J. 2015;282:1939–1952.
- Langmead B, Salzberg SL. Fast gapped-read alignment with Bowtie 2. Nat Methods. 2012;9:357–359.
- Ramirez F, Ryan DP, Gruning B, et al. deepTools2: a next generation web server for deep-sequencing data analysis. Nucleic Acids Res. 2016;44:W160–5.
- Breese MR, Liu Y. NGSUtils: a software suite for analyzing and manipulating next-generation sequencing datasets. Bioinformatics. 2013;29:494–496.
- Quinlan AR. BEDTools: the Swiss-army tool for genome feature analysis. Curr Protoc Bioinformatics. 2014;47(11 2):1–34.
- Welch RP, Lee C, Imbriano PM, et al. ChIP-Enrich: gene set enrichment testing for ChIP-seq data. Nucleic Acids Res. 2014;42:e105.
- Subhash S, Andersson PO, Kosalai ST, et al. Global DNA methylation profiling reveals new insights into epigenetically deregulated protein coding and long noncoding RNAs in CLL. Clin Epigenetics. 2016;8:106.