
ABSTRACT
Illumina HumanMethylation450 BeadChip (450K) has been commonly used to investigate DNA methylation in human tissues. Recently, it has been replaced by Illumina HumanMethylationEPIC BeadChip (EPIC) covering over 850,000 CpGs distributed genome-wide. Many consortia have now datasets coming from both arrays and aspire to analyze the two together. The placenta shows a high number of intermediate methylation levels and is often investigated for obstetric/birth outcomes, and potentially for long-term programming in offspring. We performed a systematic comparison between the two arrays using 108 duplicate placental samples from Gen3G birth cohort. We find that placenta shows a high per-sample correlation between the arrays, and higher median correlations at individual CpGs than those reported for blood. We identify 26,340 probes with absolute difference in per cent methylation >10%. We conclude that EPIC and 450K placental data can be combined, and we provide two lists of CpGs that should be excluded to avoid misleading results.
KEYWORDS:
Introduction
DNA methylation is the most frequently studied epigenetic mark and it has been thoroughly characterized in health and in disease [Citation1]. Until 2016, the most widely used array for genome-wide DNA methylation studies in humans was the Illumina HumanMethylation450 BeadChip (450K), but the company has replaced this array with the Illumina HumanMethylationEPIC BeadChip (EPIC), which uses the same technology to measure DNA methylation at nearly double the number of CpG sites covered by the previous platform [Citation2].
In an interesting study recently published by Solomon et al., the reproducibility of common probes between EPIC and 450K arrays was systematically assessed in umbilical cord blood as well as in whole blood from children at age 14 [Citation3]. Briefly, the authors found high per-sample correlation between the two arrays, but the correlation between the individual CpG sites interrogated by the two arrays was not consistently as high as expected, especially in the case of those sites with low variance across the sample set. They concluded that data from EPIC and 450K arrays could be combined if individual results are taken with caution, and they provided a list of probes showing extreme absolute methylation differences between the two platforms that should be excluded to avoid misleading results.
DNA methylation is tissue specific. Among the different tissues in which DNA methylation has been studied, it is known that placenta frequently presents partially methylated domains (PMDs) and intermediate methylation levels, and therefore shows a trimodal distribution of methylation percentages (or β values, ranging between 0 and 1, β = 0 being fully unmethylated and β = 1 being 100% methylated) [Citation4]. In the last years, the interest on placental epigenetic profiling has increased notably [Citation4,Citation5] and there is a considerable number of ongoing epigenome-wide association studies (EWAS) targeting this tissue in large consortia like the Pregnancy and Childhood Epigenetics (PACE) consortium, where data from both arrays are available. In this context, it is of utmost importance to know to what extent DNA methylation results obtained from placental DNA in EPIC and 450K arrays can be analyzed together.
We present a systematic evaluation of the reproducibility of methylation results between the 450K and the EPIC arrays in 108 placentas collected in the Gen3G cohort, exploring per-sample correlations as well as correlations at specific CpG sites that are common to both arrays. Finally, we propose a list of probes showing low correlation between arrays and high variance, and another list containing CpG positions with extreme absolute differences in methylation levels when the two different platforms are compared. We conclude that researchers should consider excluding these probe sets when carrying out joint placental methylation metanalyses.
Methods
Study participants and samples
Subjects were participants in the Gen3G prospective observational cohort study [Citation6]. Pregnant women were recruited representing the general population of women in reproductive age from the Eastern Townships region, in Québec, Canada. Every participant gave written informed consent before enrolment in the study, in accordance with the Declaration of Helsinki. Placental biopsy was performed from the fetal side and DNA was extracted using standard procedures. For these epigenetic analyses, we excluded samples from women with conditions potentially related to placenta (pre-eclampsia, chorioamnionitis, gestational diabetes).
EPIC and 450K Beadchip methylation analysis
Samples run in the 450K and EPIC arrays were processed independently and in different dates, including bisulfite conversion. In summary, 188 and 470 placental DNA aliquots of 1 μg were bisulfite converted using Zymo Bisulfite Conversion Kits (Zymo Research, Orange, CA) to be run in 450K and EPIC arrays, respectively. Subsequently, each DNA aliquot was whole-genome amplified, enzymatically fragmented, purified and applied to the corresponding Illumina array (Illumina, San Diego, CA) according to the Illumina methylation protocols [Citation7,Citation8]. Both 450K and EPIC chips were analyzed using the Illumina Hi-Scan system in the same laboratory but at different times. In consequence, DNA methylation was measured at 485,512 and at 866,836 CpG sites on the 450K and the EPIC arrays, respectively. The quality control (QC) measures for 450K were previously described [Citation9] and included use of repeats and duplicates and randomization of samples across chips and plates. The same QC and randomization was applied for EPIC array analyses [Citation10].
DNA methylation data processing
DNA methylation data were processed using the R package minfi [Citation11]. Raw intensity data (IDAT) files for both 450K and EPIC arrays were loaded and we removed samples bearing more than 1% probes with a detection p-value>0.01 (58 and 2, for 450K and EPIC, respectively), as well as samples that had a sex mismatch (2 from each array). We then removed those probes in which we had at least one sample with a detection p-value>0.01. This resulted in the exclusion of 16,898 and 26,160 probes in the 450K and EPIC arrays, respectively. We then subtracted background signal and corrected for differences between type I and type II probes using Beta-Mixture Quantile (BMIQ) Normalization [Citation12]. Afterwards, we used ComBat to remove batch effects derived from the use of different plates [Citation13]. Finally, we combined the array-specific results into a unique dataset, including only overlapping CpG sites and samples. Our combined dataset included 430,054 common CpG sites in 108 individual placentas of the Gen3G cohort with duplicate samples analyzed with both arrays.
Comparison of array data
In order to assess overall reproducibility between arrays, we calculated the Pearson correlation coefficient for each individual across all probes to obtain an overall per-subject correlation on both platforms. Due to the high correlation between any two methylation samples, we also calculated the mean-centred correlation that consists on subtracting the mean of each probe to the value of that probe in each sample, and then computing the correlation between the duplicates. In addition, we also looked at the Pearson correlation between arrays and at the variance (in the 450K, the primary array) of each of the overlapping probes across the whole sample set, to evaluate comparability of an individual methylation value. We assessed the correlation separately by probe type (I and II), after observing a significant difference between the type I per-probe Pearson correlation coefficients and the type II per-probe Pearson correlation coefficients between arrays, even after BMIQ normalization (t = −72.893, p-value <2.2e-16). In order to determine the average difference in β values produced by 450K and EPIC arrays, we subtracted the mean β across all subjects at each probe on EPIC from the mean β across all subjects at each probe on the 450K array. All analyses and plots were done in R version 3.5.1 [Citation14].
Results
We present in characteristics of Gen3G participants that contributed to the current study. Correlation values for the subjects analyzed in the two different arrays are shown in . In summary, we observed a high per-sample correlation with a median Pearson correlation coefficient of 0.985 (ranging between 0.936 and 0.993) that decreased when centred to the mean β value of each probe. Regarding the correlations for the individual CpG probes across the sample set, we obtained a median Pearson correlation coefficient of 0.505, with a higher median correlation for type II probes (0.559) compared to type I (0.317). In particular, we observed a bimodal distribution of the Pearson correlation density for both probe types (), with most of CpG sites showing correlation values between arrays close to 0 or to 0.9.
Table 1. Characteristics of Gen3G participants.
Table 2. Pearson correlation coefficients for the comparisons performed.
Figure 1. (a) Density plot of the Pearson correlation coefficients for individual CpG sites, separated by probe type. Type I probes are depicted in red while type II probes are represented by a discontinuous blue line. (b) Pearson correlation coefficients (y-axis) between 450K and EPIC arrays for individual CpG sites, relative to the variance of each probe (x-axis), and boxplot of the correlation coefficients by quartiles of the methylation variance in the 450K array (considered as the primary array). (c) Mean β values and frequencies of the probes in the lowest quartile of variance. (d) Mean β values and frequencies of the probes in the highest quartile of variance.
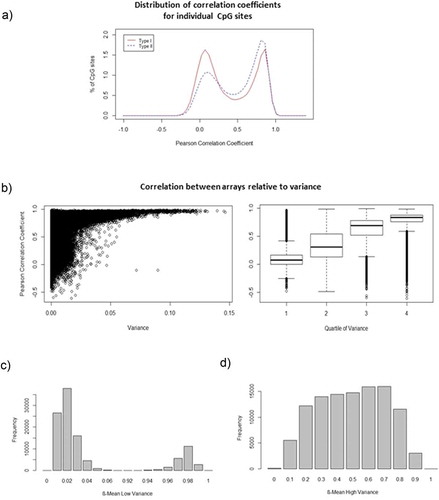
In general, correlations were stronger at CpG sites presenting a higher inter-sample variation in the 450K array when compared to those probes showing low variance across the sample set, as shown by the significant difference between Pearson correlation coefficients in the different variance quartiles (Kruskal–Wallis chi-squared = 263,350, df = 3, p-value <2.2e-16) ()). When we analyzed separately each inter-sample variance quartile, we observed that the lowest quartile (mean variance = 2e-05) contained extreme mean β values, mostly clustering around 0% methylation (), while the highest variance quartile (mean variance = 0.016) presented intermediate methylation values with a remarkable decrease of sites with 0 and 100% methylation values ().
It is important to note that most of the CpG probes showed a variance close to 0 across the sample set (75% of the probes presenting a variance <6.22e-03) (Supplementary Figure 1). Therefore, Pearson correlation is not a useful parameter to compute reproducibility at most sites, as has been shown by different correlation-based packages that recommend filtering out low variable observations before use [Citation15]. We decided to shortlist the CpG sites showing Pearson correlation coefficients between arrays below 0.2 in the fourth quartile of the β value-variance and found 2,668 probes with a poor correlation (median Pearson correlation coefficient = 0.137, ranging between −0.609 and 0.199) (Supplementary Table 1).
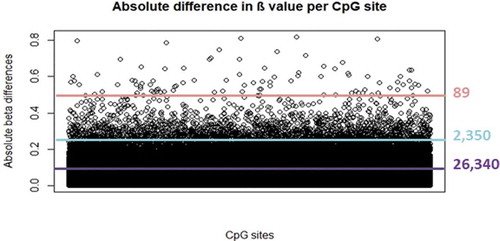
When we focused on the absolute β differences for each probe between the two arrays, we found 26,340 CpG sites with absolute differences above 0.1 (median β value difference = 0.141, ranging between 0.100 and 0.818) () (Supplementary Table 2). These sites showed a median inter-sample variance of 0.006 (ranging between 1.66e-06 and 0.146), and therefore were not all of them necessarily located in the lowest variance quartile. Among those probes, we found 2,350 and 89 that showed extreme β value differences above 0.25 and 0.5, respectively. In particular, the first group of probes (n = 2,350 with difference >0.25) showed a median β value difference of 0.292 (ranging between 0.250 and 0.818), while the second group (n = 89 probes with difference >0.5) presented a median of 0.567 (0.500–0.818).
Figure 2. Absolute β value differences between arrays at each CpG site. Purple, turquoise and pink lines represent thresholds at 0.10, 0.25 and 0.50 absolute β differences, respectively.
Discussion
Our comparison showed that overall methylation values are highly correlated when a given placenta sample analyzed with the 450K array is compared to the same individual with a duplicate placenta sample analyzed with EPIC array. We also calculated the centred correlation for each individual after centring each particular β value to the mean of each probe, prior to Pearson correlation calculation. We obtained a median-centered correlation = 0.823, which was much higher than the one observed in a previous study for duplicate infant whole-blood samples run using 450K arrays and processed in different laboratories (median-centered correlation = 0.420) [Citation16]. These results are encouraging for the combination of data obtained with the two arrays.
However, individual CpG probes showed a very wide range of correlation values, including negative ones. In general, we found a higher median correlation in placenta than what has been reported for cord or whole blood in children and adolescents [Citation3] (0.505 in placenta vs 0.235 in cord blood and 0.232 in childhood blood). In fact, the density plot of the Pearson correlation coefficients in placenta shows a bimodal distribution with a high proportion of CpGs clustering close to values as high as 0.9, while this is not the case in the study in blood. Additionally, the mean variance of the highest variance quartile in placenta is about 15 times higher than that reported in blood by Solomon et al. (0.016 vs 0.001).
Our results are in line with the observation that the higher the variability in methylation values, the higher the correlation between arrays for a specific CpG site. Moreover, it has been shown that intermediate methylation values are more variable across samples and are measured with more precision than extreme values [Citation17]. As previously stated, placenta presents fewer CpG sites that are fully methylated (β values close to 1, offering little or no variation) compared to mature fetal tissues (such as cord blood) and contains large PMDs and intermediate methylation regions [Citation4]. These observations could explain a higher inter-sample variation resulting in higher correlation coefficients. Given that Pearson correlation is useful only for those observations showing a considerable variation [Citation15], we propose to exclude from joint analyses those probes presenting low Pearson correlation coefficients between arrays (>0.2) in the fourth quartile of methylation variance.
Although our initial results seemed promising, we wanted to ascertain the presence of probes showing extreme absolute β differences between arrays. In fact, it has been shown in blood that they are neither the less variable nor the worst correlated sites, but could still lead to misleading results. We found out that we have a large number of such probes (89, 2,350 and 26,350 with absolute differences above 0.5, 0.25 and 0.1, respectively, compared to 62, 1,416 and 9,777 in blood [Citation3]). When we compared our probes above 0.5, 0.25 and 0.1 absolute differences to the 62-probe list provided by Solomon et al. (absolute β difference>0.5), we found a limited yet substantial overlap of 9, 17 and 46 CpG sites, respectively. Therefore, the vast majority of the probes identified in the present study are tissue-specific. In the present study, we wanted to provide a longer list of CpGs showing large absolute differences between arrays for consideration. In fact, we would suggest directly excluding those probes with differences above 0.5, as it has been previously done in the blood study, but at the same time, it would be advisable to carefully consider any CpGs with differences between 0.1 and 0.5.
Finally, we also compared the list of the probes presenting absolute β differences>0.1 between arrays to the list of CpG sites presenting a poor correlation between arrays (<0.2) in the highest variance quartile. We found out that 2,316 out of the 2,668 probes with low correlation and high variance were present in the list of CpGs with large absolute differences.
Overall, we conclude that the data from 450K and EPIC arrays for placental tissue can be combined although caution should be paid to individual probe results. We propose two CpG sets to take into consideration: 1) placenta-specific CpGs showing low correlation in the highest quartile of variance and, 2) CpGs presenting extreme β differences between arrays. Excluding the two full lists would result in a very stringent joint analysis, but as pointed out by Solomon et al. in their blood study, eliminating absolute methylation differences above 0.50 could also be a satisfactory approach.
Supplemental Material
Download Zip (894.6 KB)Disclosure statement
No potential conflict of interest was reported by the authors.
Supplemental material
Supplemental data for this article can be accessed here.
Additional information
Funding
Related Research Data
References
- Romanoski CE, Glass CK, Stunnenberg HG, et al. Epigenomics: roadmap for regulation. Nature. 2015;518:314–316.
- Pidsley R, Zotenko E, Peters TJ, et al. Critical evaluation of the illumina MethylationEPIC BeadChip microarray for whole-genome DNA methylation profiling. Genome Biol. 2016;17:208.
- Solomon O, MacIsaac J, Quach H, et al. Comparison of DNA methylation measured by Illumina 450K and EPIC BeadChips in blood of newborns and 14-year-old children. Epigenetics. 2018;13:655–664.
- Konwar C, Del Gobbo G, Yuan V, et al. Considerations when processing and interpreting genomics data of the placenta. Placenta. 2019;S0143–4004(18)31147–0.
- Morales E, Vilahur N, Salas LA, et al. Genome-wide DNA methylation study in human placenta identifies novel loci associated with maternal smoking during pregnancy. Int J Epidemiol. 2016;45:1644–1655.
- Guillemette L, Allard C, Lacroix M, et al. Genetics of glucose regulation in gestation and growth (Gen3G): a prospective prebirth cohort of mother–child pairs in Sherbrooke, Canada. BMJ Open. 2016;6:e010031.
- Bibikova M, Barnes B, Tsan C, et al. High density DNA methylation array with single CpG site resolution. Genomics. 2011;98:288–295.
- Sandoval J, Heyn H, Moran S, et al. Validation of a DNA methylation microarray for 450,000 CpG sites in the human genome. Epigenetics. 2011;6:692–702.
- Yousefi P, Huen K, Aguilar Schall R, et al. Considerations for normalization of DNA methylation data by illumina 450K BeadChip assay in population studies. Epigenetics. 2013;8:1141–1152.
- Cardenas A, Gagné-Ouellet V, Allard C, et al. Placental DNA methylation adaptation to maternal glycemic response in pregnancy. Diabetes. 2018;67:1673–1683.
- Aryee MJ, Jaffe AE, Corrada-Bravo H, et al. Minfi: a flexible and comprehensive bioconductor package for the analysis of infinium DNA methylation microarrays. Bioinformatics. 2014;30:1363–1369.
- Teschendorff AE, Marabita F, Lechner M, et al. A beta-mixture quantile normalisation method for correcting probe design bias in Illumina Infinium 450k DNA methylation data. Bioinformatics. 2013;29:189–196.
- Johnson WE, Rabinovic A, Li C. Adjusting batch effects in microarray expression data using Empirical Bayes methods. Biostatistics. 2007;8:118–127.
- Core Team R. R: A language and environment for statistical computing. R Foundation for statistical computing. Vienna, Austria; 2018. Available from: https://www.R-project.org/
- Yang J, Yu H, Liu BH, et al. DCGL v2.0: an R package for unveiling differential regulation from differential co-expression. PLoS One. 2013 Nov 20;8(11):e79729. . eCollection 2013.
- Xu Z, Niu L, Leping L, et al. ENmix: a novel background correction method for illumina humanmethylation450 beadChip. Nucleic Acids Res. 2016;44:e20.
- Bibikova M, Fan JB. GoldenGate® assay for DNA methylation profiling. In: Tost J, editor. DNA methylation. Methods in molecular biology. Vol. 507. New York, NY: Humana Press; 2009.