
ABSTRACT
DNA methylation (DNAm) and microRNAs (miRNAs) have been implicated in a wide-range of human diseases. While often studied in isolation, DNAm and miRNAs are not independent. We analyzed associations of expression of 283 miRNAs with DNAm at >400K CpG sites in whole blood obtained from 3565 individuals and identified 227 CpGs at which differential methylation was associated with the expression of 40 nearby miRNAs (cis-miR-eQTMs) at FDR<0.01, including 91 independent CpG sites at r2 < 0.2. cis-miR-eQTMs were enriched for CpGs in promoter and polycomb-repressed state regions, and 60% were inversely associated with miRNA expression. Bidirectional Mendelian randomization (MR) analysis further identified 58 cis-miR-eQTMCpG-miRNA pairs where DNAm changes appeared to drive miRNA expression changes and opposite directional effects were unlikely. Integration of genetic variants in joint analyses revealed an average partial between cis-miR-eQTM CpGs and miRNAs of 2% after conditioning on site-specific genetic variation, suggesting that DNAm is an important epigenetic regulator of miRNA expression. Finally, two-step MR analysis was performed to identify putatively causal CpGs driving miRNA expression in relation to human complex traits. We found that an imprinted region on 14q32 that was previously identified in relation to age at menarche is enriched with cis-miR-eQTMs. Nine CpGs and three miRNAs at this locus tested causal for age at menarche, reflecting novel epigenetic-driven molecular pathways underlying this complex trait. Our study sheds light on the joint genetic and epigenetic regulation of miRNA expression and provides insights into the relations of miRNAs to their targets and to complex phenotypes.
Introduction
DNA methylation (DNAm) and microRNAs (miRNAs) influence protein-coding gene expression independent of and as a consequence of changes in DNA sequence. Recent population-based studies have demonstrated that variation in DNAm and miRNA expression are associated with interindividual phenotypic variation. For example, locus-specific differences in DNAm are associated with a wide range of cardiometabolic phenotypes such as body mass index[Citation1], lipid traits [Citation2,Citation3], glycemic traits [Citation4], and inflammatory biomarkers [Citation5]. Aging and environmental exposures, such as cigarette smoking and alcohol consumption, also have large effects on genome-wide DNAm [Citation6–Citation9]. In addition to DNAm, specific miRNA expression patterns have been associated with various cardiovascular disorders and cancer [Citation10–Citation16]. Both DNAm and miRNA expression are often studied in isolation, but they are not independent [Citation17,Citation18] and few studies have integrated DNAm and miRNA in relation to human diseases.
DNAm, the covalent binding of a methyl group to the 5ʹ carbon of cytosine, occurs primarily at cytosine-phosphate-guanine (CpG) dinucleotide sequences in the genome and influences the pre-transcriptional regulation of protein-coding genes by affecting the binding of chromatin proteins and transcription factors (TFs) to DNA sequences [Citation19,Citation20]. For example, the methylation of CpG island promoters prevents binding of TFs, inhibits transcription initiation, and results in gene silencing. Methylation of the gene body region, however, can stimulate gene transcription elongation, and may also affect messenger RNA (mRNA) splicing [Citation21]. miRNAs, which comprise a large family of single-stranded non-protein-coding RNAs of approximately 22 nucleotides, also influence protein-coding gene expression by causing degradation of complementary mRNAs or inhibiting translation [Citation22,Citation23]. There are over 2000 mature miRNAs [Citation24] that control, in part, the expression of about two-thirds of human genes [Citation25]. In addition, genetic variation strongly influences DNAm [Citation26–Citation32] and miRNA expression levels [Citation33].
While the relationship between DNAm and protein-coding gene expression has been studied extensively [Citation34,Citation35], a comprehensive genome-wide interrogation of the relationship between DNAm and miRNAs is lacking. Integration of DNA sequence variation, DNAm, and miRNA expression may also provide vital insights into the biological processes. To this end, we performed an epigenome-wide association study of DNAm at over 400,000 CpGs with expression of 283 miRNAs in 3565 Framingham Heart Study (FHS) participants. A comprehensive map of CpGs linked to miRNAs (miRNA expression quantitative trait methylation loci; miR-eQTMs) as well as bi-directional Mendelian randomization (MR) analyses were used to unravel the influence of DNAm on miRNA expression. We additionally integrated genetic variants, miR-eQTMs, and protein-coding gene targets of miRNAs with human complex traits. Comprehensive two-step MR analyses were performed to explore the epigenetically-driven molecular cross-talk between DNAm, miRNAs, and human complex phenotypes (study design outlined in ).
Figure 1. Analysis Flowchart.
Pair-wise associations between over 400K CpGs and 285 miRNAs were performed to identify cis- and trans-miR-eQTMs. Internal replication suggested cis- but not trans-miR-eQTMs are replicable. Therefore, the following analysis focused on cis-miR-eQTMs. For each cis-miR-eQTM CpG-miRNA pair, bi-directional MR analysis was used to identify CpG→miRNA pairs (i.e. the changes of DNAm driving the changes of miRNAs but not vice versa). Then, we linked cis-meQTLs with human complex traits, bi-directional MR analysis was used to identify CpG→Trait. Two-step MR analysis was used to further identify miRNA→Trait to establish CpG→miRNA→Trait.
Results
Clinical characteristics summary
A total of 3565 FHS participants had whole blood miRNA expression measurements (for 283 miRNAs expressed in >20% of participants) and DNAm measurements at 415,318 CpGs were used to identify miR-eQTMs, including 2124 FHS Offspring samples (mean age 66, 55% female) and 1441 FHS 3rd generation samples (mean age 45, 52% female). The demographic and clinical characteristics of the study participants are shown in Supplementary Table 1.
mRNA expression was measured in 5626 FHS participants, of which 5357 participants who also had miRNA expression were used for subsequent miRNA-mRNA coexpression analysis. A total of 3345 participants had miRNA, mRNA, and DNAm measurements.
Evaluation of the reproducibility of detected cis- and trans-miR-eQTMs
To evaluate the reproducibility of detected cis- and trans-miR-eQTMs in our data, we used an internal validation strategy by splitting the overall sample set into two independent subgroups; a discovery set (N = 1761) and a replication set (N = 1804). The clinical characteristics of the discovery and replication sets did not show substantive differences (Supplementary Table 2). We identified cis- and trans-miR-eQTMs in each set in the same fashion as in the overall sample (see the following subsection). The association t-statistic values for cis- and trans-miR-eQTMs were consistent between the discovery and replication sets (Supplementary Figure 1). At successively stringent discovery FDR thresholds of <0.1, 0.05, and 0.01, the replication ratio of cis-miR-eQTMs at replication FDR<0.1 are 55% (88/160), 72% (83/116), and 83% (65/78), respectively. In contrast, the replication ratio of trans-miR-eQTMs at replication FDR values of <0.1 are much lower at 0.3% (51/15,363), 0.8% (7/911) and 2% (6/304), respectively. Due to the low replication rate of trans-miR-eQTMs, the remainder of this paper focuses on cis-miR-eQTMs identified in the overall study sample at FDR<0.01.
Identification of cis-miR-eQTMs
We identified 227 CpGs (cis-miR-eQTMs) that were associated with expression levels of 40 miRNAs (299 cis miRNA-CpG pairs) at FDR<0.01 (corresponding P < 1.43E-5; and Supplementary Table 3) in the overall study sample (N = 3565). A total of 117 (out of 227) of the CpG sites were retained after removing correlated CpGs at r2 > 0.5 and 91 remained after removing those at r2 > 0.2. The top 20 cis-miR-eQTMs (selecting one peak CpG for each cis CpG-miR pair or clustered miRNAs at a single cis locus) are shown in . The most highly significant cis-miR-eQTM, cg06000878, was positively associated with both miR-100-5p (28Kb upstream) and miR-125b-5p (80Kb upstream) expression, with r2 between the CpG and miRNAs 31% and 14% respectively.
Table 1. Top 20 peak cis-miR-eQTMs identified in the 3656 FHS participants.
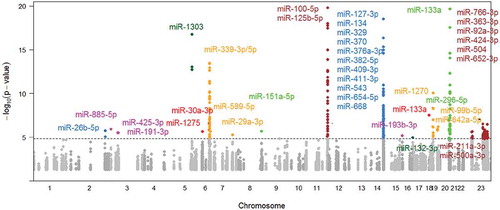
Figure 2. Manhattan plot of cis-miR-eQTMs.
The grey and dark grey colors denote cis-miR-eQTMs with P < 0.05, and the other colorful dots indicate cis-miR-eQTMs with P < 1.43E-5 (FDR<0.01). The dashed line indicates FDR = 0.01. 15 cis-miR-eQTMs for miR-125b-5p and miR-100-5p in Chromosome 11 and 3 cis-miR-eQTMs for miR-133a in Chromosome 20 were at P < 1E-20 and are not shown in this figure. miR-133a shows in both Chr18 and Chr20.
Characterizing cis-miR-eQTMs
To better understand cis-miR-eQTMs, we further investigated positive vs. negative correlations between CpGs and miRNAs, and if that direction of effects depends in part on their genomic locations in chromosomes. We found that 40% (121/299) of the cis CpG-miRNA pairs are positively correlated and 60% (178/299 pairs) are negatively correlated. The majority of cis-miR-eQTMs (76%, 227/299 pairs) reside upstream (toward the 5ʹ end) of the corresponding miRNAs. 14 cis-miR-eQTM CpGs are located within the promoter of the corresponding miRNAs (promoter regions were defined as 3Kb upstream and 500bp downstream of miRNA transcription start sites [TSS] [Citation36,Citation37]). Two cis-miR-eQTM CpGs are located within the precursor miRNA (pre-miRNAs), namely cg03295417 for miR-193b-3p, and cg16865908 for miR-125b-5p. Both are positively correlated. Enrichment analysis () revealed that cis-miR-eQTM CpGs are enriched at promoter and polycomb-repressed state regions (marked by chromatin markers H3K27me3 at Bonferroni-corrected P < 0.05/11), suggesting important regulatory roles of these CpGs on miRNA expression levels.
Table 2. Genomic features of cis-miR-eQTMs.
For the top result (see ), cg06000878 resides in the gene body of non-coding RNA LOC399959, and associated with both miR-100-5p and miR-125b-5p. There were 35 additional cis-miR-eQTM CpGs (27 CpG sites at r2 < 0.2) for either miR-100-5p, miR-125b-5p, or both. Expression levels of miR-100-5p and miR-125b-5p were moderately correlated (r2 = 0.32). Scatter plots and correlation heatmaps of cis-miR-eQTMs for both miRNAs are presented in -). Another example is on chromosome 14 where multiple CpGs were associated with expression of multiple miRNAs (-)). The top CpG (cg18089426) was associated with 9 miRNAs (miR-127-3p, miR-370, miR-668, miR-543, miR-654-5p, miR-411-3p, miR-409-3p, miR-382-5p, and miR-376a-3p) in this region including 49 cis-miR-eQTM CpG-miRNA pairs. This region previously identified as a genomic imprinted region, includes the imprinted genes DLK1 and RTL1 [Citation38,Citation39]. The observed associations between CpGs and miRNAs at this locus did not change after adjusting for the expression levels of DLK1 and RTL1.
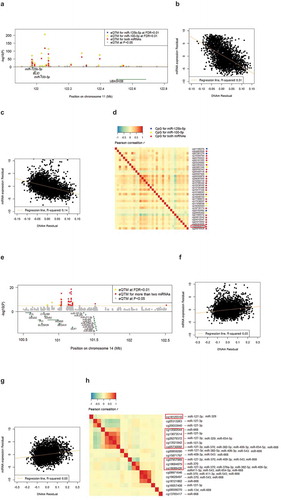
Figure 3. Examples of top cis-miR-eQTMs for miRNAs.
(a) Regional association plot of cis-miR-eQTMs and miRNAs (miR-100-5p, miR-125b-5p); (b) Scatter plot of DNAm values of the top CpG, cg06000878 with miR-100-5p; (c) Scatter plot of cg06000878 with miR-125b-5p; (d) Heatmap of Spearman correlation matrix of cis-miR-eQTMs for miR-100-5p and/or miR-125b-5p; (e) Regional association plot of cis-miR-eQTMs and miRNAs (miR-127-3p, miR-370, miR-668, miR-543, miR-654-5p, miR-411-3p, miR-409-3p, miR-382-5p, and miR-376a-3p); (f) Scatter plot of DNAm values of the top CpG, cg18089426 with miR-370; (g) Scatter plot of DNAm values of the top CpG, cg18089426 with miR-127-3p; (h) Heatmap of Spearman correlation matrix of cis-miR-eQTMs for miR-127-3p, miR-370, miR-668, miR-543, miR-654-5p, miR-411-3p, miR-409-3p, miR-382-5p, and miR-376a-3p. Highlighted red rectangle in (d) shows putatively causal CpGs for HDL cholesterol. Highlighted red rectangle in (e) shows putatively causal CpGs for age at menarche. The x-axis and y-axis in (b), (c), (g) and (h) are DNAm and miRNA expression residuals after adjusting for covariates (see Methods).
cis-miR-eQTMs for intragenic miRNAs conditioning on their host mRNAs
Intragenic miRNAs, where miRNAs are located within a protein-coding gene, can be transcribed either along with their host mRNAs or independent of them. We further evaluated whether the association between DNAm and intragenic miRNA expression was independent of the association between DNAm and expression of the host mRNA expression. The 40 miRNAs with cis-miR-eQTMs were located both within (intragenic) and outside (intergenic) coding gene bodies; 23 were intergenic miRNAs (97 cis-miR-eQTMs, 149 CpG-miRNA pairs) and 17 were intragenic miRNAs (136 cis-miR-eQTMs, 150 CpG-miRNA pairs). For the 17 intragenic miRNAs, we conditioned the association analyses between CpG methylation and miRNA expression on host mRNA expression levels. We found that each of the 150 intragenic cis miRNA-CpG pairs for intragenic miRNAs remained significantly associated after conditioning on host mRNA expression at Bonferroni corrected P < 3.3E-4 (0.05/150). Only two cis-miR-eQTMs were also associated with expression of the host mRNA at Bonferroni corrected P <3.3E-4, including cg02355304 for miR-589-5p and FBXL18, cg01349480 for miR-504 and FGF13. The associations between cg02355304 and miR-589-5p, and between cg01349480 and miR-504 remained significant when conditioning on their host mRNAs (Supplementary Table 4). These results suggest that the relationship between DNAm and miRNA expression levels can be independent of their host mRNA expression levels.
Dissecting genetic and epigenetic effects on miRNAs
To evaluate the joint genetic and epigenetic effects on miRNAs with cis-miR-eQTMs and cis-miR-eQTLs, we tested the proportion of variation in expression of each miRNA that was attributed to: 1) a single cis-miR-eQTM; 2) a single cis-miR-eQTL; 3) multiple cis-miR-eQTMs for the miRNA; 4) multiple cis-miR-eQTLs for the miRNA; and 5) a combination of cis-miR-eQTLs and cis-miR-eQTMs for the miRNA (see Methods). Our results show that the partial R2 between individual cis-miR-eQTM CpG and a miRNA is 0.02 ± 0.03 (mean ± SD), and between individual cis-miR-eQTL SNP and a miRNA is 0.01 ± 0.02. For the 27 miRNAs having both cis-miR-eQTMs and cis-miR-eQTLs, the partial R2 between multiple cis-miR-eQTM CpGs and a miRNA is 0.05 ± 0.08, whereas between multiple cis-miR-eQTL SNPs and a miRNA is 0.13 ± 0.09. The partial R2 of cis-miR-eQTM CpGs for each miRNA was 0.02 ± 0.03 when conditioning on the cis-miR-eQTL SNPs (Supplementary Table 5). The top example is for miR-100-5p; the partial R2 of the 33 cis-miR-eQTM CpGs and miR-100-5p is 0.14 when conditioning on the 339 cis-miR-eQTL SNPs.
cis-miR-eQTM effects on miRNA targets
To investigate the effects of cis-miR-eQTMs on the expression of miRNA protein-coding gene targets (i.e., mRNA expression), we performed miRNA-mRNA co-expression analyses and used in silico prediction models to identify miRNA targets (see Methods). For the 40 miRNAs having cis-miR-eQTMs, we identified 1739 mRNAs that were co-expressed and were predicted to be miRNA targets, representing 2621 miRNA-mRNA pairs (Supplementary Table 6). We found that cis-miR-eQTM CpGs tended to be associated with the expression of miRNAs targeting mRNAs (by binomial test, P < 2.2E-16), suggesting that cis-miR-eQTMs may affect miRNA targets through miRNAs. Due to the complex interactions between miRNAs and their targets (e.g., pleiotropic effects of miRNAs on multiple targets, multiple miRNAs targeting the same mRNAs, and other genes/proteins driving expression changes of mRNAs), we were unable to estimate the exact proportion of CpG effect on miRNA targets mediated by miRNAs.
Bidirectional mendelian randomization testing to identify putatively causal CpGs for miRNAs
Due to the nature of the association analyses between CpGs and miRNAs, we were unable to determine whether DNAm drives miRNA expression changes or vice versa. Therefore, we performed bidirectional MR testing to further distinguish whether CpGs are causal for miRNA or vice versa (). In our previous studies, we identified genetic variants associated with miRNA expression (miR-eQTLs [Citation33]) and with methylation of CpGs (meQTLs [Citation40]). Among the 299 CpG-miRNA pairs, there were 116 pairs for which the CpGs and miRNAs have both cis-meQTLs (n ≥ 3 variants at LD r2 < 0.1) and cis-miR-eQTLs (n ≥ 3 variants at LD r2 < 0.1) and were eligible for robust MR testing. The other pairs were not suitable for MR analysis. Bidirectional MR results are presented in Supplementary Table 7. We identified 89 pairs where the CpG was putatively causal for miRNA expression (CpG→miRNA, at PMR< 0.05/116), and 34 pairs where the miRNA expression was putatively casual for CpG (miRNA→CpG, at PMR < 0.05/116). Thirty-one pairs overlapped, i.e., both CpG→miRNA and miRNA→CpG MR tests were significant. We excluded these 31 bi-directionally causal pairs and focused on the 58 pairs for which the CpG tested causal for the miRNA but the miRNA did not test causal for the CpG; this represented 36 CpGs and 17 miRNAs. There were only three pairs for which the miRNA tested causal for the CpG but not vice versa, i.e., miR-1270→cg03570035/cg07227744/cg03317517. Bidirectional MR results showed that the majority of CpG-miRNA pairs are CpG causal for miRNA rather than miRNA causal for CpG. This result, coupled with the results reported above that cis-miR-eQTM CpGs are enriched for promoter-associated and polycomb-repressed state regions, suggests that changes in DNAm of cis-miR-eQTM CpGs may affect miRNA expression rather than vice versa.
cis-miR-eQTMs helping to identify novel pathways underlying human complex traits
To further demonstrate the utility of our cis-miR-eQTMs resource, we linked cis-meQTLs and cis-miR-eQTLs with GWAS Catalog SNPs for human complex diseases and traits. We further performed MR to identify putatively causal CpGs for human complex traits where the causal pathways may or may not act through miRNAs, i.e., CpG→ trait, or CpG→miRNA→trait. The analysis flowchart is shown in . Among the 58 CpG→miRNA pairs, 52 pairs having both cis-meQTLs and cis-miR-eQTLs perfectly matched GWAS SNPs for eight complex traits in the GWAS Catalog, including acute graft versus host disease in bone marrow transplantation, atrial fibrillation, age at menarche, C-reactive protein levels, facial morphology, HDL cholesterol, magnesium levels, and total cholesterol (TC). This overlap of SNP associations suggests that CpGs and miRNAs may be involved in the gene regulatory pathways for the traits or that changes in CpGs and miRNAs reflect trait variability. Full GWAS summary results for five traits that are publicly available were suitable for robust MR testing. Bidirectional MR tests were performed on CpG-trait pairs to identify putatively causal CpGs for traits (i.e., CpG→trait, at PMR< 0.05) for which reverse causality was unlikely (i.e., trait→CpG at PMR> 0.05, ). In doing so, we identified cg25998745 as putatively causal for atrial fibrillation, cg26684673 for HDL cholesterol, 16 CpGs (3 CpG sites at r2 < 0.2, e.g., cg24642844) for total cholesterol, and 9 CpGs (3 CpG sites at r2 < 0.2, including cg18089426) for age at menarche (Supplementary Table 6). Two-step MR testing was performed to identify miRNAs in the causal pathways that were driven by CpG methylation, e.g., cg26684673→miR-125b-5p→HDL cholesterol (Supplementary Table 6). A notable example is the 9 CpGs and 3 miRNAs that tested causal for age at menarche (also see in -)). By utilizing two GWAS resources for age at menarche from independent sample sets including 182,416 individuals from 57 studies [Citation41] and 272,937 individuals from UK Biobank (www.nealelab.is/uk-biobank/) we cross-validated the MR results (). Many cis-miR-eQTMs were found in this genomic imprinted region that were associated with age at menarche. This finding is consistent with the hypothesis that epigenetic regulation involving both DNAm and miRNAs is critical in genomic imprinting and results in wide variability of age at menarche. Further experiments and investigation are necessary to prove this hypothesis. The directions of associations in causal testing suggest that hypermethylation of cg18089426 promotes decreased expression of miR-411-3p, miR-382-5p, and miR-127-3p and contributes to older age at menarche.
Table 3. Mendelian Randomization examining causal CpGs and miRNAs for age at menarche.
Discussion
In this investigation, we report results of the first systematic epigenome-wide association study of miRNA expression and identified 299 correlated cis CpG-miRNA pairs. Bidirectional MR analysis identified 58 pairs for which the DNAm appears to drive changes in miRNA expression. Joint analyses of genetic variants, DNAm, and miRNA expression demonstrated a partial R2 between DNAm and miRNA expression of 2% after conditioning on genetic variants. Our study constitutes an important step toward a more comprehensive understanding of the regulation of miRNA expression by genetic and epigenetic mechanisms. In addition, we identified examples of DNAm and miRNA expression that are putatively causally in relation to human complex traits. For instance, we found that hypermethylation of cg18089426 and expression of miR-411-3p, miR-382-5p, and miR-127-3p contribute to variation in age at menarche. Moreover, this CpG and these miRNAs are located at a region of the genome that has previously been reported to contribute to imprinting [Citation38,Citation39].
DNAm influences pre-transcriptional regulation of protein-coding genes. Several studies have revealed differential methylation of thousands of CpGs in association with protein-coding mRNAs, i.e., cis-mRNA-eQTMs [Citation34,Citation35]. To our knowledge, our study is the first to provide genome-wide mapping of DNAm and miRNA expression. We found that cis-miR-eQTMs are enriched in promoter and polycomb-repressed regions. Higher methylation at 60% of cis-miR-eQTMs is associated with lower miRNA expression. These results suggest that methylation of CpGs residing adjacent to miRNAs may silence the transcription of those miRNAs, similar to observed relations of differential methylation of CpGs to expression of nearby protein-coding genes [Citation42]. We identified 2 cis-miR-eQTMs located within pre-miRNAs or mature miRNAs that are positively associated with miRNA expression. This suggests that methylation in miRNA body regions may foster the transcription of miRNAs, similar to what has been reported for protein-coding genes [Citation43].
We found genetic variants that are associated with both cis-DNAm (cis-meQTLs) and cis-miRNA expression (cis-miR-eQTLs). We hypothesize that given the close physical proximity of interrelated SNPs, CpGs, and miRNAs, the observed associations may be driven by changes in TF binding or by direct influences on the three-dimensional conformational structure of chromatin, perhaps by impairing CTCF binding sites. We further demonstrated that inter-individual variation in miRNA expression is influenced by cis genetic and epigenetic contributions. After conditioning on shared SNPs (miR-eQTLs and meQTLs), our results show that the associations of CpGs and miRNAs remain significant and often display substantial effect sizes. The strongest association of cis-miR-eQTMs (CpG with nearby miRNA) were for miR-100-5p and miR-125b-5p. These two miRNAs are located close to each other on chromosome 11 and are moderately correlated with each other (r2 = 0.3). The partial R2 of the 33 cis-miR-eQTM CpGs for miR-100-5p expression was 14%, and the partial R2 of the 28 cis-miR-eQTMs for miR-125b-5p expression is 6%, both after conditioning on cis-miR-eQTL SNPs. We identified 25 shared cis-miR-eQTMs for both miRNAs, with 14 of these CpGs lying within known enhancers (Supplementary Table 3). Additional epigenetic regulatory effects may exist from elements that we did not assay. The full list of cis-miR-eQTMs includes miRNAs that warrant further functional exploration.
Among the 40 miRNAs harboring cis-miR-eQTMs, there are 17 intragenic miRNAs. Intragenic miRNAs lying within protein-coding genes can be transcribed together with their host mRNAs or independently. The conditional analyses revealed that 98% of DNAm-miRNA expression pairs remain significantly associated after adjusting for expression of the host mRNA, thus suggesting that the identified epigenetic relations of DNA methylation to miRNA expression is independent of the host mRNA expression. We identified methylation at two CpGs to be associated with both intragenic miRNA and host mRNA expression; specifically, cg02355304 for miR-589-5p and FBXL18, and cg01349480 for miR-504 and FGF13. These results support the hypothesis that miRNAs can be transcribed together with their host mRNAs or independently.
To further demonstrate the utility of our cis-miR-eQTMs resource, we crosslinked cis-miR-eQTMs with GWAS Catalog traits by linking cis-meQTLs and cis-miR-eQTLs with GWAS Catalog SNPs [Citation44]. We were able to link 90% (52/58) of causal CpG→miRNA pairs to complex traits via perfect overlap with cis-meQTLs and cis-miR-eQTLs. These findings suggest that DNAm and miRNAs may be important contributors to human diseases and traits. For the five traits for which full GWAS results were publicly available, we performed MR analyses to further assess causal relations between CpGs and complex traits. A similar study by Richardson et al. used cis-meQTLs as instrumental variables to identify causal CpGs for cardiovascular disease traits by MR [Citation45]. However, they focused on a different set of CpGs than the cis-miR-eQTMs in this study. By linking cis-miR-eQTMs miRNAs with putatively causal CpGs, we provide a more complete picture of CpG-related causal pathways involving miRNAs. Our most biologically compelling example is that of 49 cis CpG-miRNA pairs for 19 CpGs and 9 miRNAs residing in an imprinted region on 14q32. Prior studies identified paternally inherited SNPs in association with human complex traits [Citation46], e.g., rs941576 in this region in relation to type I diabetes [Citation47]. Imprinted genes were defined as genes that exhibit activity differences in the offspring depending on which parent passes on that gene. Imprinted genes were also identified in relation with human complex traits. For example, DLK1 was reported to be associated with age at menarche [Citation41] and with many cancers [Citation48–Citation50]. About ten imprinted genes in the orthologous mouse region (12qF1), including DLK1, were reported [Citation38]. miRNAs aligning to this region in mice were reported to exhibit a pattern of maternal inheritance [Citation51]. Genomic imprinting was thought to be involved in epigenetic regulation, however, the precise molecular mechanisms underlying genomic imprinting are largely unknown [Citation51]. We identified many cis-miR-eQTMs in the 14q32 imprinted region. Our findings lead to a new hypothesis that the CpG-miRNAs pairs in this region may be involved in the observed imprinting. Many of these interlinked CpGs and miRNAs at this locus are associated with age at menarche and MR testing suggests causal relations. Age at menarche varies considerably between individuals and this variation reflects both genetic and environmental influences. Perry et al. reported on the association of SNPs and expression levels of DLK1 in 14q32 with age at menarche [Citation41]. Their research provides an example of imprinted genes that may influence later life health outcomes. Subsequent research further established links between age at menarche with other diseases such as cancer [Citation52]. Our findings in concert with previous studies reveal a wider and more complex network involving both DNAm and miRNA, and suggest that DNAm and miRNAs are key epigenetic determinants of age at menarche and may contribute to related disease risk. We acknowledge that a limitation of this study is that array-based data is incapable of measuring DNAm levels in an allele-specific manner, therefore, we were unable to confirm if specific CpGs show allele-specific DNAm inherited from the father and/or mother. Further experiments are warranted to test this hypothesis.
We acknowledge several other limitations of our study. First, to our knowledge, no other study has published extensive association analyses of miRNA expression and DNAm, and therefore we were unable to perform independent external replication of our results. The internal validation strategy suggested that cis-miR-eQTMs are replicable but trans-miR-eQTMs are not replicable. trans-miR-eQTMs may require much larger sample sizes as well as robust independent external replication. Second, we assessed DNAm and miRNA expression in whole blood, which consists of multiple cell types. We were unable to identify cell type-specific miR-eQTMs using our data. We were also unable to describe the tissue-specific relations between DNA methylation and miRNA expression that may vastly differ from what we observed in whole blood. Third, even though the Illumina DNAm platform we used covers about 450,000 CpG sites, it does not assay every CpG site in the genome. In addition, we did not measure every possible miRNA, and therefore may have missed important regulatory miR-eQTMs. The diversity and complexity of the multifaceted relationship between miRNA and methylation warrants additional studies.
Experimental procedures
Study participants
The FHS Offspring cohort was recruited in 1971 and consisted of 5124 children (and their spouses) of the FHS Generation 1 cohort [Citation53]. Between 2002 to 2005, 4095 children of the Offspring cohort participants were recruited, comprising the Third Generation cohort [Citation54]. Eligible participants from the Offspring cohort who attended their eighth examination cycle (Exam 8, 2005–2008) and Third generation who attended their second examination cycle (Exam 2, 2008–2011) were included in this study. For internal validation, the entire FHS study sample was split 1:1 by pedigrees into independent discovery and replication sets.
miRNA expression assays (N = 5221) were conducted on whole blood samples from 2295 FHS Offspring (Exam 8) and 2926 Third Generation (Exam 2) participants. DNAm assays (N = 3943) were conducted on whole blood samples from 2427 Offspring cohort participants (Exam 8) and 1516 Third Generation (Exam 2) participants. miRNA expression and DNAm data were both available for 3565 participants. This study was approved under the Boston University Medical Center protocol H-27,984. All participants provided written consent for genetic research.
DNAm profiling and data normalization
Buffy coats were prepared from whole blood samples. Genomic DNA was extracted using the Gentra Puregene DNA extraction kit (Qiagen, Venlo, Netherlands), and bisulfite conversion was performed using the EZ DNAm kit (Zymo Research, Irvine, CA). Samples underwent DNA amplification, fragmentation, array hybridization, and single-base pair extension. DNA methylation levels were measured using the Illumina Infinium Human Methylation450 BeadChip (450K). DNAm arrays of FHS Offspring cohort participants were run in two laboratory batches at the Johns Hopkins Center for Inherited Disease Research (lab batch #1) and University of Minnesota Biomedical Genomics Center (lab batch #2). DNAm arrays were run on 1516 FHS Third Generation cohort participants (lab batch #3) by Illumina, Inc (City, State).
DNAm results were normalized by laboratory batch using the DASEN methodology implemented in the wateRmelon package [Citation55] in R (version 3.0.2). For sample quality control, samples with a missing rate >1% at P < 0.01, poor single nucleotide polymorphism (SNP) matching with the 65 SNP control probe locations, and outliers from multi-dimensional scaling techniques were excluded. For quality control at the probe level, we excluded probes that had a missing rate >20% at P < 0.01, were previously identified to map to multiple locations [Citation56], or had an underlying SNP (minor allele frequency >5% in European ancestry (EUR) 1000 genomes project data) at the CpG site or within 10 bp of the single base extension. A total of 415,318 CpG probes were retained for further analyses.
We used surrogate variable analyses (SVA) to eliminate unwanted variation in the DNAm data [Citation57]. SVs were generated in each lab batch separately, totaling 71 (Lab 1), 170 (Lab 2), and 173 (Lab 3) SVs from the DNAm data in the three laboratory batches, respectively. DNAm beta values were regressed on batch-specific SVs, and the DNAm residual was taken forward. All three lab batches were merged together for analysis. In our previous studies using the same data, the SVA method was demonstrated to adequately account for latent batch effects, variations in blood cell proportions, and technical covariates [Citation1,Citation6]. Therefore, to avoid over adjustment, we did not further adjust for technical covariates (i.e. plates, rows and columns) or cell types in DNAm data.
miRNA expression profiling and data normalization
miRNAs were measured from venous blood samples obtained from participants after overnight fasting. Whole blood samples (2.5ml) were collected in PAXgene Blood RNA™ tubes (Qiagen, Valencia, CA) and frozen at – 80°C. Total RNA was isolated from the frozen PAXgene Blood RNA tubes (Asuragen, Inc. Austin, TX) and a 2100 Bioanalyzer Instrument (Agilent, Santa Clara, CA) was used to assess RNA quality (i.e., RNA integrity number [RIN], ranging from 1 to 10). A RIN threshold of 4 was considered to reflect adequate quality. This threshold was determined based on comparison between the samples with RIN≥9 and RIN≥4 by principal component tests as described by previously Joehanes et al [Citation58]. Isolated RNA samples were converted to complementary DNA (cDNA) using TaqMan miRNA Reverse Transcription Kit and MegaPlex Human RT Primer Pool Av2.1 and Pool Bv3.0. (Life Technologies, Foster City, CA) in a 384 well Thermal Cycler. The cDNA samples were PreAmplified using TaqMan PreAmp Master Mix and PreAmp Primers, Human Pool A v2.1 and Pool B v3.0 (Life Technologies, Foster City, CA).
qRT-PCR reactions were performed with the BioMark System using (Fluidigm, South San Francisco, CA) TaqMan miRNA Assays (Life Technologies, Foster City, CA). As described in the published literature, measurement of RNA by qRT-PCR is reliable and highly specific and sensitive [Citation59–Citation61]. All qRT-PCR reactions were performed in the BioMark Real-Time PCR system using the following protocol: 10 min at 95°C, 15 sec at 95°C and 1 min at 60°C for 30 cycles. Single copy can be detected with BioMark system at 26–27 Cycle Thresholds. Among the 70 replicate samples, more than 95% of the data points had coefficients of variation that were less than 10% (mean ~4%).
The initial miRNA list encompassed all TaqMan miRNA assays available at the start of the study, including 754 miRNAs that were profiled in 455 FHS individuals. 346 miRNAs expressed in > 20% samples were further profiled in 2445 FHS Offspring and 3245 Third Generation cohort participants. Quantification of miRNA expression was based on cycle threshold (Ct), where lower Ct values signified higher miRNA expression levels. Ct values≥27 indicated that the respective miRNAs were not expressed in the sample. Outlier miRNAs with Ct values ≥5 standard deviations from the mean Ct value were categorized as missing. We excluded miRNAs expressed in <100 samples. A total of 283 miRNAs remained for analysis.
As previously described, raw miRNA Ct values were adjusted for four technical variables: isolation batch (50 batches), RNA concentration, RNA quality (defined as RNA integrity number [RIN]), and RNA 260/280 ratio (ratio of absorbance at 260nm and 280nm from spectrophotometry) [Citation33]. This normalization model explained 20% to 60% of the variability in raw miRNA measurements for 80% of miRNAs.
mRNA expression profiling and data normalization
Whole blood samples (2.5ml) were collected in PAXgene™ tubes by Asuragen, Inc. (PreAnalytiX, Hombrechtikon, Switzerland). Total RNA was isolated in a single batch on a KingFisher® 96 robot according to the company’s standard operating procedures for automated isolation of RNA from 96 samples. Then, 50ng RNA samples were amplified using the WT-Ovation Pico RNA Amplification System (NuGEN, San Carlos, CA) in an automated manner using the genechip array station (GCAS) as recommended by the manufacturer. mRNA expression profiling was obtained from the Affymetrix Human Exon 1.0 ST GeneChip platform, and the raw gene expression data was first preprocessed by quartile normalization. The robust multi-array average (RMA) values of every gene (17,318 measured genes) were adjusted for a set of technical covariates, i.e. chip batch, by fitting linear mixed regression (LME) models as described previously [Citation58].
mRNA expression data (N = 5626) were available for FHS Offspring (Exam 8, N = 2446) and Third Generation (Exam 2, N = 3180) participants. mRNA and miRNA expression were both available for 5357 participants.
Identification of differential DNAm in association with miRNA expression (miR-eQTMs)
DNAm and miRNA were separately regressed on technical and batch covariates or SVs, as described above, and residuals taken forward for analyses (see miRNA expression and data normalization, and DNAm profiling and data normalization). Linear mixed models (R package ‘lmekin’, https://cran.r-project.org/web/packages/kinship/, [Citation62]) were used to conduct pairwise DNAm – miRNA expression association analyses for residuals of all profiled CpGs (N = 415,318) and 283 miRNAs expressed in at least 100 samples. All analyses were adjusted for age and sex as fixed effects, and family structure as a random effect. In previous studies, we found that adjusting for blood cell proportions did not materially change the results for miRNAs in relation to genotypes [Citation33] or across multiple phenotypes [Citation14]. We investigated cell types effects using 932 individuals with quantification of cell type proportions. The Pearson correlation coefficients of the beta values of cis- miRNA-CpG associations with versus without adjustment for blood cell types was r > 0.99. We also compared beta values of cis- miRNA-CpGs associations with versus without adjustment for cell type compositions imputed from DNAm data via the Houseman methods in all 3565 samples. The Pearson correlation coefficients of beta values was r > 0.99. Therefore, we did not adjust for cell types in the miRNA data normalization model. CpG-miRNA pairs in which the CpG resided within 1Mb of the mature miRNA were categorized as cis-miR-eQTMs, and those residing more than 1Mb away were considered trans-miR-eQTMs.
Genome coordinate annotation for miRNAs and DNAm were conducted using miRbase v20 (mirbase.org) and Illumina annotation file v1.2, respectively. miRbase v20 and Illumina annotation file v1.2 were based on the human February 2009 (GRCh37/hg19) assembly. Based on the coordinates of 283 mature miRNAs and ~400K CpGs, we estimated that there were 250,622 potential cis CpG-miRNA pairs, and 1.1 × 10⁸ (i.e., 400,000 *283–250,622) potential trans CpG-miRNA pairs. We used the Benjamini-Hochberg method [Citation63] to calculate the false-discovery rate (FDR) for cis- and trans-miR-eQTMs, taking into account correlated cis and trans pairs. We selected an FDR threshold of 0.01, corresponding to P < 1.43E-5 for cis- and P < 1.87E-6 for trans-miR-eQTMs.
Cis-miR-eQTLs and cis-meQTLs
cis-miR-eQTLs (SNP located within 1Mb on either side of the corresponding mature miRNA) were generated using the same miRNA data in the FHS cohorts as described previously. There were 5269 cis-miR-eQTLs for 76 mature miRNAs [Citation33] in total.
cis-meQTLs (SNP located within 1Mb on either side of the CpGs) were generated using the same DNAm data in the FHS cohorts [Citation40]. Genotyping was conducted using the Affymetrix 500K mapping and Affymetrix 50K gene-focused MIP arrays according to previously described quality control procedures [Citation64]. Genotypes were imputed using the 1000 Genomes Project panel via MACH [Citation65] with MAF≥0.01 and imputation quality ratio≥0.1. Linear mixed models were applied to calculate the associations of SNPs (predictors) and DNAm residuals (outcomes, see DNAm profiling and data normalization). Analyses were adjusted for age and sex as fixed effects, and a familial correlation matrix (FAM) as the random effect using the lmekin() function of Kinship Package (https://cran.r-project.org/web/packages/kinship/) [Citation62]. Bonferroni-corrected P < 2E-11 was used to define significant cis-meQTLs.
miRNA – mRNA co-expression analysis
miRNA-mRNA co-expression analyses were performed on 5626 FHS participants with available miRNA and mRNA data. A linear mixed-effects model implemented in the lmekin() R function was used to conduct pair-wise association analyses between miRNAs and mRNAs. Analyses were adjusted for age, sex, technical covariates for miRNA and mRNA data, and SVs for mRNA data. The P value threshold for choosing miRNA-mRNA co-expressed pairs was determined using a Benjamini-Hochberg corrected FDR<0.05 [Citation63].
Predicted miRNA targets
For each significant miRNA-mRNA co-expressed pair, we used two miRNA target prediction methods TargetScan 7.0 and miRanda to predict if the co-expressed mRNAs were also miRNA targets. TargetScan predicts miRNA targets of miRNAs by searching for the presence of 8mer, 7mer, and 6mer sites that match the seed region of each miRNA [Citation66]. miRanda three-step predicts miRNA targets with a threshold of score > 140 [Citation67]. The sequences from 3ʹUTR, 5ʹUTR, and coding regions of each mRNA were downloaded from the University of California Santa Cruz (UCSC) Table Browser (https://genome.ucsc.edu/), and miRNA seed regions were downloaded from miRbase v21 (http://www.mirbase.org/).
Mendelian randomization
Bi-directional Mendelian randomization (MR) was used to test if changes in CpG methylation drive changes in miRNA expression (CpG→miRNA) or if changes in miRNA expression drive changes in CpG methylation (miRNA→CpG). MR tests were performed in 116 CpG-miRNA pairs where both the CpG and miRNA have at least three independent instrument variables (IVs). cis-meQTLs (at LD r2 < 0.1) were used as IVs to test if CpG→miRNA, and cis-miR-eQTLs (at LD r2 < 0.1) were used as IVs to test if miRNA→CpG. Inverse variance-weighted (IVW) MR methods were used for all MR tests [Citation68]. The significant threshold was a Bonferroni-corrected PMR <0.05/116.
Two-sample IVW-MR methods were used to identify if CpG methylation and miRNA expression were putatively causal for human complex traits, including atrial fibrillation, age at menarche, HDL cholesterol, magnesium levels, and total cholesterol. SNP-trait associations were taken from published meta-analysis GWAS results of age at menarche [Citation41], total cholesterol and HDL cholesterol [Citation69], and from UK Biobank GWAS results of age at menarche, magnesium levels and atrial fibrillation downloaded from (http://www.nealelab.is/uk-biobank/). To identify CpG→Trait, independent cis-meQTLs at LD r2 < 0.1 were used as IVs. To identify miRNA→Trait, independent cis-miR-eQTLs at LD r2 < 0.1 were used as IVs. We also perform MR to test if trait→CpG by utilizing trait-associated SNPs at P < 5E-8 in GWAS as IVs (independent SNPs were selected by LD r2 < 0.1). A random effects model of IVW-MR method was used to minimize the heterogeneity effects of IVs [Citation70]. MR analyses were conducted using the mrBase R package [Citation70].
Functional annotations of cis-miR-eQTMs
We annotated cis-miR-eQTM CpGs using Illumina platform annotations and GM12878 Encode chromatin state segmentation by hidden Markov models (ChromHMM) [Citation71]. The Illumina platform annotation provided the predicted functions for each CpG site (CpG Islands, low CpG dense, high CpG dense), enhancer and promoter regions. The GM12878 ChromHMM Track provided chromatin states identified by computationally integrating ChIP-seq data (H3K4me1, H3K4me2, H3K4me3, H3K27ac, H3K9ac, HK27me3, H4K20me1, and H3K36me3) from GM12878, a lymphoblastoid cell line, including promotor, enhancer, polycomb-repressed, heterochromatin, and repetitive/copy number variation. Hypergeometric tests were used to test if cis-miR-eQTM CpGs sites were enriched at functional genomic sites that were annotated as functional. The significance threshold was Bonferroni-corrected P < 0.05/11.
Data access
The microRNA expression, mRNA expression and DNAm data used in this investigation are available online in dbGaP (http://www.ncbi.nlm.nih.gov/gap; accession number phs000007).
Supplemental Material
Download MS Excel (424.1 KB)Acknowledgments
The Framingham Heart Study is funded by National Institutes of Health contract N01-HC-25195 and HHSN268201500001I. The laboratory work for this investigation was funded by the Division of Intramural Research, National Heart, Lung, and Blood Institute, National Institutes of Health. The analytical component of this project was funded by the Division of Intramural Research, National Heart, Lung, and Blood Institute, and the Center for Information Technology, National Institutes of Health, Bethesda, MD and R56AG029451 (M.G.L.).
The views expressed in this manuscript are those of the authors and do not necessarily represent the views of the National Heart, Lung, and Blood Institute; the National Institutes of Health; or the U.S. Department of Health and Human Services.
Authors’ contributions: D.L. designed, directed, and supervised the project. T. H., M.M., and D.L. drafted the manuscript. T.H., C.L., J.R., C.Y., C.S., J.R., and A.B. conducted the analyses. J.E.F. and K.T. conducted the miRNA expression experiments. All authors participated in revising and editing the manuscripts. All authors have read and approved the final version of the manuscript.
Disclosure statement
No potential conflict of interest was reported by the authors.
Supplementary material
Supplemental data for this article can be accessed here.
Additional information
Funding
Related Research Data
References
- Mendelson MM, Marioni RE, Joehanes R, et al. Association of body mass index with DNA methylation and gene expression in blood cells and relations to cardiometabolic disease: a mendelian randomization approach. PLoS Med. 2017;14:e1002215.
- Hedman ÅK, Mendelson MM, Marioni RE, et al. Epigenetic patterns in blood associated with lipid traits predict incident coronary heart disease events and are enriched for results from genome-wide association studies clinical perspective. Circ Cardiovasc Genet. 2017;10:e001487.
- Irvin MR, Zhi D, Joehanes R, et al. Epigenome-wide association study of fasting blood lipids in the genetics of lipid lowering drugs and diet network study. Circulation. 2014;114:009158.
- Volkmar M, Dedeurwaerder S, Cunha DA, et al. DNA methylation profiling identifies epigenetic dysregulation in pancreatic islets from type 2 diabetic patients. Embo J. 2012;31:1405–1426.
- Ligthart S, Marzi C, Aslibekyan S, et al. DNA methylation signatures of chronic low-grade inflammation are associated with complex diseases. Genome Biol. 2016;17:255.
- Liu C, Marioni R, ÅK H, et al. A DNA methylation biomarker of alcohol consumption. Mol Psychiatry. 2016;23:422.
- Hannum G, Guinney J, Zhao L, et al. Genome-wide methylation profiles reveal quantitative views of human aging rates. Mol Cell. 2013;49:359–367.
- Horvath S. DNA methylation age of human tissues and cell types. Genome Biol. 2013;14:3156.
- Joehanes R, Just AC, Marioni RE, et al. Epigenetic signatures of cigarette smoking. Circ Cardiovasc Genet. 2016;9:436–447.
- Cordes KR, Srivastava D. MicroRNA regulation of cardiovascular development. Circ Res. 2009;104:724–732.
- Small EM, Olson EN. Pervasive roles of microRNAs in cardiovascular biology. Nature. 2011;469:336–342.
- Thum T, Galuppo P, Wolf C, et al. MicroRNAs in the human heart. Circulation. 2007;116:258–267.
- Huan T, Rong J, Tanriverdi K, et al. Dissecting the roles of microRNAs in coronary heart disease via integrative genomic analyses. Arterioscler Thromb Vasc Biol. 2015;ATVBAHA:114.305176.
- McManus DD, Rong J, Huan T, et al. Messenger RNA and MicroRNA transcriptomic signatures of cardiometabolic risk factors. BMC Genomics. 2017;18:139.
- Jansson MD, Lund AH. MicroRNA and cancer. Mol Oncol. 2012;6:590–610.
- Esteller M. Epigenetics in cancer. N Engl J Med. 2008;358:1148–1159.
- Loginov V, Rykov S, Fridman M, et al. Methylation of miRNA genes and oncogenesis. Biochemistry (Moscow). 2015;80:145–162.
- Chuang JC, Jones PA. Epigenetics and microRNAs. Pediatr Res. 2007;61:24R–9R.
- Ehrlich M, Gama-Sosa MA, Huang L-H, et al. Amount and distribution of 5-methylcytosine in human DNA from different types of tissues or cells. Nucleic Acids Res. 1982;10:2709–2721.
- Wu H, Zhang Y. Reversing DNA methylation: mechanisms, genomics, and biological functions. Cell. 2014;156:45–68.
- Lister R, Pelizzola M, Dowen RH, et al. Human DNA methylomes at base resolution show widespread epigenomic differences. Nature. 2009;462:315–322.
- Lee R, Feinbaum R, Ambros V. A short history of a short RNA. Cell. 2004;116:S89–S92.
- Lee RC, Ambros V. An extensive class of small RNAs in caenorhabditis elegans. Science. 2001;294:862–864.
- Kozomara A, Griffiths-Jones S. miRBase: annotating high confidence microRNAs using deep sequencing data. Nucleic Acids Res. 2014;42:D68–D73.
- Friedman RC, Farh KK-H, Burge CB, et al. Most mammalian mRNAs are conserved targets of microRNAs. Genome Res. 2009;19:92–105.
- Lemire M, Zaidi SH, Ban M, et al. Long-range epigenetic regulation is conferred by genetic variation located at thousands of independent loci. Nat Commun. 2015;6:6326.
- Hannon E, Spiers H, Viana J, et al. Methylation QTLs in the developing brain and their enrichment in schizophrenia risk loci. Nat Neurosci. 2016;19:48–54.
- Bonder MJ, Luijk R, Zhernakova DV, et al. Disease variants alter transcription factor levels and methylation of their binding sites. Nat Genet. 2017;49:131.
- Shi J, Marconett C, Duan J, et al. Characterizing the genetic basis of methylome diversity in histologically normal human lung tissue. Nature communications. 2014;6:3365.
- Gaunt TR, Shihab HA, Hemani G, et al. Systematic identification of genetic influences on methylation across the human life course. Genome Biol. 2016;17:61.
- McClay JL, Shabalin AA, Dozmorov MG, et al. High density methylation QTL analysis in human blood via next-generation sequencing of the methylated genomic DNA fraction. Genome Biol. 2015;16:291.
- McRae A, Marioni RE, Shah S, et al. Identification of 55,000 replicated DNA methylation QTL. Scientific Reports. 2018;8:17605.
- Huan T, Rong J, Liu C, et al. Genome-wide identification of microRNA expression quantitative trait loci. Nat Commun. 2015;6:6601.
- Wagner JR, Busche S, Ge B, et al. The relationship between DNA methylation, genetic and expression inter-individual variation in untransformed human fibroblasts. Genome Biol. 2014;15:R37.
- Liu Y, Ding J, Reynolds LM, et al. Methylomics of gene expression in human monocytes. Hum Mol Genet. 2013;22:5065–5074.
- Marsico A, Huska MR, Lasserre J, et al. PROmiRNA: a new miRNA promoter recognition method uncovers the complex regulation of intronic miRNAs. Genome Biol. 2013;14:R84.
- Chen D, Fu L-Y, Zhang Z, et al. Dissecting the chromatin interactome of microRNA genes. Nucleic Acids Res. 2014;42:3028–3043.
- Hagan JP, O’Neill BL, Stewart CL, et al. At least ten genes define the imprinted Dlk1-Dio3 cluster on mouse chromosome 12qF1. PloS One. 2009;4:e4352.
- Kagami M, Sekita Y, Nishimura G, et al. Deletions and epimutations affecting the human 14q32. 2 imprinted region in individuals with paternal and maternal upd (14)-like phenotypes. Nat Genet. 2008;40:237.
- Huan T. Genome-wide identification of DNA methylation quantitative trait loci in human whole blood highlights novel pathways for cardiovascular diseases. American Society of Human Genetics 68th Annual Meeting; San Diego; 2018.
- Perry JR, Day F, Elks CE, et al. Parent-of-origin-specific allelic associations among 106 genomic loci for age at menarche. Nature. 2014;514:92.
- Kass SU, Landsberger N, Wolffe AP. DNA methylation directs a time-dependent repression of transcription initiation. Curr Biol. 1997;7:157–165.
- Jones PA. The DNA methylation paradox. Trends Genet. 1999;15:34–37.
- MacArthur J, Bowler E, Cerezo M, et al. The new NHGRI-EBI Catalog of published genome-wide association studies (GWAS catalog). Nucleic acids res 2016; 45:D896–D901.
- Richardson TG, Zheng J, Smith GD, et al. Mendelian randomization analysis identifies CpG sites as putative mediators for genetic influences on cardiovascular disease risk. Am J Hum Genet. 2017;101:590–602.
- Kong A, Steinthorsdottir V, Masson G, et al. Parental origin of sequence variants associated with complex diseases. Nature. 2009;462:868.
- Wallace C, Smyth DJ, Maisuria-Armer M, et al. The imprinted DLK1-MEG3 gene region on chromosome 14q32. 2 alters susceptibility to type 1 diabetes. Nat Genet. 2010;42:68.
- Sakajiri S, O’kelly J, Yin D, et al. Dlk1 in normal and abnormal hematopoiesis. Leukemia. 2005;19:1404.
- Astuti D, Latif F, Wagner K, et al. Epigenetic alteration at the DLK1-GTL2 imprinted domain in human neoplasia: analysis of neuroblastoma, phaeochromocytoma and Wilms’ tumour. Br J Cancer. 2005;92:1574.
- Khoury H, Suarez-Saiz F, Wu S, et al. An upstream insulator regulates DLK1 imprinting in AML. Blood 2010. blood-2009-03-212746.
- Gao Y-Q, Chen X, Wang P, et al. Regulation of DLK1 by the maternally expressed miR-379/miR-544 cluster may underlie callipyge polar overdominance inheritance. Proc Nat Acad Sci. 2015;112:13627–13632.
- Day FR, Thompson DJ, Helgason H, et al. Genomic analyses identify hundreds of variants associated with age at menarche and support a role for puberty timing in cancer risk. Nat Genet. 2017;49:834.
- Feinleib M, Kannel WB, Garrison RJ, et al. The Framingham offspring study. Design and preliminary data. Prev Med. 1975;4:518–525.
- Splansky GL, Corey D, Yang Q, et al. The third generation cohort of the National Heart, Lung, and Blood Institute’s Framingham Heart Study: design, recruitment, and initial examination. Am J Epidemiol. 2007;165:1328–1335.
- Pidsley R, CC YW, Volta M, et al. A data-driven approach to preprocessing Illumina 450K methylation array data. BMC Genomics. 2013;14:293.
- Chen YA, Lemire M, Choufani S, et al. Discovery of cross-reactive probes and polymorphic CpGs in the illumina infinium HumanMethylation450 microarray. Epigenetics. 2013;8:203–209.
- Leek JT, Storey JD. Capturing heterogeneity in gene expression studies by surrogate variable analysis. PLoS Genet. 2007;3:e161.
- Joehanes R, Ying S, Huan T, et al. Gene expression signatures of coronary heart disease significance. Arterioscler Thromb Vasc Biol. 2013;33:1418–1426.
- Jensen SG, Lamy P, Rasmussen MH, et al. Evaluation of two commercial global miRNA expression profiling platforms for detection of less abundant miRNAs. BMC Genomics. 2011;12:435.
- Jang JS, Simon VA, Feddersen RM, et al. Quantitative miRNA expression analysis using fluidigm microfluidics dynamic arrays. BMC Genomics. 2011;12:144.
- Chen C, Ridzon DA, Broomer AJ, et al. Real-time quantification of microRNAs by stem–loop RT–PCR. Nucleic Acids Res. 2005;33:e179–e.
- Almasy L, Blangero J. Multipoint quantitative-trait linkage analysis in general pedigrees. Am J Hum Genet. 1998;62:1198–1211.
- Benjamini Y, Hochberg Y. Controlling the false discovery rate: a practical and powerful approach to multiple testing. J Royal Stat Soc Ser B (Methodological). 1995;57:289–300.
- Levy D, Ehret GB, Rice K, et al. Genome-wide association study of blood pressure and hypertension. Nat Genet. 2009;41:677–687.
- Li Y, Willer CJ, Ding J, et al. MaCH: using sequence and genotype data to estimate haplotypes and unobserved genotypes. Genet Epidemiol. 2010;34:816–834.
- Agarwal V, Bell GW, Nam J-W, et al. Predicting effective microRNA target sites in mammalian mRNAs. elife. 2015;4:e05005.
- Enright AJ, John B, Gaul U, et al. MicroRNA targets in Drosophila. Genome Biol. 2003;5:R1.
- Burgess S, Butterworth A, Thompson SG. Mendelian randomization analysis with multiple genetic variants using summarized data. Genet Epidemiol. 2013;37:658–665.
- Willer CJ, Schmidt EM, Sengupta S, et al. Discovery and refinement of loci associated with lipid levels. Nat Genet. 2013;45:1274.
- Hemani G, Zheng J, Elsworth, B, et al. The MR-Base platform supports systematic causal inference across the human phenome. Elife. 2018;7:e34408.
- Ernst J, Kheradpour P, Mikkelsen TS, et al. Mapping and analysis of chromatin state dynamics in nine human cell types. Nature. 2011;473:43.