
ABSTRACT
Precision toxicology evaluates the toxicity of certain substances by isolating a small group of cells with a typical phenotype of interest followed by a single cell sequencing-based analysis. In this in vitro attempt, ochratoxin A (OTA), a typical mycotoxin and food contaminant, is found to induce G0/G1 phase cell cycle arrest in human renal proximal tubular HKC cells at a concentration of 20 μM after a 24h-treatment. A small number of G0/G1 phase HKC cells are evaluated in both the presence and absence of OTA. These cells are sorted with a flow cytometer and subjected to mRNA and DNA methylation sequencing using Smart-Seq2 and single-cell reduced-representation bisulfite sequencing (scRRBS) technology, respectively. Integrated analysis of the transcriptome and methylome profiles reveals that OTA causes abnormal expression of the essential genes that regulate G1/S phase transition, act as signal transductors in G1 DNA damage checkpoints, and associate with the anaphase-promoting complex/cyclosome. The alteration of their DNA methylation status is a significant underlying epigenetic mechanism. Furthermore, Notch signaling and Ras/MAPK/CREB pathways are found to be suppressed by OTA. This attempt at precision toxicology paves the way for a deeper understanding of OTA toxicity and provides an innovative strategy to researchers in the toxicology and pharmacology field.
Introduction
The common mycotoxin, OTA, is a secondary metabolite produced by several species of Aspergillus and Penicillium. It is responsible for a wide range of toxicological effects including nephrotoxicity, hepatotoxicity, and carcinogenicity (classified as a possible human carcinogen by IARC in 1993) [Citation1–Citation3]. The primary target organ of OTA is the kidney, predominantly causing damage to the proximal tubule [Citation4]. Due to its ubiquitous presence in a variety of foodstuffs commonly found in every-day life, it is impossible to avoid OTA completely. Therefore, to understand the underlying mechanisms of OTA toxicity and to determine appropriate detoxification and control measures is essential to human and animal health.
Reported mechanisms of OTA induced toxicity include inhibiting the energy metabolism, inducing oxidative stress and apoptosis and more [Citation5,Citation6]. Among these, inducing cell cycle arrest is especially significant. Liu found that OTA induced oxidative DNA damage and G1 phase arrest in human peripheral blood mononuclear cells [Citation7], while Yang and colleagues discovered that OTA was also able to cause S phase arrest in HEK 293 cells [Citation8]. Additionally, Wang et al. observed that OTA induced G2 phase arrest in human gastric epithelial cells [Citation9]. Therefore, OTA is believed to induce cell cycle arrest following various patterns in diverse circumstances, and the underlying mechanism deserves further investigation. Moreover, OTA induced epigenetic changes such as its effect on DNA methylation, is attracting increased attention from researchers [Citation10]. However, whether DNA methylation plays a role in OTA induced cell cycle arrest requires verification.
Since early 2010, the rapid development of single-cell sequencing promoted considerable progress in various fields including biology and medicine. By applying single-cell sequencing to the area of toxicology, this study introduced the concept of ‘precision toxicology.’ This term refers to the activity of chemical or drug-induced toxicity that can be sensitively and explicitly investigated by isolating a small group of cells or even a single cell with typical phenotype of interest, followed by a single cell sequencing-based analysis [Citation11]. Single cell transcriptome sequencing techniques such as Smart-Seq2 offer comprehensive information on gene expression dynamics in the selected cells [Citation12]. Single-cell DNA methylome sequencing using methods such as scRRBS allows epigenetically functional states of individual cells to be analyzed [Citation13].
In this study an innovative in vitro attempt at precision toxicology was made to probe the mechanisms of OTA induced cell cycle arrest in human renal proximal tubular HKC cells. First, the effect of OTA on cell cycle distribution and the expression of the predominant mammalian DNA methyltransferase, DNMT1, were analyzed using a flow cytometer. To avoid cell heterogeneity to some degree and to retain correspondence with the number of laser-captured rat renal proximal tubular cells in another in vivo study (data not published), 20 cells were sorted under each cell cycle phase. This process was conducted with and without OTA treatment at an IC50-approximate dose for small-number-cell RNA (sncRNA) and small-number-cell RRBS (sncRRBS) library construction, respectively. After sequencing, the differentially expressed or methylated genes were identified. Pivotal genes that were contributing to OTA induced cell cycle arrest and signaling pathways which might be hardly detectable when using bulk cells were ascertained by the integrated analysis of transcriptome and methylome profiles.
Results
OTA induced G0/G1 phase arrest in HKC cells
The HKC cells were treated with different concentrations (0 μM, 5 μM, 10 μM, 20 μM, and 40 μM) of OTA for 24 h before conducting the cell cycle distribution analysis. In the absence of OTA, cells at the G0/G1 phase constituted around 63.11% of the total cells in the control group (labeled as group CK). As shown in , flow cytometric analysis indicated that treatment with OTA resulted in a statistically significant G0/G1 phase arrest. When treated with 20 μM OTA, an IC50-approximate dose to HKC cells [Citation14], increased the percentage of cells under G0/G1 phase to 79.11%, while 40 μM OTA caused an increase to 81.50%. Moreover, the G0/G1 phase arrest was confirmed by the imaging flow cytometer as shown in . A 20 μM OTA treatment at an IC50-approximate dose was chosen to induce significant G0/G1 phase arrest for further methylome and transcriptome profiling (labeled as group OTA) to investigate the underlying mechanisms.
Figure 1. OTA inhibited the cell cycle progression of HKC cells. (A) Semiquantitation of the diploid analysis by flow cytometry. HKC cells were treated with 0 μM, 5 μM, 10 μM, 20 μM, and 40 μM OTA for 24 h, respectively. The values were expressed as the mean ± SD for three biological replications. Different lowercase letters indicate significant differences (p < 0.05). (B) Cell cycle histograms of cells exposed to 5 μM, 10 μM, 20 μM, and 40 μM OTA or to serum-free medium as a CK for 24 h, respectively. Data are shown for one representative experiment.
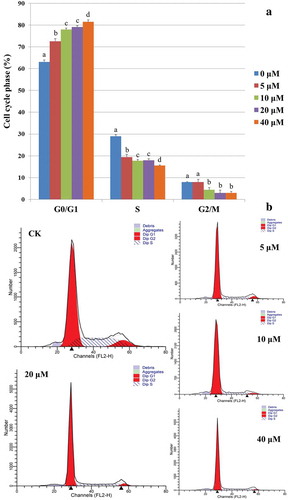
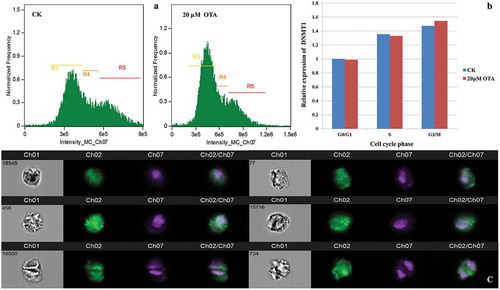
Figure 2. Single cell immunofluorescence revealed an increased expression of DNMT1 corresponded to the DNA content during cell cycle progression in HKC cells. (A) Three gates based on DNA content (intensity of Ch07) were set. R3, R4, and R5 represent the G0/G1, S, G2/M phase, respectively. (B) Semiquantitation of the DNMT1 expression in each cell cycle phase and each group was obtained using the IDEAS analysis software. Each calculated mean value was normalized with that of G0/G1 phase of CK, representing a relative expression level. The resulting ratio in the G0/G1 phase of CK was normalized to 1. (C) The visualization of DNMT1 expression in randomly selected single cells. Images in channel 01 (Ch01) were captured in the wild field. Signals from Alexa Fluor 488 and Hoechst 33,342 were captured in Ch02 and Ch07, respectively. Merged images are shown in Ch02/Ch07. Representative cells in the left lane are from group CK: No. 18,545 at G0/G1, No. 456 at S, and No. 18,500 at G2/M phase, respectively. Representative cells in the right lane are from group OTA: No. 77 at the G0/G1, No. 15,716 at S, and No. 734 at G2/M phase, respectively.
The expression of DNMT1 corresponded with the DNA content in HKC cells during cell cycle progression
The predominant mammalian DNA methyltransferase, DNMT1, is primarily responsible for copying methylation patterns during replication and is sufficient to maintain both global methylation and aberrant CpG island methylation [Citation15,Citation16]. Therefore, the expression of DNMT1 was detected in each HKC cell with and without the 20 μM OTA treatment during the cell cycle progression using single cell immunofluorescence. Twenty thousand cells were acquired from group CK, and OTA respectively using the imaging flow cytometer. Three gates were set based on the DNA content representing the G0/G1, S, and G2/M phase, respectively. The intensity of the Alexa Fluor 488 (Ch02), which was conjugated with the anti-DNMT1 antibody, represented the expression level of DNMT1 and was calculated using the IDEAS analysis software. indicated that the expression level of DNMT1 increased in the S phase and the G2/M phase in both CK and OTA cells compared with that in the G0/G1 phase. Furthermore, correspondence with the DNA content was evident. This may be an indication that DNMT1 is necessary to maintain global methylation and aberrant CpG island methylation during and after DNA replication. The expression of DNMT1 in representative single cells is illustrated in . The calculated intensity revealed that OTA did not induce significant changes in the expression of DNMT1, which might infer that OTA barely affected the global DNA methylation level in HKC cells.
OTA barely impacted global DNA methylation but caused the methylation state alteration of specific genes
sncRRBS was performed to investigate the relationship between DNA methylation and OTA induced G0/G1 phase arrest in HKC cells. Summary align information, including the mapping rate and conversion rate of 12 samples (2 biological replications in each cell cycle phase of group CK and OTA, labeled as CK_G1_1, CK_G1_2, CK_S_1, CK_S_2, CK_G2_1, CK_G2_2, OTA_G1_1, OTA_G1_2, OTA_S_1, OTA_S_2, OTA_G2_1, and OTA_G2_2, respectively) is shown in Table S1 in the supplementary materials. In the following analysis the study focused on the comparison between cells at the G0/G1 phase of the two groups.
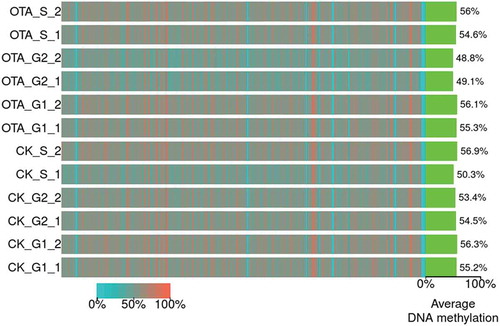
As shown in , the average global DNA methylation levels of the 12 samples ranged from 48.8% to 56.9%. No significant changes were evident due to similar average levels across the entire genome, specifically in the G0/G1 phase which was the focus of the research. The average DNA methylation levels of CK_G1_1 and CK_G1_2 were 55.2% and 56.3%, respectively. Following OTA treatment, the levels of OTA_G1_1 and OTA_G1_2 displayed respective levels of 55.3% and 56.1%, exhibiting no significant changes.
Figure 3. The heatmap for the bin-wise mC levels. Color indicates the average methylation levels in bins across the entire genome (bin size: 5M bp). Green bars on the right indicate the global average DNA methylation levels of each sample.
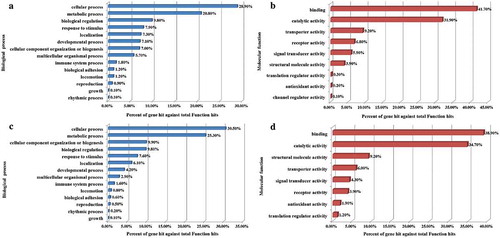
However, 3294 DMRs were found between the cells at the G0/G1 phase of the two groups, as depicted in . Of these, 12.25% belonged to the promoter and 87.75% belonged to the distal intergenic regions. Moreover, 2334 DMGs were identified as related to the DMRs, of which 1708 were up-regulated, and 626 were down-regulated. The functional classification of these genes is detailed in . The genes were cataloged according to GO biological processes () and molecular functions () using the PANTHER classification system. As illustrated by , the biological processes could be divided into 14 categories, with the top five being the cellular process (28.90%), the metabolic process (20.80%), biological regulation (9.80%), response to stimulus (7.90%), and localization (7.30%). The molecular functions were grouped into nine categories, as shown in , with the top five being, binding (41.70%), catalytic activity (31.90%), transporter activity (9.20%), receptor activity (6.80%), and signal transducer activity (5.90%).
Figure 4. Overview of the DMR and DMG. (A) Venn diagram showing the numbers of DMRs and DMGs. The numbers of up-regulated and down-regulated DMGs were shown above and below the middle line, respectively. (B) Pie chart showing the percentage of the genomic locations of the DMR candidates.
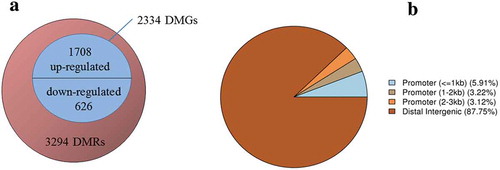
Figure 5. Functional classification of identified DMGs and DEGs as a result of OTA treatment. The GO biological processes (A) and molecular functions (B) of the DMGs, while biological processes (C) and molecular functions (D) of DEGs were categorized using the PANTHER classification system.
The sncRNA-seq produced substantial results corresponding with the methylome profiling
Interestingly, results produced by the transcriptome profiling corresponded significantly with the methylome profiling, especially the classifications related to the biological processes (BP) and molecular functions (MF). A total of 2130 significant DEGs included 1238 that were up-regulated and 892 that were down-regulated. These DEGs were classified into 14 BPs and eight MFs and are illustrated by ,D. The top five BPs included the cellular process (30.50%), the metabolic process (25.30%), cellular component organization or biogenesis (9.90%), biological regulation (9.80%), and response to stimulus (7.60%). The top five MFs referred to the binding (38.90%), catalytic activity (34.70%), structural molecule activity (9.20%), transporter activity (6.00%), and signal transducer activity (4.30%).
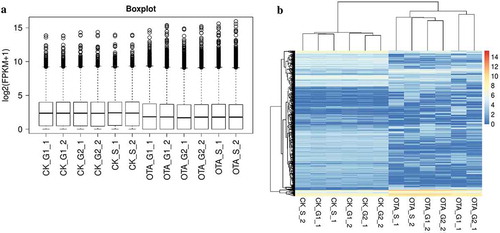
The overall align information of the 12 samples is outlined in Table S2. The distribution of FPKMs in all the samples is shown in , indicating a similar expression level between specimens. It was evident from the unsupervised hierarchical clustering shown in that OTA treatment indeed affected the general transcription of HKC cells, while the transcription profile seemed conservative to some degree in different cell cycle phases.
Figure 6. Overview and unsupervised hierarchical clustering of FPKMs across all 12 samples in the two groups. (A) Boxplot of log2(FPKM+1) showing the distribution of FPKMs across all the samples. (B) Unsupervised hierarchical clustering heatmap. A total of 5009 genes were used for clustering, selected by 1< maximum FPKM<15 and the standard deviation of log2(FPKM+1)>1.
Hypermethylation and down-regulated expression of several key genes contributed to the G0/G1 phase arrest
Cell cycle progression related genes which were altered in both the methylome and transcriptome profiling were identified. It is believed that the hypermethylation will inhibit gene expression while hypomethylation will facilitate this process [Citation17,Citation18]. According to this rule 19 genes were identified that fit this pattern, as summarized in . Among the 19 genes, nine were reported to be directly related to G0/G1 phase arrest: five of these genes (CCND2, UBE2E2, LSM10, PTEN, and NACC2) play a significant role in G1/S phase transition, two genes (E2F8 and ARID3A) function as signal transductors involved in the G1 DNA damage checkpoint, while the remaining two (CDC16 and FZR1) are associated with the anaphase-promoting complex/cyclosome (APC/C). CCND2 is a vital member of cyclins that phosphorylates and inhibits members of the retinoblastoma (RB) protein family, therefore promoting the transition from the G1 phase of the cycle to the S phase [Citation19]. UBE2E2 belongs to the UBE2E family of ubiquitin-conjugating enzymes which accepts ubiquitin from the E1 complex and catalyzes its covalent attachment to other proteins. Furthermore, it positively regulates the G1/S transition of the cell cycle [Citation20]. LSM10 is part of the U7 small nuclear ribonucleoprotein complex (U7 snRNP), required for cell cycle progression from G1 to S phases due to its importance in histone pre-mRNA processing [Citation21]. PTEN is a tumor suppressor acting as a dual-specificity protein phosphatase, and was found to block cell cycle progression in the G1 phase by negatively regulating the PI3k/Akt signaling pathway [Citation22]. NACC2 functions as a transcriptional repressor through its association with the NuRD complex, which subsequently regulates the p53 pathway [Citation23]. The transcription factor E2F8 also played a transcriptional repression role in the G1 phase [Citation24]. ARID3A is a transcription factor which may be involved in the control of cell cycle progression through the RB1/E2F1 pathway [Citation25]. CDC16 and FZR1 are related to the anaphase APC/C, a cell cycle-regulated E3 ubiquitin ligase that controls progression through mitosis and the G1 phase of the cell cycle; CDC16 is a component of APC/C while FZR1 activates the APC/C in late mitosis and contributes to the establishment of a stable G1 state [Citation26,Citation27]. Interestingly, except for PTEN that was hypomethylated and up-regulated, playing a negative role in G1/S phase transition, all of the remaining eight genes exhibited the same altering trend involving hypermethylation and down-regulated expression.
Table 1. List of cell cycle progression related genes which altered in both the methylome and transcriptome profiling after OTA treatment.
Moreover, an additional two cell cycle regulators and three ubiquitin-protein ligase activity regulators were identified. GAS7 is a growth arrest-specific protein that reportedly regulates cell cycle arrest and inhibits cell growth [Citation28]. MISP is ostensibly required for proper spindle orientation and mitotic progression. Therefore, the depletion of MISP causes mitotic arrest with reduced tension in sister kinetochores, chromosome misalignment and spindle multipolarity [Citation29]. The genes regulating the ubiquitin-protein ligase activity were all part of the proteasome 26S subunit (PSMC1, PSMD9, PSMB2). The 26S proteasome is a multiprotein complex involved in the degradation of ubiquitinated proteins, playing a vital role in the maintenance of protein homeostasis by removing misfolded or damaged proteins, as well as proteins whose functions are no longer required in the cell cycle progression [Citation30]. Among the remaining five genes, CDT1 was involved in the spindle assembly checkpoint, while the others played a part in G2/M transition (AURKA, CDC7, PHLDA1, NINL).
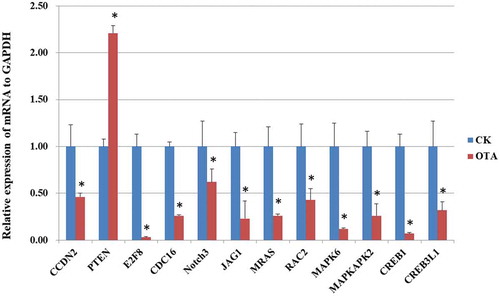
We further validated the mRNA expression of several selected genes by PCR, as shown in . The PCR results shared a similar alteration trend with the RNA-seq results, indicating its reliability.
Figure 7. PCR validation of the mRNA expression of selected DEGs. * indicates significant differences (p < 0.05).
Pathway enrichment by combining transcriptome and methylome profiling further provided evidence that OTA suppressed Notch signaling and the Ras/MAPK/CREB pathway in HKC cells
Cell cycle arrest is one of the mechanisms of OTA induced renal toxicity. To achieve further pathway enrichment, the two profiles were integrated to uncover additional evidence that might have gone unnoticed during the use of the bulk materials. Pivotal pathways based on PANTHER, as well as the Metascape database, are shown in . OTA treatment had a restraining influence on Notch signaling, Ras signaling, as well as both the MAPK and CREB pathways. Intriguingly, these pathways are all reported to regulate cell growth, cell cycle, and cell proliferation, in addition to displaying crosstalk between one another.
Table 2. Signaling pathways enriched by integrated analysis of DMGs and DEGs after OTA treatment.
According to the transcriptomic results, the expression of several important genes in the Notch pathway was dysregulated due to the induction of OTA, including NOTCH3, JAG1, RFNG, NCOR2, and NFKBIA. NOTCH3 is a vital Notch receptor, and JAG1 is a crucial ligand. Both are core components of Notch signaling because the activation of this pathway initiates from the binding of the ligands with the receptors [Citation31]. RFNG is a Notch glycosyltransferase, enhancing Notch receptor binding to their ligands such as DLLs and JAGs [Citation32]. NCOR2, a transcriptional corepressor, also exhibits Notch binding ability [Citation33]. Down-regulation of these four genes by OTA indicated a high possibility of Notch pathway restriction. NFKBIA, which has a negative impact on the Notch signaling pathway according to the UniProt database [Citation34], was up-regulated in its transcriptional level. Furthermore, RFNG, NCOR2, and NFKBIA were found in the DMG list corresponding with their transcriptional alteration, while the methylation state of NOTCH3 and JAG1 did not show a significant change.
Another area where OTA significantly affected signaling with an inhibiting trend is the Ras/MAPK/CREB pathway. First, the expression of RASAL2, an inhibitory regulator of the Ras [Citation35], was up-regulated by OTA. Correspondingly, the Ras-related protein MRAS and two Ras-related C3 botulinum toxin substrates, RAC2 and RAC3, were found to be dysregulated in the DEG list. Then, decreased expression of mitogen-activated protein kinases MAPK1 and MAPK6, and MAP kinase-activated protein kinase 2 (MAPKAPK2), were observed in the transcriptome profiling. Moreover, DUSP10, a MAPK negative regulator, was found to have up-regulated, which immobilizes MAPK activity by p38 dephosphorylation [Citation36]. The expressions of downstream cyclic AMP-responsive element-binding proteins including CREB1 and CREB3L1, transcription factors that regulate the cellular responses to growth factor stimulation, were also found to have decreased [Citation37,Citation38]. Furthermore, CREBRF, a negative regulator repressing the transcriptional activity of CREB3 during the endoplasmic reticulum stress [Citation39], was up-regulated. However, DNA methylation seemed to have a limited role in this pathway crosstalk according to the DMGs. The hypermethylation of MRAS, RAC2, RAC3, MAPK6, and CREB1 might account for their decrease in expression to some extent, while the dysregulation of the other genes was not related to DNA methylation.
Discussion
One core idea of precision toxicology is to select a small number of cells or even a single cell with a specific phenotype of interest for further investigation, that is, to obtain more suitable and accurate experimental materials [Citation11]. This study focused on OTA induced G0/G1 phase cell cycle arrest. The isolation of a small number of cells at the G0/G1 phase enabled this research to purposefully probe the mechanisms which underlie OTA induced arrest. Furthermore, using cells from the G0/G1 phase with and without OTA treatment for comparison can avoid the undesired biological alterations caused by cell cycle progression to some extent, and provide more convincing results. For example, increased expression of essential cell cycle-related genes during DNA replication at the S phase might be detected if bulk phase-mixed cells are used to evaluate OTA toxicity, which could not be attributed entirely to OTA. Setting a filter at the G0/G1 phase provided the research objects with the same status as the corresponding DNA content, making this precision toxicology attempt more exact.
Taking advantage of single cell sequencing-based technologies, this study probed possible OTA induced alterations at both gene expression and epigenetic modification levels in the G0/G1 phase arrested HKC cells. These cells were the main toxicological target when OTA was retained in the proximal renal tubules. In 2013 Picelli and colleagues described the Smart-seq2, a single cell full-length transcriptome profiling method [Citation12]. Since its development, this method has been widely applied due to its high sensitivity and accuracy, as well as the low number of technical biases associated with it [Citation40]. A superior but cost-effective alternative technique for single cell methylome dissection is scRRBS. During this process mammalian genomic DNA is cut into short fragments using a restriction enzyme that recognizes CpG and its flanking sequences. Therefore, a large proportion of the informative CpG sites, including most of the CpG islands and promoters, will be recovered and sequenced with high coverage even with relatively low numbers of total sequencing reads [Citation41].
The application of integrated single-cell assay strategies, such as the combination of the single cell transcriptome and epigenome, has become a trend in many areas such as biology and medicine in order to provide a more precise and correlated understanding of factors contributing to cellular functions and dysfunctions [Citation11,Citation42,Citation43]. Single cell multi-omic conjoint analysis not only examines the relationship between the genotypic and phenotypic characteristics of the single cell but also discloses the combined regulatory mechanisms that are evident at single-cell resolution [Citation44].
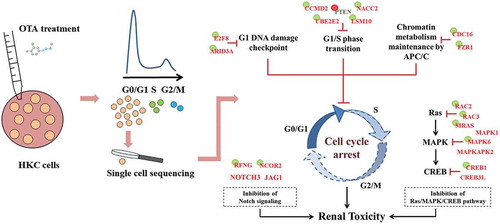
This research employed Smartseq2 and scRRBS technologies to further investigate the underlying epigenetic mechanism of OTA induced G0/G1 cell cycle arrest in a small number of HKC cells in this phase. The two-dimensional joint analysis allowed the essential dysregulated genes to be narrowed down to a hypothetical model, as shown in . Nine important genes were found to be directly related to OTA induced HKC G0/G1 phase arrest. These genes can be divided into three groups according to their functions: regulating G1/S phase transition (CCND2, UBE2E2, LSM10, PTEN and NACC2), signal operation at the G1 DNA damage checkpoint (E2F8 and ARID3A), and modulating APC/C activity (CDC16 and FZR1). Of these genes, only the inhibitory regulator of the G1 phase, PTEN, was found to be up-regulated, while the others were down-regulated as a result of OTA treatment. Hypomethylation of PTEN and hypermethylation of the other genes accounted for their aberrant expression and further confirmed the involvement of DNA methylation alteration in OTA induced G0/G1 phase arrest.
Figure 8. A hypothetical mode of action for OTA-induced G0/G1 cell cycle arrest in HKC cells. The key down-regulated genes were shown in red while up-regulated genes were shown in green. Genes with a green circle represented its DNA hypermethylation while red circle represented the DNA hypomethylation.
Inhibiting cell proliferation via cell cycle arrest is a critical mechanism of OTA induced renal toxicity. Additionally, this in vitro attempt at precision toxicology further revealed several potential pathways underlying its toxicological impact. One intriguing pathway that remained undisclosed when using bulk samples is the Notch pathway. Notch is a transmembrane receptor that mediates cell to cell communication and coordinates a signaling cascade present in all animal species studied to date [Citation31]. Notch signaling controls numerous cell-fate specification events in multicellular organisms, and dysregulated Notch signaling causes several diseases with underlying developmental defects [Citation45]. Core elements of the Notch signaling system include the Notch receptor, DSL ligands, CSL transcriptional cofactors, and downstream target genes. Moreover, upon binding with the ligand, the Notch signaling converts CSL from a transcriptional repressor into a transcriptional activator [Citation46]. During this study, an important receptor, NOTCH3, and an important ligand, JAG1, were both down-regulated as a result of OTA treatment, indicating the suppression of Notch signaling. Furthermore, OTA modified the DNA methylation status of RFNG and NCOR2, which might account for their down-regulated expression, providing further evidence of the inference. Few OTA studies have directly focused on this pathway. However, supportive evidence from previous research revealed that the Notch pathway play a role in OTA induced toxicity. The study of Zurich et, al., found that OTA perturbed the homeostasis of neural stem cells at nanomolar concentrations [Citation47]. Therefore, after a 12 hour treatment with 10 nM OTA, the relative mRNA expression levels of two effectors in the Notch pathway, Hes1, and Hes5, were significantly decreased in rat brain cell cultures. Through ChIP-Seq analysis, Limbeck and colleagues identified H3K9 acetylation at promoter regions of NOTCH1 in human proximal tubular cells after treatment with 25 µM OTA for 24 h. This indicated a novel epigenetic mechanism of Notch signaling suppression, contributing to its renal toxicity [Citation48].
Another OTA disturbed pathway was MAPK. MAPKs are evolutionarily conserved serine/threonine kinases that regulate diverse cellular programs such as cell proliferation, cell survival, and adaptation. This process is based on cues derived from the cell surface and the metabolic state of the cell, as well as response to environmental stresses [Citation49]. Previous studies found that the MAPK pathway played a complicated role in OTA induced toxicology. On the one hand, the MAPK pathway was activated in response to OTA to enhance cell survival, while on the other, the switch of MAPKs and downward genes contributed to its toxicological effects [Citation5,Citation9,Citation50]. The suppression of several MAPKs’ expression was observed from the results of this study. These included MAPK1, MAPK6, and MAPKAPK2. Furthermore, the potential upstream and downstream genes of the dysregulated MAPKs were also identified by sncRNA-seq, which was not evident from previous bulk sample research. Ras proteins are small guanosine nucleotide-bound GTPases, which are essential mediators in signaling pathways that convey extracellular stimuli from cell surface receptors to the cell [Citation51,Citation52]. The Ras/MAPK pathway is essential in the regulation of the cell cycle, growth, and cell senescence. Results indicated a down-regulation in the expression of RAC2, RAC3, and MRAS, which might be attributed to their DNA hypermethylation, and was corresponded with the suppressing trend of MAPKs. The downstream target, CREB phosphorylation, and activation, was mediated by the Ras/MAPK pathway [Citation38], and the sncRNA-seq revealed the repression of CREB1 and CREB3L1. Therefore, a hypothesis was proposed that OTA affected the Ras/MAPK/CREB pathway. Therefore, the sensitivity of precision toxicology was exhibited since it was found in a small number of cells rather than in the bulk sample.
From this in vitro attempt, several challenges regarding the application of single-cell sequencing in toxicological research were noted. The first involved a proper determination of the number of phenotypes representing cells used for sequencing and biological replications, since both the heterogeneity and biological significance should be taken into consideration. Therefore, a case-by-case principle was preferred when choosing the number of suitable cells, since a cohesive standard could not be compromised considering the diverse toxicological targets. A range from one single cell to a small scale was acceptable as long as it was practical. Despite the experimental cost, higher throughput of the samples consistently produced more convincing results. Another challenge involved the validation of the hypothesis. In traditional toxicological mechanism exploration, the proposed hypothesis derived from the sequencing results is usually verified at the protein level by further gene editing intervention. However, presently this is difficult to achieve at single-cell resolution. Fortunately, single cell-based technologies are developing rapidly leading to advances such as single cell proteomics and single cell gene editing [Citation43,Citation53,Citation54]. These breakthroughs indicate that the current obstacles presented by single cell multi-omic analysis might soon be a thing of the past, retaining its viability and potential in the toxicology and pharmacology field.
Materials and methods
Cell culture and treatment
The human renal proximal tubular cell line HKC was purchased from the China Infrastructure of Cell Line Resources and was grown in Dulbecco’s Modified Eagle’s Medium (DMEM) (Solarbio, China) supplemented with 10% fetal bovine serum (FBS) (HyClone, USA), 100 U/mL penicillin, 100 mg/mL streptomycin, 250 ng/mL amphotericin B (Macgene, China), 2 mM L-Glutamine (Sigma, USA), and 1% MEM Nonessential Amino Acids (Macgene, China) at 37°C in 5 % CO2 and 95% saturated atmospheric humidity. At approximately 80% confluence, the cells were treated with different concentrations (0 μM, 5 μM, 10 μM, 20 μM, and 40 μM) of OTA for 24 h.
Cell cycle analysis and cell sorting
Cell cycle analysis was conducted according to the method of Yang et al [Citation55], with slight modifications. Briefly, cells were cultured and synchronized before OTA treatment, then harvested in PBS-0.05% trypsin buffer at the end of the treatment. After centrifugation for 5 min at 1500 rpm at 4°C, the supernatant was removed, and the pellet was re-suspended in ice-cold 70% ethanol. After centrifugation for 5 min at 1500 rpm at 4°C, the pellet was treated with 2 mg/ml RNase A at 37°C for 20 min and stained with 50 g/ml PI containing 0.1% Triton X-100 and 0.02 mg/ml EDTA. After staining, the DNA content and cell cycle distribution were determined using a FACSCalibur flow cytometer (BD Biosciences, USA), 10,000 cells were acquired for each sample. The data were analyzed using the ModFit software.
For cell sorting, the HKC cells were treated with 20 μM OTA, or serum-free medium as a control, for 24 h. The subsequent cell preparation for sorting closely resembled that used for the cell cycle analysis mentioned above, except for omitting the RNase A digestion step due to the need for RNA sequencing. Cell sorting was achieved using a FACSAria Sorp flow cytometer (BD Biosciences, USA). Three gates were established based on the DNA content, which represented the G0/G1, S and G2/M cell cycle phases, respectively (Fig. S1). Twenty cells in each gate were then collected as one sample for further sncRRBS-seq or sncRNA-seq.
Immunofluorescence, single-cell imaging and quantification of DNMT1 expression
The expression of the crucial methyltransferase DNMT1 in different cell cycle phases was visualized using an immunofluorescence assay with the help of single cell imaging. After OTA treatment, the HKC cells were washed with Wash Buffer (2% FBS/PBS) and fixed in 100 µL Fixation Buffer (4% PFA/PBS) for 10 min at 25°C. This process was followed by a single wash with Wash Buffer and re-suspended in 100 µL PermWash Buffer (0.1% triton X-100/2% FBS/PBS) containing a 1:500 Alexa Fluor 488 conjugated anti-DNMT1 antibody (Abcam, ab197272), and incubated at 25°C for 40 min. The cells were washed twice with PermWash Buffer, and re-suspended in 100 µL PermWash Buffer containing 1:10,000 Hoechst 33,342 (Beyotime, China) at 25°C for 15 min. The cells were washed twice more with Wash Buffer, re-suspended in 100 µL Wash Buffer, and run directly on ImageStreamX Mark II Imaging Flow Cytometer (Amnis Merck Millipore, USA) in 0.6 mL microcentrifuge tubes for single cell imaging, 20,000 cells were acquired for each sample.
The quantification of the DNMT1 expression in every cell was achieved using the IDEAS analysis software (Amnis Merck Millipore, USA). Compensation settings for all analyses were set on single-color controls for the antibody and fluorochrome, as well as the unlabeled control. The optical signals of the Alexa Fluor 488 and Hoechst 33,342 were captured in channel 02 (Ch02) and channel 07 (Ch07), respectively. Different cell cycle phases could be gated based on the Ch07 intensity which indicated the DNA content of every cell. Therefore, the mean Ch02 intensity in each gate could be calculated by the software, which indicated the relative expression level of DNMT1 at each phase. The calculated mean value of each phase in the individual samples was normalized with that of G0/G1 phase of CK.
SncRRBS library preparation, sequencing, and data analysis
RRBS libraries were constructed of a small number of HKC cells following the protocol of Guo et al [Citation41]. Briefly, 20 cells with and without 20 μM OTA treatment at each cell cycle phase were sorted into a tube with 5 μL cell lysis buffer which contained protease to release the genomic DNA. Each of the six groups had two biological replicates. The next three steps, including the MspI digestion, the end repair/dA tailing, and the adapter ligation, were accomplished by adding the corresponding reaction components sequentially, while the enzymes in the preceding reactions were deactivated by heating. Tango buffer was used for all the reactions. The ligation was achieved by overnight incubation using the premethylated sequencing adapters and highly concentrated T4 DNA ligase. The ligated DNA fragments were directly processed until bisulfite conversion was attained, and only after this step was the DNA purified in the presence of carrier tRNA. Next, the DNA was PCR-amplified, and the fragments between 200 bp and 700 bp were gel-selected and purified as the final library for sequencing. A 150-bp pair-end sequencing was performed on an Illumina HiSeq X Ten platform.
After sequencing, the raw reads were trimmed to remove low-quality bases and adaptor sequences. They were subsequently mapped to the human reference genome (hg19, downloaded from the UCSC genome browser) using BS-Seeker2 (v2.1.1) (parameter: -m 0.06) using the bowtie mode [Citation56] where two mates were mapped separately for the paired-end sequencing data. Additionally, the lambda DNA genome was rebuilt as an extra reference for later by calculating the bisulfite conversion rate of each sample. The bulk methylation levels were analyzed for cytosine sites with ≥ 10X in each sample using CGmapTools [Citation57]. CGmapTools was used to generate a heatmap indicating the average methylation levels of CG in bins across whole genomes (bin size, 5,000,000 bp). Furthermore, the differentially methylated region (DMR) analysis was carried out by CGmapTools using a dynamic region strategy. The differentially methylated regions related genes (DMG) were further analyzed based on GO biological processes and molecular functions using the PANTHER classification system (http://www.pantherdb.org/) [Citation58].
SncRNA library preparation, sequencing, and data analysis
A modified Smart-seq2 transcriptome protocol was applied in single cells for the construction of RNA libraries of a small number of HKC cells [Citation40]. Briefly, 20 cells with and without the 20 μM OTA treatment at each cell cycle phase, were sorted into a tube with 5 μL cell lysis buffer. The solution contained a ribonuclease inhibitor that stabilized the RNA and prevented its degradation. Each of the six groups had two biological replicates. Additionally, the lysis buffer contained free dNTPs and tailed oligo-dT oligonucleotides (30-nt poly-dT stretch and a 25-nt universal 5ʹ anchor sequence) that were responsible for the priming of the reverse transcription reaction on the polyadenylated RNA sequences. Following the first-strand synthesis using SuperScript II reverse transcriptase (Invitrogen), the double-stranded cDNAs were synthesized and amplified by 16 PCR cycles. After purification with AMPure XP beads (Beckman Coulter), 300 ng cDNA was sheared to approximately 300 bp by a Covaris S2. The RNA-seq library was constructed using a Kapa Hyper Prep Kit (Kapa Biosystems) and subjected to 150 bp paired-end sequencing on an Illumina HiSeq X Ten platform.
After sequencing, all reads passed filter and were trimmed to remove low-quality bases and adaptor sequences. The reads were then aligned to the hg19 reference genome using tophat2 (v2.0.13) [Citation59], while reads that were aligned to genes were counted by Cufflinks (v2.2.1) [Citation60]. The FPKMs were normalized using Cuffnorm, while Cuffdiff was employed to calculate the DEG. Unsupervised hierarchical clustering was carried out on log2(FPKM+1) across samples. Clustering was achieved by using 5009 genes, selected by 1< maximum FPKM<15 and the standard deviation of log2(FPKM+1)>1. Further analysis of the DEG was based on GO biological processes and molecular functions using the PANTHER classification system (http://www.pantherdb.org/). The signaling pathways associated with both DMG and DEG were classified according to PANTHER, as well as the Metascape database (http://metascape.org) [Citation61].
The expressions of selected representative DEGs were further validated by realtime-PCR as previously described [Citation2], the primers used were designed by searching PrimerBank [Citation62], which can be found in .
Table 3. Gene specific primers used in real-time qPCR analysis.
Statistical analysis
Microsoft Excel 2010 and SPSS 13.0 were used for the statistical analyses. Data were subjected to an analysis of variance (ANOVA), and a comparison of means was conducted via Duncan’s multiple-range test. The differences were considered statistically significant for p values <0.05.
Author contributions
W.X. and K.H. conceived the study and supervised the work. B.Z. performed all the experiments and wrote the paper. L.Z. provided help during cell culture and single cell acquisition. Y.D. and H.L. provided help during library construction. Y.L. gave advices during data analysis.
Supplemental Material
Download MS Word (109.3 KB)Acknowledgments
This work was financially supported by the National Special Program of Transgenic Research (Grant No. 2016ZX08011-005). As a visiting student at the University of Pennsylvania, B. Z. was partially supported by the China Scholarship Council. We sincerely thank James Eberwine for the inspiration; thank you to Yu Hou from Peking University for instructions and advice on single-cell sequencing, and Fei Wang from the National Center for Protein Sciences at Peking University for assistance with the cell sorting. We also want to thank Geek Gene Beijing for their technical support.
Disclosure statement
No potential conflict of interest was reported by the authors.
Supplementary material:
Supplemental data for this article can be accessed here.
Additional information
Funding
Related Research Data
References
- Pfohl-Leszkowicz A, Manderville RA, Ochratoxin A. An overview on toxicity and carcinogenicity in animals and humans. Mol Nutr Food Res. 2007;51:61–99.
- Shen XL, Zhang B, Liang R, et al. Central role of Nix in the autophagic response to ochratoxin A. Food Chem Toxicol. 2014;69:202–209.
- Zhao T, Shen XL, Chen W, et al. Advances in research of nephrotoxicity and toxic antagonism of ochratoxin A. Toxin Rev. 2017;36:39–44.
- Schaaf GJ, Nijmeijer SM, Maas RF, et al. The role of oxidative stress in the ochratoxin A-mediated toxicity in proximal tubular cells. Biochim Biophys Acta. 2002;1588:149–158.
- Liang R, Shen XL, Zhang B, et al. Apoptosis signal-regulating kinase 1 promotes Ochratoxin A-induced renal cytotoxicity. Sci Rep. 2015;5:8078.
- Zhang B, Shen XL, Liang R, et al. Protective role of the mitochondrial Lon protease 1 in ochratoxin A-induced cytotoxicity in HEK293 cells. J Proteomics. 2014;101:154–168.
- Liu J, Wang Y, Cui J, et al. Ochratoxin A induces oxidative DNA damage and G1 phase arrest in human peripheral blood mononuclear cells in vitro. Toxicol Lett. 2012;211:164–171.
- Yang Q, He X, Li X, et al. DNA damage and S phase arrest induced by Ochratoxin A in human embryonic kidney cells (HEK 293). Mutat Res. 2014;765:22–31.
- Wang Y, Liu J, Cui J, et al. ERK and p38 MAPK signaling pathways are involved in ochratoxin A-induced G2 phase arrest in human gastric epithelium cells. Toxicol Lett. 2012;209:186–192.
- Li X, Gao J, Huang K, et al. Dynamic changes of global DNA methylation and hypermethylation of cell adhesion-related genes in rat kidneys in response to ochratoxin A. World Mycotoxin J. 2015;8:465–476.
- Zhang B, Huang K, Zhu L, et al. Precision toxicology based on single cell sequencing: an evolving trend in toxicological evaluations and mechanism exploration. Arch Toxicol. 2017;91:2539–2549.
- Picelli S, Bjorklund AK, Faridani OR, et al. Smart-seq2 for sensitive full-length transcriptome profiling in single cells. Nat Methods. 2013;10:1096–1098.
- Guo H, Zhu P, Wu X, et al. Single-cell methylome landscapes of mouse embryonic stem cells and early embryos analyzed using reduced representation bisulfite sequencing. Genome Res. 2013;23:2126–2135.
- Yang X, Liu S, Huang C, et al. Ochratoxin A induced premature senescence in human renal proximal tubular cells. Toxicology. 2017;382:75–83.
- Robert MF, Morin S, Beaulieu N, et al. DNMT1 is required to maintain CpG methylation and aberrant gene silencing in human cancer cells. Nat Genet. 2003;33:61–65.
- Robertson KD, Ait-Si-Ali S, Yokochi T, et al. DNMT1 forms a complex with Rb, E2F1 and HDAC1 and represses transcription from E2F-responsive promoters. Nat Genet. 2000;25:338–342.
- Busslinger M, Hurst J, Flavell RA. DNA methylation and the regulation of globin gene expression. Cell. 1983;34:197–206.
- Jaenisch R, Bird A. Epigenetic regulation of gene expression: how the genome integrates intrinsic and environmental signals. Nat Genet. 2003;33:245–254.
- Gong J, Li J, Wang Y, et al. Characterization of microRNA-29 family expression and investigation of their mechanistic roles in gastric cancer. Carcinogenesis. 2014;35:497–506.
- Shibata E, Abbas T, Huang X, et al. Selective ubiquitylation of p21 and Cdt1 by UBCH8 and UBE2G ubiquitin-conjugating enzymes via the CRL4Cdt2 ubiquitin ligase complex. Mol Cell Biol. 2011;31:3136–3145.
- Wagner EJ, Marzluff WF. ZFP100, a component of the active U7 snRNP limiting for histone pre-mRNA processing, is required for entry into S phase. Mol Cell Biol. 2006;26:6702–6712.
- Li DM, Sun H. PTEN/MMAC1/TEP1 suppresses the tumorigenicity and induces G1 cell cycle arrest in human glioblastoma cells. Proc Natl Acad Sci U S A. 1998;95:15406–15411.
- Xuan C, Wang Q, Han X, et al. RBB, a novel transcription repressor, represses the transcription of HDM2 oncogene. Oncogene. 2013;32:3711–3721.
- Bertoli C, Skotheim JM, de Bruin RA. Control of cell cycle transcription during G1 and S phases. Nat Rev Mol Cell Biol. 2013;14:518–528.
- Peeper DS, Shvarts A, Brummelkamp T, et al. A functional screen identifies hDRIL1 as an oncogene that rescues RAS-induced senescence. Nat Cell Biol. 2002;4:148–153.
- Bassermann F, Eichner R, Pagano M. The ubiquitin proteasome system - implications for cell cycle control and the targeted treatment of cancer. Biochim Biophys Acta. 2014;1843:150–162.
- Zhang Z, Kulkarni K, Hanrahan SJ, et al. The APC/C subunit Cdc16/Cut9 is a contiguous tetratricopeptide repeat superhelix with a homo-dimer interface similar to Cdc27. Embo J. 2010;29:3733–3744.
- She BR, Liou GG, Lin-Chao S. Association of the growth-arrest-specific protein Gas7 with F-actin induces reorganization of microfilaments and promotes membrane outgrowth. Exp Cell Res. 2002;273:34–44.
- Maier B, Kirsch M, Anderhub S, et al. The novel actin/focal adhesion-associated protein MISP is involved in mitotic spindle positioning in human cells. Cell Cycle. 2013;12:1457–1471.
- Nakayama KI, Nakayama K. Ubiquitin ligases: cell-cycle control and cancer. Nat Rev Cancer. 2006;6:369–381.
- Lai EC. Notch signaling: control of cell communication and cell fate. Development. 2004;131:965–973.
- Katoh M, Katoh M. Notch signaling in gastrointestinal tract (review). Int J Oncol. 2007;30:247–251.
- Zhou S, Fujimuro M, Hsieh JJ, et al. SKIP, a CBF1-associated protein, interacts with the ankyrin repeat domain of NotchIC To facilitate NotchIC function. Mol Cell Biol. 2000;20:2400–2410.
- Koch U, Radtke F. Notch and cancer: a double-edged sword. Cell Mol Life Sci. 2007;64:2746–2762.
- Huang Y, Zhao M, Xu H, et al. RASAL2 down-regulation in ovarian cancer promotes epithelial-mesenchymal transition and metastasis. Oncotarget. 2014;5:6734–6745.
- Zhang YY, Wu JW, Wang ZX. A distinct interaction mode revealed by the crystal structure of the kinase p38alpha with the MAPK binding domain of the phosphatase MKP5. Sci Signal. 2011;4:ra88.
- Li J, Zhou Q, Ma Z, et al. Feedback inhibition of CREB signaling by p38 MAPK contributes to the negative regulation of steroidogenesis. Reprod Biol Endocrinol. 2017;15:19.
- Xing J, Ginty DD, Greenberg ME. Coupling of the RAS-MAPK pathway to gene activation by RSK2, a growth factor-regulated CREB kinase. Science. 1996;273:959–963.
- Audas TE, Li Y, Liang G, et al. A novel protein, Luman/CREB3 recruitment factor, inhibits Luman activation of the unfolded protein response. Mol Cell Biol. 2008;28:3952–3966.
- Picelli S, Faridani OR, Bjorklund AK, et al. Full-length RNA-seq from single cells using Smart-seq2. Nat Protoc. 2014;9:171–181.
- Guo H, Zhu P, Guo F, et al. Profiling DNA methylome landscapes of mammalian cells with single-cell reduced-representation bisulfite sequencing. Nat Protoc. 2015;10:645–659.
- Ortega MA, Poirion O, Zhu X, et al. Using single-cell multiple omics approaches to resolve tumor heterogeneity. Clin Transl Med. 2017;6:46.
- Macaulay IC, Ponting CP, Voet T. Single-cell multiomics: multiple measurements from single cells. Trends Genet. 2017;33:155–168.
- Hu Y, An Q, Sheu K, et al. Single cell multi-omics technology: methodology and application. Front Cell Dev Biol. 2018;6:28.
- Fortini ME. Notch signaling: the core pathway and its posttranslational regulation. Dev Cell. 2009;16:633–647.
- Mumm JS, Kopan R. Notch signaling: from the outside in. Dev Biol. 2000;228:151–165.
- Zurich MG, Honegger P. Ochratoxin A at nanomolar concentration perturbs the homeostasis of neural stem cells in highly differentiated but not in immature three-dimensional brain cell cultures. Toxicol Lett. 2011;205:203–208.
- Limbeck E, Vanselow JT, Hofmann J, et al. Linking site-specific loss of histone acetylation to repression of gene expression by the mycotoxin ochratoxin A. Arch Toxicol. 2018;92:995–1014.
- Raman M, Chen W, Cobb MH. Differential regulation and properties of MAPKs. Oncogene. 2007;26:3100–3112.
- Ozcan Z, Gul G, Yaman I. Ochratoxin A activates opposing c-MET/PI3K/Akt and MAPK/ERK 1-2 pathways in human proximal tubule HK-2 cells. Arch Toxicol. 2015;89:1313–1327.
- Tidyman WE, Rauen KA. The RASopathies: developmental syndromes of Ras/MAPK pathway dysregulation. Curr Opin Genet Dev. 2009;19:230–236.
- Aoki Y, Niihori T, Narumi Y, et al. The RAS/MAPK syndromes: novel roles of the RAS pathway in human genetic disorders. Hum Mutat. 2008;29:992–1006.
- Lu Y, Yang L, Wei W, et al. Microchip-based single-cell functional proteomics for biomedical applications. Lab Chip. 2017;17:1250–1263.
- Jaitin DA, Weiner A, Yofe I, et al. Dissecting Immune Circuits by Linking CRISPR-Pooled Screens with Single-Cell RNA-Seq. Cell. 2016;167:1883–96 e15.
- Yang Q, Shi L, Huang K, et al. Protective effect of N-acetylcysteine against DNA damage and S-phase arrest induced by ochratoxin A in human embryonic kidney cells (HEK-293). Food Chem Toxicol. 2014;70:40–47.
- Guo W, Fiziev P, Yan W, et al. BS-Seeker2: a versatile aligning pipeline for bisulfite sequencing data. BMC Genomics. 2013;14:774.
- Guo W, Zhu P, Pellegrini M, et al. CGmapTools improves the precision of heterozygous SNV calls and supports allele-specific methylation detection and visualization in bisulfite-sequencing data. Bioinformatics. 2018;34:381–387.
- Mi H, Huang X, Muruganujan A, et al. PANTHER version 11: expanded annotation data from Gene Ontology and Reactome pathways, and data analysis tool enhancements. Nucleic Acids Res. 2017;45:D183–D9.
- Kim D, Pertea G, Trapnell C, et al. TopHat2: accurate alignment of transcriptomes in the presence of insertions, deletions and gene fusions. Genome Biol. 2013;14:R36.
- Trapnell C, Roberts A, Goff L, et al. Differential gene and transcript expression analysis of RNA-seq experiments with TopHat and Cufflinks. Nat Protoc. 2012;7:562–578.
- Tripathi S, Pohl MO, Zhou Y, et al. Meta- and Orthogonal Integration of Influenza “OMICs” Data Defines a Role for UBR4 in Virus Budding. Cell Host Microbe. 2015;18:723–735.
- Wang X, Spandidos A, Wang H, et al. PrimerBank: a PCR primer database for quantitative gene expression analysis, 2012 update. Nucleic Acids Res. 2012;40:D1144–9.