
 ?Mathematical formulae have been encoded as MathML and are displayed in this HTML version using MathJax in order to improve their display. Uncheck the box to turn MathJax off. This feature requires Javascript. Click on a formula to zoom.
ABSTRACT
Polygenic approaches often access more variance of complex traits than is possible by single variant approaches. For genotype data, genetic risk scores (GRS) are widely used for risk prediction as well as in association and interaction studies. Recently, interest has been growing in transferring GRS approaches to DNA methylation data (methylation risk scores, MRS), which can be used 1) as biomarkers for environmental exposures, 2) in association analyses in which single CpG sites do not achieve significance, 3) as dimension reduction approach in interaction and mediation analyses, and 4) to predict individual risks of disease or treatment success. Most GRS approaches can directly be transferred to methylation data. However, since methylation data is more sensitive to confounding, e.g. by age and tissue, it is more complex to find appropriate external weights. In this review, we will outline the adaption of current GRS approaches to methylation data and highlight occurring challenges.
Introduction
Since most complex diseases are influenced by several genes each having only a small effect on its own, polygenic approaches that deal with the genetic basis en masse often access more of the variance of complex traits than is possible by single variant approaches.
The most popular polygenic approach is using weighted genetic risk scores (GRS) (also called polygenic risk scores (PRS)), which are defined as weighted sums of risk alleles of a pre-selected number of single nucleotide polymorphisms (SNPs) [Citation1]. Particularly for complex diseases, GRS are statistically powerful to test for marginal genetic effects and gene–environment interaction effects, as well as to predict individual trait values or risks of disease. As a gold standard, weights are determined externally from independent studies, but there are also approaches in which the weights are determined from within the study sample, which can be applied if appropriate external weights are not available [Citation2–Citation4]. A thorough overview on different methods, available software and recent GRS studies with a focus on psychiatric disorders is given in [Citation5].
Very recently, interest has been growing in transferring GRS approaches to DNA methylation data, which are then called DNA methylation risk scores (MRS). MRS are defined as weighted sums of the individual’s methylation markers’ beta values of a pre-selected number of CpG sites and they can be used 1) as biomarkers for environmental exposures such as smoking [Citation6,Citation7], 2) in association analyses in which single CpG sites do not individually achieve significance [Citation8], 3) as powerful dimension reduction approach for interaction (popular for GRS [Citation9–Citation11]) as well as mediation analyses [Citation8] and 4) to predict individual risks of disease [Citation12,Citation13] or treatment success [Citation14].
However, up to now, little is known about how to correctly transfer GRS approaches to MRS and what challenges need to be considered.
Risk score profiling
Constructing risk scores
In general, weighted risk scores are a weighted sum of reference features (e.g. genotypes or methylation levels).
Given subjects
, for an individual i the weighted GRS is defined as weighted sum of the number of alternate alleles (coded as 0, 1, 2) of
considered SNPs
:
Using the same logic, the weighted MRS is defined as weighted sum of the individual’s methylation markers’ beta values of pre-selected CpG sites
:
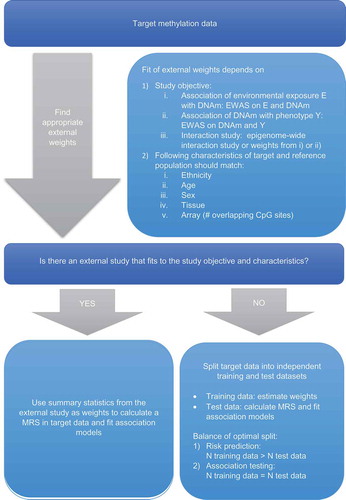
The determination of appropriate weights is discussed in the following chapters as well as depicted for MRS in the flow chart in .
Figure 1. Flow chart of methylation risk score (MRS) calculation.
Abbreviations: DNAm, DNA methylation; EWAS, epigenome-wide association study
External weights
The most common weighting approach, which is also referred to as gold-standard, is to use external weights , e.g. marginal (epi)genetic effects (β-estimates) of the
SNPs/CpG-sites estimated in an independent study population [Citation4,Citation15]. External weights from genome-wide meta-analyses that provide the combined effect estimates of a range of independent studies are usually preferred, followed by weights from meta-analyses, which only include a selected number of SNPs identified to be relevant for the phenotype and by genome-wide association studies (GWAS) in large single cohorts [Citation3]. Meta-analysis of multiple GWAS has become common practice over the last few years [Citation16] and today large-scale meta-analyses with 10,000 or more subjects exist for almost every phenotype.
One of the first applications of GRS with external weights was published by Purcell et al. who used GRS to argue that schizophrenia has a polygenic risk [Citation17]. Although this GWAS identified few individually significant single nucleotide polymorphisms (SNPs), the authors provided evidence for a substantial polygenic component to risk of schizophrenia involving thousands of common alleles of very small effect. In addition, GRS showed promise for patient stratification and subphenotyping [Citation18]. In another study by Hamshere et al., GRS for schizophrenia risk could distinguish schizo-affective cases from other bipolar disorder cases [Citation19]. Moreover, GRS with external weights were successfully used in interaction analyses to examine the genetic susceptibility to air pollution-induced type 2 diabetes [Citation9], lifestyle-induced changes in BMI [Citation10] and fried food-induced obesity [Citation11].
Considering MRS, up to now, only a very limited number of large-scale meta-analyses of epigenome-wide association studies (EWAS) has been published [Citation20–Citation23], which makes it often difficult to find appropriate external weights.
A limitation of GRS and MRS with external weights is that only SNPs/CpG-sites for which marginal effects have been published can be included in the analysis [Citation3]. It is therefore essential, that full summary statistics presenting p-values and effect sizes for all analysed SNPs/CpG-sites are publically available. Otherwise, if only genome-wide significant hits are reported for instance, also risk score profiles are restricted to these sites. Furthermore, not for every phenotype, large-scale GWAS or EWAS are published and sometimes these have been conducted only in populations with different ethnicity, sex or age range or, in case of EWAS, using a different tissue.
Unweighted scores
In scenarios, in which the target and reference population do not match perfectly (e.g. different ethnicity, different but similar phenotype, etc.), unweighted risk scores (RS), which are also called simple count RS, can be used. Unweighted RS are defined as simple-unweighted sum or count of risk alleles (GRS) or beta values (MRS) and are calculated by setting all weights in Equation (1) or (2) equal to 1. However, even for unweighted RS, prior knowledge about the effect sign of the beta coefficients of each SNP/CpG site is needed from an external reference population. With regard to MRS, for each CpG site, it needs to be determined if an increase or decrease of methylation is associated with disease. If a decrease of methylation is associated with disease development, the beta values of the CpG sites need to be multiplied by −1 so that subsequently a higher MRS is associated with a higher risk of disease. Consequently, methylation-levels of CpG sites which are negatively correlated with disease development would be weighted with −1, whereas methylation-levels of CpG-sites which are positively correlated with disease development would be weighted with 1. This information can be gained from an external reference population even if there is not a perfect match between target and reference population () or in scenarios in which summary statistics from different EWAS need to be combined (e.g. when information from more than one phenotype needs to be included).
Unweighted RS are the easiest approach if no appropriate external weights are available and were used e.g. to investigate the interaction between GRS and physical activity in obesity [Citation24,Citation25]. However, unweighted RS are substantially less powerful than weighted RS, particularly in the presence of noise (SNPs or CpG sites without any effect on the phenotype), because they assume that each SNP/CpG site has the same effect on the phenotype (shown for GRS in [Citation2,Citation15,Citation26]).
Internal weights
In another approach, if no external weights are available, weights are estimated in the own study sample, called ‘internal weights’. The most important challenge here is to avoid overfitting, which is caused by using the same data to estimate the weights as well as for applying the RS and which can lead to biased effect estimates as well as inflated type I errors [Citation27,Citation28]. This can either be done with cross-validation or by splitting the original dataset into a fixed but random training dataset, in which the weights are estimated, and an independent test dataset, in which the RS is constructed and applied [Citation4].
How to select a set of SNPs/CPGs for a RS
The most common way to select a set of SNPs/CpG sites for a RS is to choose an arbitrary p-value threshold and only include SNPs/CpG sites that passed that threshold in an external dataset or in an independent training dataset, which is split off the study sample. Since GWAS/EWAS often only publish the summary statistics of the genome-wide significant SNPs/CpG sites, ‘genome-wide significance’ is the most common p-value threshold for a RS. However, the optimal p-value threshold will strongly depend on the supporting data and the underlying genetic and epigenetic architecture of the trait of interest with a more polygenic trait benefiting from the addition of a larger fraction of the top SNP associations [Citation29] for instance. Furthermore, if the external weights are less stable, e.g. because of a small sample size, it may be necessary to include also less significantly associated sites to capture more of the variability [Citation29]. Finally, if the study objective is to construct a RS as screening tool for prediction of disease risk or treatment success, a slight loss in prediction quality may be acceptable if it leads to a more meaningful interpretation of the predictor [Citation30] or makes it possible to create a smaller, custom chip.
It should be noted that, when different p-value thresholds are used and hence different scores are constructed, multiple testing has to be taken into account. Software programs such as PRSice [Citation31] offer the possibility to obtain the optimal p-value threshold, resulting in the score yielding the most significant association results. This is achieved by testing a large number of incrementally different scores while correcting for multiple testing using a permutation-based approach.
Another approach, which is getting more attention in gene–environment interaction studies, is the pathway-based selection of candidate SNPs. The idea behind this approach is that SNPs with a strong marginal genetic effect are not necessarily the strongest candidates regarding interaction with environmental exposures and gene–environment interactions can exist without strong marginal genetic effects [Citation3]. More promising candidates might be SNPs/CpG sites that are related to a biological pathway that is assumed to mediate the association between an environmental exposure and a phenotype. In the Traffic, Asthma, and Genetics (TAG) study, candidate SNPs were selected that were related to oxidative stress and inflammation [Citation32] and in the Study on the Influence of Air Pollution on Lung, Inflammation and Aging (SALIA) candidate SNPs related to endoplasmatic reticulum stress, which plays a major role in inflammatory processes, were selected [Citation33]. Monnereau et al. constructed pathway-specific PRS for adult BMI and showed that these SNPs influence body mass development in early life [Citation34].
Traditionally, analogous to GWAS and EWAS approaches, one linear or logistic regression model is fitted for each SNP/CpG site to estimate the weights. However, weights can also be estimated using penalized regression models instead of relying on an arbitrary p-value threshold. Shrinkage methods (e.g. lasso regression [Citation35], elastic net [Citation36] or LDPred [Citation37]) enable us to include a much higher number of SNPs/CpG sites in our training model and the variable selection is conducted based on shrinkage happening simultaneously to the effect estimation. The elastic net regression was shown to be useful to estimate weights for MRS prediction models including >20,000 CpG sites in the model [Citation38] as well as for the detection of GRS-environment interactions [Citation2,Citation3]. LDPred, which is a Bayesian approach to calculate a posterior mean effect for all variants using external weights with subsequent shrinkage based on linkage disequilibrium [Citation37], can even be applied to genome-wide data in applications with a sufficient sample size (several thousands) [Citation39].
Taking correlation into account
The most popular approaches to handle SNPs in high linkage disequilibrium (LD) or correlated CpG sites are LD pruning and LD clumping. When LD pruning is performed, all pairwise LD-values between SNPs are calculated in a pre-defined basepair-window. If a SNP-pair presents with high LD, e.g. r2 > 0.8, only one SNP of this pair is kept in the analysis. Wu et al. confirmed the beneficial effect of LD pruning on risk prediction [Citation40], whereas other authors showed that RS are surprisingly robust towards LD [Citation2,Citation15,Citation29]. However, one disadvantage of LD pruning is that usually a random SNP, which is not necessarily the SNP with the lower p-value, from each correlated pair is kept. LD clumping on the other hand also takes the p-values of the base sample into account. Correlation between SNP-pairs is assessed as before, but the SNP with the lower p-value observed in the external dataset, is kept in the analysis.
With regard to MRS, no standard procedures are available for clumping. One possibility would be to aggregate information across spatially correlated CpG-sites and use region-wide association p-values, hence to identify differentially methylated regions (DMRs). Such regions are determined with algorithm such as DMRcate for instance [Citation41].
However, a general limitation of pruning and clumping is that it discards information and can reduce predictive accuracy. One way to address this problem is to apply shrinkage methods instead (e.g. lasso regression [Citation35], elastic net [Citation36] or LDPred [Citation37] as discussed earlier). Vilhjálmsson et al. showed that LDpred reaches a higher predictive accuracy than LD clumping, particularly at large sample sizes [Citation37]. LDPred could be easily extended to methylation data, while penalized regression models are already used for MRS [Citation38].
Incorporating functional annotations
Incorporating functional annotations in the construction of RS might provide more insights about the biological meaning of a RS as well as possibly increase its prediction accuracy.
Post-GWAS/EWAS annotation facilitates the selection of most likely causal variant(s). Multiple resources are available for post-GWAS annotation [Citation42,Citation43], which facilitate the selection of most likely causal variant(s). Including functional annotation could therefore be used to filter out noise and thereby possibly increase the power and prediction accuracy of RS. Shi et al. proposed a method, which extends the common LD pruning and thresholding approach by correcting the marginal effect sizes of SNPs for winner’s curse (bias that is caused by only including SNPs below a specific p-value threshold) and incorporates external functional annotation data [Citation44]. The winner’s curse correction is performed by applying LASSO shrinkage to the marginal association statistics of the GRS. External functional/annotation knowledge is incorporated by defining two disjoint SNPs sets, representing ‘high-prior’ SNPs and ‘low-prior’ SNPs, two functional sets for which different p-value thresholds can be chosen. Using this approach, Shi et al. [Citation44] reached an increased prediction accuracy in comparison to the common LD pruning and thresholding approach in simulation studies as well as in a GWAS of type 2 diabetes. A way to incorporate continuous instead of binary functional annotations is to use priors based on the recently developed baseline-LD model [Citation45] as it is described in a recent preprint [Citation46].
Although these methods were developed for GRS, they can be directly transferred to MRS. Particularly, the variation of methylation levels at specific CpG sites and gene expression levels might be important functional priors to increase the prediction accuracy of MRS. Furthermore, annotation of tissue and cell type specificity of CpG sites might be helpful to identify a subset of CpGs that might be functionally relevant for the disease outcome. This information can either be used for a better pre-selection of CpG sites or be directly included as prior in the weighting strategy.
Furthermore, enrichment analysis of the top SNPs/CpG sites included in the RS can provide more information about the biological meaning of the RS. Knowledge about which mechanisms/pathways are covered by the RS can improve the interpretation of the RS-associations.
MRS in prediction models
Prediction of age
In the current literature, MRS have mainly been applied for prediction. The most popular MRS prediction model is an epigenetic clock, which is a multi-tissue predictor of age that allows to estimate the DNA methylation age of most tissues and cell types [Citation38]. In Horvath’s clock, an elastic net regression model was used to regress a transformed version of age on the roughly 21k beta values in the training data. The elastic net regression model automatically selected 353 CpGs with coefficients unequal to zero, which were then called (epigenetic) clock CpGs since their weighted average (formed by the regression coefficients) amounts to an epigenetic clock. This weighted average, which can be used in test datasets to predict epigenetic age, is equivalent to the definition of MRS in equation (2). Horvath’s clock was shown to be associated with markers of physical and mental fitness [Citation47], accelerated ageing effects due to HIV infection [Citation48], sex, race/ethnicity, risk factors for coronary heart disease [Citation49], diet, and obesity [Citation50]. More recently Hovarth’s approach was used to construct an epigenetic clock for gestational age, which may provide additional information relevant to developmental stage [Citation51].
Prediction of exposure level
Beside the prediction of age, MRS can also be used as biomarker for environmental exposures that could not sufficiently be determined by questionnaire or clinical data. Hannon et al. and Elliott et al. estimated a biomarker for smoking status based on the DNA methylation profile at sites known to be associated with smoking status in external EWAS [Citation6,Citation7]. The derived continuous MRS can either be used as covariate in EWAS analysis to adjust for potential confounding caused by smoking [Citation7] or to predict smoking status by applying e.g. Random Forests to identify the threshold score separating smokers and never smokers and to assess misclassification [Citation6]. Applying Random Forests on the smoking MRS, Elliott et al. detected smokers from never and former smokers with 100% sensitivity and 97% specificity [Citation6]. However, this can only be done for CpG sites with a clear link to an environmental exposure. Other environmental exposures with a clear link to DNA methylation and for which MRS biomarkers could be constructed include maternal smoking in pregnancy [Citation22], maternal BMI at the start of pregnancy [Citation23] or fetal alcohol syndrome [Citation52].
Prediction of other phenotypes
Another important application of MRS is the prediction of individual risks of disease (Van Neste et al. 2016; Villanueva et al. 2015) or treatment success (Moreaux et al. 2014), particularly in cancer diagnosis and therapy. Villanueva et al. computed a MRS that accurately discriminated survival of hepatocellular carcinoma patients [Citation12] and Van Neste et al. proposed a MRS to identify men with high-grade (Gleason score ≥ 7) prostate cancer [Citation13]. Furthermore, Van Neste et al. showed that the prediction capacity of their MRS could be improved by including traditional clinical risk factors into the risk score, which emphasizes the value of combining information from different sources for risk prediction [Citation13].
Combining GRS and MRS
Since many phenotypes are influenced by both genotypes as well as DNA methylation, Shah et al. proposed to improve phenotype prediction by combining GRS and MRS [Citation53]. In their study, the authors showed that BMI was best predicted by an interaction or an additive effect between GRS and MRS. GRS as well as MRS were based on SNPs/CpG sites that were significantly associated with BMI in external study populations.
MRS as a tool to understand the mechanisms behind disease development
Marginal effects
RS approaches can be used to increase the power to detect marginal associations between a MRS and a phenotype as well as between an exposure and a MRS.
Wahl et al. used MRS to test whether DNA methylation levels in blood at 187 CpG sites being associated with body mass index (BMI) in 5,387 samples from EPICOR (n = 514), KORA (n = 2,193) and LOLIPOP (n = 2,680), were associated with new onset, incident type 2 diabetes, a major clinical consequence associated with obesity, in participants of LOLIPOP and KORA [Citation8]. However, a shortcoming of their analysis was the large overlap between participants from training and test datasets, which increased the risk of overfitting.
MRS might also be used to investigate the association between an environmental exposure and a pre-defined MRS. This approach can be applied to replicate previous shown associations between an environmental exposure (e.g. smoking or air pollution) with differentially methylated CpG sites in smaller study populations.
Interaction effects
In the last years, RS approaches were shown to be a powerful approach to detect interactions. GRS were successfully used in interaction analyses to examine the genetic susceptibility to air pollution-induced type 2 diabetes [Citation9], air pollution-induced airway inflammation [Citation33], air pollution-induced atopic eczema [Citation32], fried food-induced obesity [Citation11] as an altered recovery from high levels of air pollution [Citation54].
MRS can be useful to detect interactions between an environmental exposure and a MRS as well as interactions between genotypes (or GRS) and MRS.
Hüls et al. pointed out that in GRSxE interaction analysis, it is important to differentiate between predominant marginal genetic effects and predominant interaction effects – a differentiation that should be made a priori and is based on the hypothesis behind the selection of SNPs [Citation3]. In GxE interaction studies, SNPs can either be selected because of their strong marginal genetic association with the phenotype (scenario of predominant marginal genetic effects) or because they are involved in a biological pathway that is supposed to mediate the association between an environmental risk factor and the phenotype (scenario of predominant interaction effects).
This can be directly transferred to MRS because CpG sites can either be selected because of their strong marginal association with the phenotype (scenario of predominant marginal effects) or because they are involved in a biological pathway that is supposed to mediate the association between an environmental or genetic risk factor (single genotype or GRS) and the phenotype (scenario of predominant interaction effects).
In scenarios with predominant marginal effects, the weights should be determined from the marginal effects of genotypes/CpG sites on the phenotype. The gold-standard is again to use external weights estimated in an independent study population or, if there are no appropriate external weights available, the weights can e.g. estimated with the elastic net regression in the own study sample as proposed in [Citation2]. In scenarios with predominant interaction effects, the weights should be determined from the interaction estimates itself. Since there are only a few published large-scale (epi)genome-wide interaction studies, which is mainly due to the power limitations, it is hard to find appropriate external weights for the interaction terms. Therefore, a data splitting strategy within the own study sample is often preferable [Citation3].
Mediation effects
Understanding mediation is useful for identifying intermediates (e.g. differentially methylated CpG sites) lying between an exposure and an outcome which, when intervened upon, will block (some or all of) the causal pathway between the exposure and outcome [Citation55].
One of the most widely cited approaches for evaluating mediation in an epidemiological setting is that originally outlined in [Citation56]. While this approach is widely implemented, it is known to be problematic because it is highly dependent on a number of strong assumptions, the measurement characteristics of the variables and on reliable identification of causal effects [Citation55]. A newer mediation approach that is currently very popular is the concept of causal mediation analysis from a counterfactual perspective. Causal mediation analysis allows for definitions of direct and indirect effects and a total effect as the sum of direct and indirect effects even in models with interactions. The indirect effect refers to the effect that is through the mediator under study. The direct effect refers to the remaining effect that is not through the mediator [Citation57]. The proportion of the indirect effect in the total effect can then be used to assess the extent to which the association between exposure and outcome is mediated through the mediator as an intermediate pathway [Citation58]. In R, causal mediation analysis can be performed by using the R package ‘mediation’ [Citation59], an approach that relies on the quasi-Bayesian Monte Carlo method based on normal approximation [Citation60].
Mediation approaches used in conventional epidemiology have been adapted to understanding the role of molecular intermediates (e.g. DNA methylation) in situations of high-dimensional omics data with varying degrees of success [Citation55]. The first step when investigating the mediating effect of DNA methylation on the association between exposure and phenotype is to reduce the number of CpG sites that are tested in the mediation analysis. This is usually done by a pre-selection of CpG sites that were associated with the exposure and/or the phenotype [Citation61–Citation64]. The next step is to run a mediation analysis on each of these CpG sites followed by a correction for multiple testing (e.g. Bonferroni or FDR). This works well for a small number of mediation tests (e.g. <100). However, as soon as the sample sizes of EWAS increase, the number of CpG sites associated with common exposures/phenotypes will increase as well, which will increase the burden of multiple testing for the subsequent mediation analysis. Recognizing this limitation of conventional mediation analysis, several groups of methodologists have proposed mediation approaches which allow for including a high-dimensional vector of mediators (e.g. CpG sites) [Citation65–Citation67]. Another approach is to combine the pre-selected CpG sites into a MRS, which can then be used as a mediator in one-dimensional causal mediation analyses. Using a MRS as mediator could increase the power to detect mediation effects and can provide a more global answer to the question if methylation mediates the association between exposure and phenotype. In addition, if the MRS is based on CpG sites associated with a particular biological pathway, a mediation analysis could provide important information about how the exposure affects the phenotype.
Confounding by tissue, ethnicity, age, platform
EWAS findings are much more sensitive to confounders than it is the case for GWAS findings, which makes it more difficult to get appropriate external weights.
One main confounder of GWAs and EWAs studies is ethnicity. Genotypes as well as methylation levels [Citation68] can be ethnically different. Therefore, when external weights are used, ideally these weights were assessed in a population with the same ethnic background as the study sample. While genotypes are stable and normally do not change through life, methylation is a very dynamic process depending on age [Citation38] and tissue [Citation69]. Therefore, ideally, external sample and study sample should match with regard to tissue and age. Another issue arises when different methylation arrays, e.g. 450K and EPIC arrays were used as they do not cover the same set of CpGs. While genotype imputation as performed via Hidden Markov models for instance [Citation70] is a standard tool nowadays, imputation of methylation levels remains unclear, also due to the limited number of WGBS (whole genome bisulfite sequencing) samples which could be used as reference sets.
Conclusions
Most RS approaches that were designed for genotype data can directly be transferred to DNA methylation data. However, since methylation data is more sensitive to confounding than genotype data, it is much more challenging to find appropriate reference populations to get valid external weights to construct MRS. Therefore, strategies for estimating weights from the own study sample might move more into the focus when assessing MRS.
Acknowledgments
We thank Elisabeth B. Binder, Michael J. Meaney and Michael S. Kobor for fruitful discussions which brought this collaboration forward.
Disclosure statement
No potential conflict of interest was reported by the authors.
Additional information
Funding
References
- Wray NR, Lee SH, Mehta D, et al. Research Review: polygenic methods and their application to psychiatric traits. J Child Psychol Psychiatry Allied Discip. 2014;55:1068–1087.
- Hüls A, Ickstadt K, Schikowski T, et al. Detection of gene-environment interactions in the presence of linkage disequilibrium and noise by using genetic risk scores with internal weights from elastic net regression. BMC Genet. 2017;18:55.
- Hüls A, Krämer U, Carlsten C, et al. Comparison of weighting approaches for genetic risk scores in gene-environment interaction studies. BMC Genet. 2017;18:115.
- Dudbridge F. Power and predictive accuracy of polygenic risk scores. PLoS Genet. 2013;9:e1003348.
- Martin AR, Daly MJ, Robinson EB, et al. Predicting polygenic risk of psychiatric disorders. Biol Psychiatry 2019;86:97–109.
- Elliott HR, Tillin T, McArdle WL, et al. Differences in smoking associated DNA methylation patterns in South Asians and Europeans. Clin Epigenetics. 2014;6:1–10.
- Hannon E, Dempster E, Viana J, et al. An integrated genetic-epigenetic analysis of schizophrenia: evidence for co-localization of genetic associations and differential DNA methylation. Genome Biol. 2016;17:1–16.
- Wahl S, Drong A, Lehne B, et al. Epigenome-wide association study of body mass index, and the adverse outcomes of adiposity. Nature. 2017;541:81–86.
- Eze IC, Imboden M, Kumar A, et al. Air pollution and diabetes association: modification by type 2 diabetes genetic risk score. Environ Int. 2016;94:263–271.
- Rask-Andersen M, Karlsson T, Ek WE, et al. Gene-environment interaction study for BMI reveals interactions between genetic factors and physical activity, alcohol consumption and socioeconomic status. PLoS Genet. 2017;13:1–20.
- Qi Q, Chu AY, Kang JH, et al. Fried food consumption, genetic risk, and body mass index: gene-diet interaction analysis in three US cohort studies. BMJ. 2014;348:g1610.
- Villanueva A, Portela A, Sayols S, et al. DNA methylation-based prognosis and epidrivers in hepatocellular carcinoma. Hepatology. 2015;61:1945–1956.
- Van Neste L, Partin AW, Stewart GD, et al. Risk score predicts high-grade prostate cancer in DNA-methylation positive, histopathologically negative biopsies. Prostate. 2016;76:1078–1087.
- Moreaux J, Bruyer A, Veyrune JL, et al. DNA methylation score is predictive of myeloma cell sensitivity to 5-azacitidine. Br J Haematol. 2014;164:613–616.
- Che R, Motsinger-Reif AA. Evaluation of genetic risk score models in the presence of interaction and linkage disequilibrium. Front Genet. 2013;4:1–10.
- Panagiotou OA, Willer CJ, Hirschhorn JN, et al. The power of meta-analysis in genome-wide association studies. Annu Rev Genomics Hum Genet. 2013;14:441–465.
- Purcell SM, Wray NR, Stone JL, et al. Common polygenic variation contributes to risk of schizophrenia and bipolar disorder. Nature. 2009;72:1343–1354.
- Dudbridge F. Polygenic Epidemiology. Genet Epidemiol. 2016;40:268–272.
- Hamshere ML, O’Donovan MC, Jones IR, et al. Polygenic dissection of the bipolar phenotype. Br J Psychiatry. 2011;198:284–288.
- Story Jovanova O, Nedeljkovic I, Spieler D, et al. DNA methylation signatures of depressive symptoms in middle-aged and elderly persons: meta-analysis of multiethnic epigenome-wide studies. JAMA Psychiatry. 2018;75:949–959.
- Xu C-J, Söderhäll C, Bustamante M, et al. DNA methylation in childhood asthma: an epigenome-wide meta-analysis. Lancet Respir Med. 2018;6:379–388.
- Joubert BR, Felix JF, Yousefi P, et al. DNA methylation in newborns and maternal smoking in pregnancy: genome-wide consortium meta-analysis. Am J Hum Genet. 2016;98:680–696.
- Sharp GC, Salas LA, Monnereau C, et al. Maternal BMI at the start of pregnancy and offspring epigenome-wide DNA methylation: findings from the pregnancy and childhood epigenetics (PACE) consortium. Hum Mol Genet. 2017;26:4067–4085.
- Li S, Zhao JH, Luan J, et al. Physical activity attenuates the genetic predisposition to obesity in 20,000 men and women from EPIC-Norfolk prospective population study. PLoS Med. 2010;7:1–9.
- Ahmad S, Rukh G, Varga TV, et al. Gene x physical activity interactions in obesity: combined analysis of 111,421 individuals of European ancestry. PLoS Genet. 2013;9:1–9.
- Che R, Motsinger-Reif AA. A new explained-variance based genetic risk score for predictive modeling of disease risk. Stat Appl Genet Mol Biol. 2012;11:Article 15.
- Burgess S, Thompson SG. Use of allele scores as instrumental variables for Mendelian randomization. Int J Epidemiol. 2013;42:1134–1144.
- Burgess S, Dudbridge F, Thompson SG. Combining information on multiple instrumental variables in Mendelian randomization: comparison of allele score and summarized data methods. Stat Med. 2016;35:1880–1906.
- Goldstein BA, Yang L, Salfati E, et al. Contemporary considerations for constructing a genetic risk score: an empirical approach. Genet Epidemiol. 2015;39:439–445.
- Janssens ACJW, Joyner MJ. Polygenic risk scores that predict common diseases using millions of single nucleotide polymorphisms: is more, better? Clin Chem. 2019;65:609–611.
- Euesden J, Lewis CM, O’Reilly PF. PRSice: polygenic risk score software. Bioinformatics. 2015;31:1466–1468.
- Hüls A, Klümper C, MacIntyre EA, et al. Atopic dermatitis: interaction between genetic variants of GSTP1, TNF, TLR2, and TLR4 and air pollution in early life. Pediatr Allergy Immunol. 2018;29:596–605.
- Hüls A, Krämer U, Herder C, et al. Genetic susceptibility for air pollution-induced airway inflammation in the SALIA study. Environ Res. 2017;152:43–50.
- Monnereau C, Vogelezang S, Kruithof CJ, et al. Associations of genetic risk scores based on adult adiposity pathways with childhood growth and adiposity measures. BMC Genet. 2016;17:1–13.
- Tibshirani R. Regression shrinkage and selection via the Lasso. J R Stat Soc Ser B. 1996;58:267–288.
- Zou H, Hastie T. Regularization and variable selection via the elastic-net. J R Stat Soc. 2005;67:301–320.
- Vilhjálmsson BJ, Yang J, Finucane HK, et al. Modeling linkage disequilibrium increases accuracy of polygenic risk scores. Am J Hum Genet. 2015;97:576–592.
- Horvath S. DNA methylation age of human tissues and cell types. Genome Biol. 2013;14:R115.
- Khera AV, Chaffin M, Wade KH, et al. Polygenic prediction of weight and obesity trajectories from birth to adulthood. Cell. 2019;177:587–596.e9.
- Wu J, Pfeiffer RM, Gail MH. Strategies for developing prediction models from genome-wide association studies. Genet Epidemiol. 2013;37:768–777.
- Peters TJ, Buckley MJ, Statham AL, et al. De novo identification of differentially methylated regions in the human genome. Epigenetics Chromatin. 2015;8:6.
- Watanabe K, Taskesen E, van Bochoven A, et al. Functional mapping and annotation of genetic associations with FUMA. Nat Commun [Internet] 2017; 8:1826. Available from: http://www.ncbi.nlm.nih.gov/pubmed/29184056%0Ahttp://www.pubmedcentral.nih.gov/articlerender.fcgi?artid=PMC5705698
- Backenroth D, He Z, Kiryluk K, et al. FUN-LDA: A latent dirichlet allocation model for predicting tissue-specific functional effects of noncoding variation: methods and applications. Am J Hum Genet [Internet]. 2018; 102:920–942. Available from: https://doi.org/10.1016/j.ajhg.2018.03.026
- Shi J, Park J, Duan J, et al. Winner’s curse correction and variable thresholding improve performance of polygenic risk modeling based on genome-wide association study summary-level data. PLoS Genet. 2016;12:e1006493.
- Finucane HK, Bulik-Sullivan B, Gusev A, et al. Partitioning heritability by functional annotation using genome-wide association summary statistics. Nat Genet. 2015;47:1228–1235.
- Márquez-Luna C, Gazal S, P-R L, et al. Modeling functional enrichment improves polygenic prediction accuracy in UK Biobank and 23andMe data sets. bioRxiv. 2018.
- Marioni RE, Shah S, McRae AF, et al. The epigenetic clock is correlated with physical and cognitive fitness in the Lothian Birth Cohort 1936. Int J Epidemiol. 2015;44:1388–1396.
- Horvath S, Levine AJ. HIV-1 infection accelerates age according to the epigenetic clock. J Infect Dis. 2015;212:1563–1573.
- Horvath S, Gurven M, Levine ME, et al. An epigenetic clock analysis of race/ethnicity, sex, and coronary heart disease. Genome Biol [Internet] 2016; 17:0–22. Available from: http://dx.doi.org/10.1186/s13059-016-1030-0
- Quach A, Levine ME, Tanaka T, et al. Epigenetic clock analysis of diet, exercise, education, and lifestyle factors. Aging (Albany NY). 2017;9:419–446.
- Knight AK, Craig JM, Theda C, et al. An epigenetic clock for gestational age at birth based on blood methylation data. Genome Biol [Internet] 2016; 17:1–11. Available from: http://dx.doi.org/10.1186/s13059-016-1068-z
- Lussier AA, Morin AM, MacIsaac JL, et al. DNA methylation as a predictor of fetal alcohol spectrum disorder. Clin Epigenetics. 2018;10:1–14.
- Shah S, Bonder MJ, Marioni RE, et al. Improving phenotypic prediction by combining genetic and epigenetic associations. Am J Hum Genet. 2015;97:75–85.
- Hüls A, Sugiri D, Abramson MJ, et al. Benefits of improved air quality on ageing lungs: impacts of genetics and obesity. Eur Respir J. 2019;53.
- Richmond RC, Hemani G, Tilling K, et al. Challenges and novel approaches for investigating molecular mediation. Hum Mol Genet. 2016;25:R149–56.
- Baron RM, Kenny DA. The moderator-mediator variable distinction in social the moderator-mediator variable distinction in social psychological research: conceptual, strategic, and statistical considerations. J Pers Soc Psychol. 1986;51:1173–1182.
- Ikram MA, VanderWeele TJ. A proposed clinical and biological interpretation of mediated interaction. Eur J Epidemiol. 2015;30:1115–1118.
- Valeri L, Vanderweele TJ. Mediation analysis allowing for exposure-mediator interactions and causal interpretation: theoretical assumptions and implementation with SAS and SPSS macros. Psychol Methods. 2013;18:137–150.
- Tingley D, Yamamoto T, Hirose K, et al. Mediation: R package for causal mediation analysis. J Stat Softw. 2014;59:1–38.
- Imai K, Keele L, Tingley D. A general approach to causal mediation analysis. Psychol Methods. 2010;15:309–334.
- Küpers LK, Xu X, Jankipersadsing SA, et al. DNA methylation mediates the effect of maternal smoking during pregnancy on birthweight of the offspring. Int J Epidemiol. 2015;44:1224–1237.
- Tobi EW, Slieker RC, Luijk R, et al. DNA methylation as a mediator of the association between prenatal adversity and risk factors for metabolic disease in adulthood. Sci Adv. 2018;4:eaao4364.
- Witt SH, Frank J, Gilles M, et al. Impact on birth weight of maternal smoking throughout pregnancy mediated by DNA methylation. BMC Genomics. 2018;19:290.
- de Vries M, van der Plaat DA, Nedeljkovic I, et al. From blood to lung tissue: effect of cigarette smoke on DNA methylation and lung function. Respir Res. 2018;19:1–9.
- Zhang H, Zheng Y, Zhang Z, et al. Estimating and testing high-dimensional mediation effects in epigenetic studies. Bioinformatics. 2016;32:3150–3154.
- Huang Y-T, Variance component tests of multivariate mediation effects under composite null hypotheses. Biometrics [Internet] 2019; Available from: http://www.ncbi.nlm.nih.gov/pubmed/31009061
- Djordjilović V, Page CM, Gran JM, et al. Global test for high-dimensional mediation: testing groups of potential mediators. Stat Med. 2019.
- Heyn H, Moran S, Hernando-Herraez I, et al. DNA methylation contributes to natural human variation. Genome Res. 2013;23:1363–1372.
- Lokk K, Modhukur V, Rajashekar B, et al. DNA methylome profiling of human tissues identifies global and tissue-specific methylation patterns. Genome Biol. 2014;15:r54.
- Marchini J, Howie B, Myers S, et al. A new multipoint method for genome-wide association studies by imputation of genotypes. Nat Genet. 2007;39:906–913.