
ABSTRACT
Imprinted genes play a pivotal role in placental processes underlying fetal development, and much interest centers on discerning whether these loci, via changes in DNA methylation and/or gene expression, inform disruptions in appropriate fetal growth. In this study, we comprehensively profiled DNA methylation across the placental imprintome and assessed the relationship with gene expression levels and aberrant fetal growth.
Placental DNA methylation across 153 imprinted loci, including imprint control regions (ICR) and surrounding non-ICR regions, was surveyed using the Nimblegen TruSeq bisulfite sequencing platform among participants enrolled in the Rhode Island Child Health Study (RICHS, n = 163). Methylation and gene expression associations were assessed using eQTM analysis. Differential methylation analysis contrasting small (SGA) and large for gestational age (LGA) infants against appropriate for gestational age (AGA) infants was assessed using the DMRcate R package.
We identified 34 SGA-related differentially methylated regions (DMRs) and 9 LGA-related DMRs (FDR<0.05), and these BW-DMRs predominated in promoter and intronic regions. We observed overall hypomethylation among SGA-DMRs overlapping maternally expressed (paternally imprinted) genes while no parent-of-origin effect was observed among LGA DMRs. Three BW-DMRs, mapping to GABRG3, IGF1R and MEST, were common to SGA and LGA placenta. We did not observe significant correlations between BW-DMR-associated CpG methylation and gene expression levels.
We report the first in-depth characterization of the placental imprintome in a population-wide setting. Our findings reveal growth-related differences in methylation without concomitant expression differences in regions that extend beyond typically interrogated imprinted loci, highlighting potentially novel placental biomarkers of growth and development.
Introduction
The placenta is the principal organ coordinating fetal development, actively orchestrating nutrient transfer, gas exchange, waste removal, immune tolerance, neuroendocrine functions as well as other functionalities that support appropriate progression through gestation [Citation1]. Disruptions in these placental processes are known to underlie pregnancy pathologies, including deviations in appropriate fetal growth, with subsequent implications for the health of the infant and beyond [Citation2].
Genomic imprinting, a process through which a subset of genes are monoallelically expressed based on parent-of-origin, is an epigenetically-determined phenomenon that coevolved with placentation and is recognized as an important conveyor of placental function [Citation3]. Early studies delineating the function of these genes noted a pattern whereby paternally expressed genes tend to be involved in processes that maximize fetal growth and maternally expressed genes tend to be involved in processes restraining fetal growth, an observation that was subsequently formalized into developmental paradigms, including the parental conflict theory [Citation4–Citation6]. While not all imprinted genes fit neatly into these posited theories, by and large, these genes tend to be involved in growth-related processes. This is particularly evident in imprinting syndromes, where clinical features typically include deviations in appropriate growth [Citation7,Citation8]. However, the implications of more subtle variations in the epigenetic marks that inform imprinting on fetal growth within a population-wide setting are not as well understood.
Several studies have evaluated the role of imprinted gene variability on fetal growth. The reported associations have linked outcomes to various imprinted gene readouts, including variation in gene expression or DNA methylation. However, few studies have systematically evaluated whether changes in the DNA methylation and gene expression levels of imprinted genes are linked to important health effects. Similarly, while approximately 100–200 genes display imprinting in the human placenta, most studies thus far have focused on just a handful of genes, with a particular emphasis on IGF2/H19 [Citation9–Citation14]. This is underscored by the fact that these epigenetically-informed imprint control regions (ICRs) are commonly positioned peripheral to canonical promoter regions, often falling outside of the purview of epigenome-wide surveys. Until recently, few ICRs were delineated. However, through concerted genome-wide efforts, ICRs across the broader imprintome are beginning to be characterized [Citation15,Citation16]. This study leverages this newly available information to survey methylation patterns across the placental imprintome, including ICR and surrounding non-ICR promoter and gene body regions. We evaluated in an epidemiologic study whether variations in these DNA methylation patterns have implications for fetal growth and whether these associations are dependent on changes in transcript abundance.
Results
shows the demographic characteristics of the Rhode Island Child Health Study (RICHS) participants included in the current study. This study population reflects term pregnancies oversampled for SGA and LGA infants (>15% each) and a maternal population primarily composed of Caucasian women (>70%). A few noteworthy differences across birthweight categories are apparent. Compared to women who gave birth to AGA infants, a greater proportion of women who gave birth to both SGA and LGA infants tested positive for gestational diabetes. A greater proportion of women who gave birth to SGA infants identified as an ethnicity other than Caucasian.
Table 1. Demographic comparison across birth weight categories in RICHS participants with bisulfite sequencing data (n = 163).
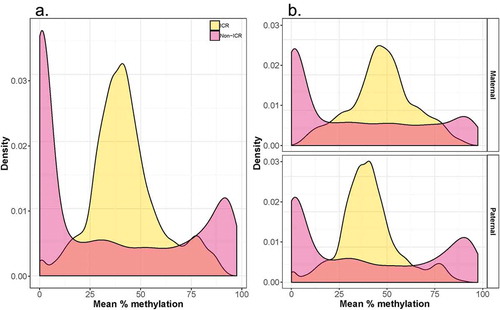
shows the chromosomal distribution of imprinted regions interrogated by our custom-designed panel. The analyzed data-set includes 153 known and putative imprinted loci (21,598 CpG sites), including both characterized ICR (30%, 7122 CpG sites) as well as non-ICR regions. As depicted by the karyogram, our panel includes maternally expressed (paternally imprinted) loci (24.8%), paternally expressed (maternally imprinted) loci (47.1%) and loci where the parental origin of the expressed allele is unknown (28.1%). This bias towards paternally expressed (maternally imprinted) genes has been previously noted in primate placenta [Citation17]. The distribution in average methylation values in the characterized ICR and non-ICR regions we surveyed is shown in , both overall () as well as stratified by the expressed parental allele (). The bimodal distribution within non-ICR regions is consistent with a hypomethylated state at promoters (the predominant queried regions) and a hypermethylated stated at non-genic regions. The mid-range peak among the ICR regions likely reflects a hemi-methylated state resulting from the averaging of one methylated and one unmethylated allele at imprinted regions (). Stratifying by known expressed parental allele, elevated average methylation levels (47.5%) are observed within ICR regions overlapping maternally expressed loci compared to paternally expressed loci (40.7%).
Figure 1. Karyogram depicting the distribution of interrogated imprinted loci across the genome. Paternally expressed loci are indicated in blue, maternally expressed loci are indicated in red and loci where the parental allele expressed is unknown are indicated in grey.
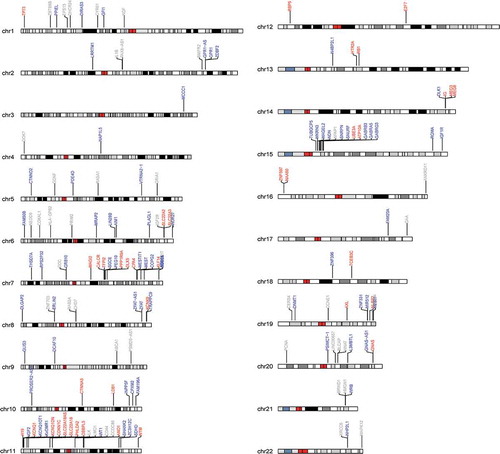
Figure 2. Distribution in average methylation levels across ICR and non-ICR CpG sites. A bimodal distribution in methylation levels is observed in non-ICR regions, predominated by a peak around 0%. A predominant mid-range level peak is observed within ICR-regions.
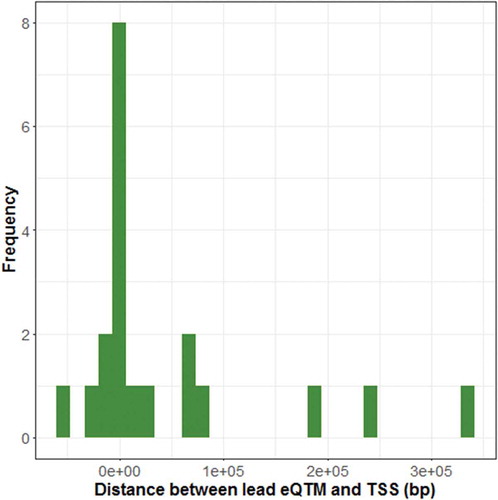
We identified expression quantitative methylation (eQTM) CpGs at Bonferroni-corrected permutation p-value<0.05 for 17 imprinted loci (Supplementary Figure 1, Supplementary Table 2), with effect size estimates ranging from −0.59 (CPXM2) to 0.52 (SGCE). Seven eQTM CpG sites mapped to ICR regions (ZC3H12C, H19, RB1, GPR1, GNAS, PLAGL1, SGCE) and ten eQTM CpG sites mapped to non-ICR regions (CYR61, LDB1, CPXM2, SHANK2, CCNE1, PAX8-AS1, VTRNA2-1, LIN28B, ZFAT and PSMD5-AS1). Both positive (n = 4) and negative (n = 3) associations with expression are observed among ICR eQTM CpG sites while all 10 non-ICR eQTM CpG sites are negatively associated with expression. The identified eQTM sites generally occur in CpG islands (n = 8) and shores (n = 5). The distribution of peak eQTM CpGs (defined as the CpG sites most significantly associated with gene expression for each gene) indicates that genomic context plays a role on the correlation strength between expression and methylation levels. As shown in , peak eQTM CpGs predominate at the transcription start site, supporting the notion that CpG sites within the promoter regions are particularly relevant in regulating gene activity.
Figure 3. Distance between cis-eQTMs and transcription start site (TSS). The distribution of lead eQTM sites (most significant CpG site for every gene (FDR<0.05)) is shown in relation to each site’s distance to the TSS of the cis-linked gene.
To further characterize the functional relevance of the interrogated imprinted regions, we mapped the queried CpG sites to other known epigenomic elements, including histone modification marks and DNAse I hypersensitivity sites, as made available through the NIH Roadmap Epigenomics Mapping Consortium [Citation18,Citation19]. Comparing ICR and non-ICR regions, a greater proportion of ICR-linked CpG sites overlap known DNA regulatory elements, including the activating histone modification marks H3K27ac and H3K4me3 as well as the silencing histone modification mark H3K9me3 (Supplementary Figure 2). Comparing maternally expressed (paternally imprinted) to paternally expressed (maternally imprinted) regions, a greater proportion of CpG sites overlap the silencing mark H3K27me3 in maternally expressed imprinted regions (Supplementary Figure 3).
In the contrast between SGA and AGA placenta, we observed 34 differentially methylated regions (DMRs) that span between 2–75 CpG sites/region. depicts the maximum beta estimate effect size (peak CpG site) observed within each SGA-DMR. Roughly equivalent numbers of SGA-DMRs are observed in ICR (n = 16) and non-ICR (n = 18) regions. In ICR regions, roughly equivalent numbers of hypo- (n = 9) and hypermethylated (n = 7) regions are observed, whereas in the non-ICR regions, SGA-DMRs tend to be hypomethylated in SGA compared to AGA placenta. We also observed a trend with respect to parental allele expressed, with a greater number of SGA-DMRs overlapping paternally expressed (maternally imprinted) regions (n = 21). An overall hypomethylation among SGA compared to AGA placenta is observed among maternally expressed (paternally imprinted) loci, while hypermethylated loci are restricted to paternally expressed (maternally imprinted) loci.
Figure 4. Peak CpG site effect size estimates observed across BW-DMRs. Effect size estimates of peak CpG sites (CpG sites with the largest absolute value estimates within each BW-DMR) are shown for ICR (top panel) and non-ICR (bottom panel) SGA (a) and LGA (b) DMRs. Available information on whether the maternal (red) or paternal (blue) allele is known to be expressed is also indicated.
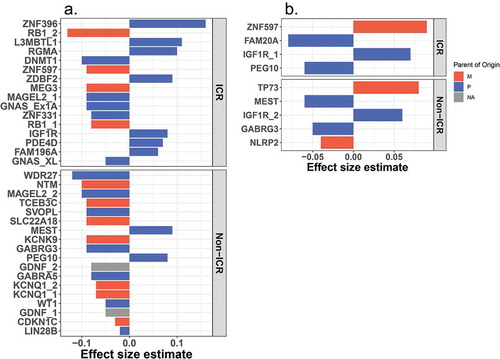
In the contrast between LGA and AGA placenta, fewer LGA-DMRs (n = 9) and smaller effect sizes are observed than in the comparison between SGA and AGA placenta (). Again, roughly equivalent number of LGA-DMRs are observed in ICR (n = 4) and non-ICR (n = 5) regions. With respect to parental allele expressed, a greater number of LGA-DMRs overlap paternally expressed regions (n = 6), similar to the observation among SGA-DMRs. While a tendency towards hypomethylation among paternally expressed (maternally imprinted) loci is suggested, an effect as consistent as the SGA/AGA contrast is not apparent. Methylation levels across birth weight categories representative of the identified SGA and LGA DMRs are depicted in Supplementary Figures 4 and 5.
The ICR methylation patterns vary within BW-DMRs compared to regions that fall outside of the BW-DMRs (Supplementary Figure 6). In regions outside of the BW-DMRs, an elevation in methylation levels is observed in maternally (paternally imprinted) expressed loci in comparison to paternally expressed (maternally imprinted) regions. This contrast in methylation levels by parent of origin is accentuated among SGA-DMRs, while a reversal in these patterns is observed among LGA-DMR. Differences in methylation patterns within and outside BW-DMR regions are also apparent in non-ICR regions. However, these patterns are less discernable, partially due to the more extensive variability in non-ICR methylation.
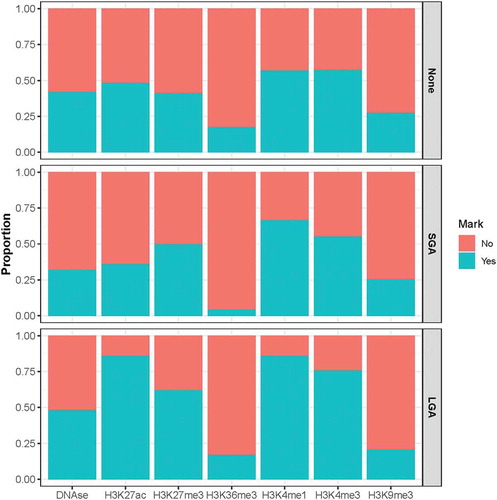
Differences in the overlap with other epigenomic elements are also observed in the BW-DMRs compared to regions that fall outside of the BW-DMRs. Specifically, a greater overlap with the activating histone modification marks H3K27ac, H3K4me1 and H3K4me3 and the silencing histone modification mark H3K27me3 are observed in the LGA DMRs than in regions outside the BW-DMRs ().
Figure 5. Overlap between various epigenomic elements and CpG sites that fall within and outside of the identified BW-DMRs. The top panel shows the proportion of CpG sites that overlap various DNA regulatory elements in regions outside the identified BW-DMRs. Proportions for the same elements are also shown within SGA-DMRs (middle panel) and LGA-DMRs (bottom panel).
The known functions of the genes overlapping the BW-DMRs are shown in Supplementary Table 2. Certain commonalities are apparent. For example, a number of the BW-DMRs overlap genes that regulate transmembrane transport (KCNK9, KCNQ1, SLC2218AS, SVOPL), cell signaling (CDKN1C, GDNF, WDR27, GNAS, IGF1R, PDE4D), neurotrophic factors (GABRA5, GABRG3, GDNF, FAM196A, NTM, RGMA) and transcriptional regulation (DNMT1, L3MBTL1, RB1, TCEB3C, ZDBF2, ZNF331, ZNF396, ZNF597).
Three BW-DMRs are associated with both SGA and LGA status, and all three regions overlap paternally expressed genes. Interestingly, in the IGF1R DMR, hypermethylation with respect to AGA is observed in both SGA and LGA placenta (). Similarly, in the GABRG3 DMR, hypomethylation with respect to AGA is observed in both SGA and LGA placenta (). Distinct from these two cases, a general trend towards hypermethylation among SGA placenta and slighter tendency towards hypomethylation among LGA placenta compared to AGA placenta is observed in the MEST DMR ().
Figure 6. Methylation patterns across birth weight categories in IGF1R, MEST and GABRG3 DMRs. Average methylation in SGA (magenta) and LGA (gold) placenta are compared to AGA (grey) placenta are shown for IGF1R (a), MEST (b) and GABRG3 (c). The pink highlighted regions indicate sites overlapping both SGA and LGA DMRs. The bottom panels in A and B show the effect size estimates in the association between methylation of these sites and gene expression (eQTM).
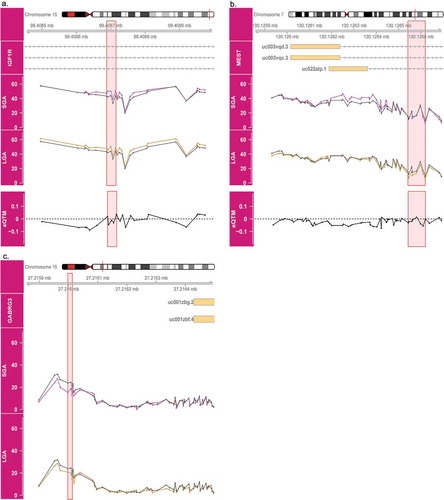
For two of the three BW-DMRs (IGF1R and MEST), expression data was available. However, no significant relationship between methylation at these sites and gene expression is observed ( and ). Furthermore, none of the BW-DMRs overlap with the identified eQTM CpGs.
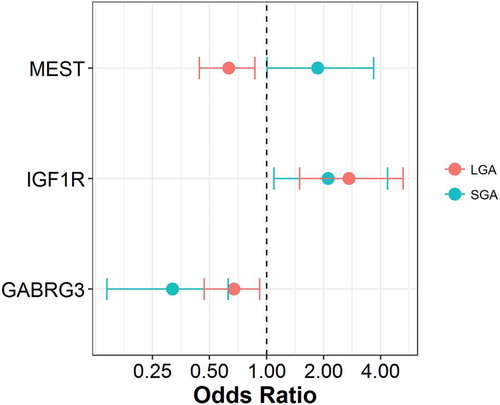
While the birth weight categories are matched on gestational age, gender and maternal age, additional maternal characteristics that vary across the categories (maternal ethnicity and gestational diabetes), were not taken into account in the DMRcate analysis (). To assess whether our identified BW-DMRs are impacted by these variables, we conducted logistic regression models, assessing the association between the methylation of peak CpG sites within BW-DMRs and the respective birth weight category, adjusting for maternal ethnicity and gestational diabetes. focuses on the three BW-DMRs associated with both SGA and LGA status. Consistent with the observations in the unadjusted BW-DMR analysis, methylation within the GABRG3 DMR is inversely associated with both SGA and LGA status, methylation within the IGF1R DMR is positively associated with both SGA and LGA status, and methylation within the MEST DMR is positively associated with SGA status and inversely associated with LGA status.
Figure 7. Associations between peak CpG sites and birth weight categories. M-values of peak CpG sites in SGA DMRs (GABRG3:chr15.27215730, IGF1R:chr15.99408691, MEST:chr7.130126384) and LGA DMRs (GABRG3:chr15.27216008, IGF1R:chr15.99408700, MEST:chr7.130126559) were modeled comparing AGA against SGA and LGA, respectively. Logistic regression models were adjusted for maternal ethnicity and gestational diabetes status.
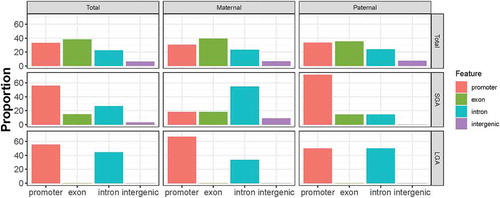
The genomic features (promoter, exon, intron, intergenic) overlapping the surveyed imprinted regions as well as the BW-DMRs are shown in . As seen in the left-hand panels, an overall shift in distribution toward promoter and intron regions is apparent among the BW-DMRs. This specification for promoter and intronic regions among LGA-DMRs is apparent irrespective of whether the LGA-DMRs overlap maternally or paternally expressed genes (bottom three panels). In contrast, among the SGA-DMRs (middle three panels), intronic regions predominate among maternally expressed SGA-DMRs, and promoter regions predominate among paternally expressed SGA-DMRs. The specification of promoter and intron regions among the BW-DMRs does not vary appreciably by ICR status (Supplementary Figure 7).
Figure 8. Genomic context of interrogated imprinted regions and identified SGA and LGA DMRs. In the depicted proportions of annotated features, regions overlapping multiple features are assigned based on the following order of precedence: promoter>exon>intron.
Discussion
The current study represents the most comprehensive survey of DNA methylation patterns across the placental imprintome, spanning both ICR and non-ICR regions. We additionally characterized the variability in these DNA methylation patterns in relation to gene expression and fetal growth.
We identified 34 SGA-related DMRs and 9 LGA-related DMRs. In addition to the greater number of identified SGA-DMRs compared to LGA-DMRs, the effect sizes observed in association with SGA status are larger than the effect sizes associated with LGA status. This may suggest that dysregulation in epigenetic patterns among imprinted genes is more relevant in undergrowth than overgrowth. Alternatively, LGA status may be a more multifactorial outcome, with underpinnings that trace to various pregnancy complications and maternal metabolic status. In the presence of multiple unrelated factors, an imprint-specific signature may be less discernable.
The genomic coordinates of three regions overlap between SGA and LGA DMRs. Interestingly, the direction of the association is consistent for two of the three BW-DMRs (GABRG3 and IGF1R). While SGA and LGA are at opposing ends of the growth spectrum, this similarity in the behavior of the BW-DMRs suggests at least some common etiology. Indeed, certain later life health effects linked to being born SGA are also linked to being born LGA. For example, energy balance dysregulation and neurobehavioral deficits are associated with both birth outcomes [Citation20,Citation21]. This suggests that SGA and LGA placenta may be related pathologies that are triggered by aberrations in common molecular pathways, and the presence of additional intrinsic or extrinsic factors may dictate the divergence towards undergrowth or overgrowth.
Unlike GABRG3 and IGF1R, we observed opposing directions of association between MEST DMR CpG methylation and SGA and LGA, respectively. This finding is consistent with a prior finding we reported in a study assessing the association between the expression of 108 imprinted genes and SGA/LGA status [Citation22]. In this previous study, the expression of nine imprinted genes was significantly associated with adverse birth weight outcomes, with the strongest effect sizes observed in association with MEST. Here, an increase in MEST expression levels was associated with increased odds of LGA status and decreased odds of SGA status. Secondary analysis of RICHS 450K methylation array data also revealed hypermethylation among SGA placenta compared to AGA placenta within MEST, consistent with our findings in the current study, providing verification across molecular features as well as technological platforms. Importantly, in the current study, we surveyed imprinted gene CpG methylation using targeted bisulfite sequencing across more extensive imprinting-related regions than the regions covered in the 450K array, and the current analysis revealed a more well-defined SGA-related MEST DMR (ch7: 130,126,384–130,126,966), slightly offset to the one described in the prior paper (chr7: 13,012,500–130,126,871).
While we observed associations between CpG methylation and gene expression, particularly among sites near the transcription start site, we did not observe a direct relationship between gene expression and methylation among CpG sites overlapping BW-DMRs. This is also the case for MEST, where we observed both methylation and expression differences comparing adverse and normal birth weight outcomes but did not discern a relationship between methylation and expression. This lack of an association does not dismiss the possibility that differential methylation at these sites informs gene activity. For example, methylation status at BW-DMRs may inform isoform-specification that alter the functionality of the transcripts, but this change may not be apparent in the detection of overall transcript levels. Specifically for MEST, knockdown of gene activity may be realized through various pathways, including post-transcriptional mRNA degradation (resulting in reduction of overall transcript levels) and reduced transcription of specific isoforms, any of which can trigger disruption of appropriate fetal growth. Alternatively, the altered methylation state may be part of a cascade of epigenetic changes, including interactions with histone modifications, resulting in altered expression among a more distal set of genes. Our results do suggest an enriched overlap for certain histone modification marks, particularly among CpG sites within the LGA-DMRs.
We observed a noteworthy parent-of-origin trend among the identified BW-DMRs, particularly among SGA-DMRs. All SGA-DMRs overlapping maternally expressed (paternally imprinted) loci are hypomethylated among SGA placenta compared to AGA placenta. This consistent methylation downregulation among maternally expressed imprinted genes is particularly striking given the overall bias towards paternally expressed imprinted genes in the placenta. Given an inverse relationship between CpG methylation and gene expression, this finding may indicate a potential bias towards the activation of maternally expressed imprinted genes among growth-restricted infants, consistent with the parental conflict theory. While we do not observe a concomitant upregulation of gene expression in proximity to the SGA-DMRs, this observation may still point to a coordinated parental effect that acts on more widespread, distal targets.
The parental allele that is expressed among genes overlapping the BW-DMRs also varies by genomic context. An overrepresentation of intronic regions is particularly evident among SGA-DMRs overlapping maternally expressed imprinted genes. The role of genomic context on how these BW-DMRs exert their effect is unclear. However, the finding that BW-DMRs do occur outside promoter regions further corroborates the possibility that methylation in these regions does not fit the established paradigm of gene expression regulation by interrupting promoter binding access of transcription factors. While promoter and upstream enhancer regions are typically considered the functionally relevant regions of the genome, particularly in the context of DNA methylation, our findings along with others [Citation23,Citation24] suggest that introns and other non-genic regions may bear more functional relevance than previously appreciated.
We did not observe noteworthy distinctions among BW-DMRs that overlap known ICRs compared to BW-DMRs that do not overlap known ICRs. An equivalent number of SGA and LGA DMRs overlap ICR and non-ICR regions. Additionally, no difference in the genomic context was observed comparing BW-DMRs overlapping ICR and non-ICR regions. These findings suggest that these imprinted loci are relevant for fetal growth related processes, and disruptions in the functionality of these genes, whether through imprint-specific processes or otherwise, can result in deviations from appropriate fetal growth.
A major strength of this study is that it represents the most comprehensive survey of imprintome-related methylation evaluated in an epidemiologic setting of term, healthy infants, to date. This study also represents an integrative approach, incorporating gene expression, DNA regulatory elements and genomic feature information to better inform the context within which changes in methylation within these BW-DMRs may exert their effect on fetal growth dysregulation. Importantly, we identified novel fetal growth-related loci, several of which are currently poorly described in the literature. In contrast, IGF2 and H19, the most commonly assessed imprinted loci in fetal growth studies, did not meaningfully contribute to deviations in fetal growth in the context of this comprehensive survey of the imprintome, a result that is consistent with other recent studies [Citation25]. Our findings also challenge other conventional notions surrounding the functional role of methylation marks in coordinating imprinted gene activity. This includes a less direct relationship with dictating transcript abundance of proximal genes and that genomic features external to promoter regions, including introns, may be of particular functional relevance. Taken together, our findings suggest potential new avenues of research to further characterize placental aberrations in imprinted genes as potential markers of fetal growth dysregulation.
Important limitations of the current study warrant mention. While the sample size of the current study represents the largest methylation profiling across the imprintome, the sample size is still limited with regards to contrasting extreme birth outcomes (LGA, SGA). Furthermore, the application of a targeted bisulfite sequencing platform enabled us to survey the imprintome more extensively than is currently feasible using established methylation microarrays. However, analytical approaches are still underdeveloped for the application of base-resolution bisulfite sequencing methods in an epidemiologic setting. Primarily, accounting for mixed cell type composition, a relevant consideration in heterogeneous tissues such as placenta, is currently not feasible. In anticipation of this issue, the placental samples collected in this cohort were specifically biopsied within 2 cm of the cord insertions site on the fetal membrane side, a region primarily consisting of trophoblast cells. Still, we cannot discount the possibility that the observed differences reported in this study may reflect differences in cell type composition rather than altered cellular processes. We also attempted to overlay our findings with existing information on additional placental epigenomic elements through the NIH Roadmap Epigenomics Mapping Consortium. Comprehensive profiling across multiple histone modifications and DNAse I hypersensitivity sites is currently available for a second trimester placenta sample. How well the epigenetic marks recorded for this sample approximate the placement of epigenetic marks among our profiled third trimester placenta samples is unclear. Following the design and production of the targeted bisulfite sequencing panel implemented in the current study, several additional studies have expanded the literature on defining placental imprinted regions [Citation26–Citation29]. While many unique regions identified across the individual studies are not captured by our study, regions consistently represented across all studies tended to overlap with the regions that informed the design of the implemented panel [Citation15], as indicated on Supplementary Table 1. Finally, while an evaluation in allele-specific methylation levels would more closely reflect imprinting, we assessed the cumulative methylation across both alleles in the current study. This was primarily motivated by the population-wide scope of the study, where the achievable sequencing depth was constrained by the sample size, undercutting the resolution needed to reliably call allele-specific methylation levels. Additionally, phasing alleles requires SNPs with a sufficient frequency of heterozygous calls. Given the identification of such SNPs, the substantial reduction in sample size to heterozygous individuals would substantially hamper evaluations of associations with respect to health outcomes. Furthermore, interpretability across our imprintome-wide survey would be limited as the set of heterozygous individuals would likely vary for each loci, depending on the interrogated SNP. Still, this limit on the resolution attained in this study impacts the interpretability of the functional relevance of our findings. Hence, additional targeted analyses at a more in-depth, allelic resolution are warranted to further characterize candidate loci of interest from the current study.
Despite these limitations, our study represents the first comprehensive characterization of the placental imprintome in a population setting. Our findings reveal growth-related methylation differences, including in previously poorly characterized imprinted regions, highlighting potentially novel placental biomarkers of growth and development.
Methods
Study population
The study was conducted in placenta samples collected from participants enrolled in the Rhode Island Child Health Study (RICHS). This hospital-based birth cohort (n = 840) recruited women undergoing healthy, non-pathologic pregnancies delivering at term (≥ 37 weeks gestation). The cohort was established with an interest to understand mechanisms underlying fetal growth abnormalities and was oversampled for infants born small for gestational age (SGA, <10% 2013 Fenton Growth Curve) and large for gestational age (LGA,>90% 2013 Fenton Growth Curve), each matched on gender, gestational age and maternal age to infants born appropriate for gestational age (AGA). Participant demographic, lifestyle and health history data were collected from interviewer administered questionnaires and anthropomorphic and clinical data were abstracted from structured reviews of medical records. All enrolled participants provided written informed consent and study protocols were approved by the institutional review boards at Women and Infants Hospital and Emory University. The current study focuses on a subset of the enrolled participants with available placental targeted bisulfite sequencing data (n = 182).
Placenta sample collection
Placental biopsies were obtained within two hours of delivery from 4 quadrants adjacent to the cord insertion site and free of maternal decidua. Samples were placed in RNALater at 4°C and subsequently pooled, snap-frozen, homogenized and stored at −80°C. Nucleic acid, including RNA and DNA, was extracted, quantified and stored at −80°C.
Assay design
Our custom designed imprintome panel included 153 imprinted loci (n = 23,582 CpG sites) (Supplementary Table 1). The selected loci were informed by prior reports [Citation15,Citation16,Citation30–Citation34] as well as internally nominated regions. The interrogated CpG sites among these loci included regions previously described as imprint control regions (ICR) [Citation15] as well as the promoters and surrounding regions of isoforms linked to each of the interrogated imprinted genes (Non-ICR). The indicated expressed parental allele is primarily based on information available from [Citation33]. For loci where information on the parental allele expressed was not available, the parental allele was inferred if the germline imprinting status is known. The source of parental allele information (known or inferred) is additionally provided in Supplementary Table 1.
Bisulfite sequencing
The NimbleGen SeqCap Epi Enrichment targeted bisulfite sequencing platform (Roche, Basel, Switzerland) was utilized to probe our regions of interest as previously described [Citation35]. Briefly, DNA (1ug) was fragmented through sonication and adapters were added. Following bisulfite conversion, DNA was amplified using adapter-specific primers. The library was hybridized to a pool of target-specific oligonucleotide probes followed by bead capture. The custom region enriched library was amplified again and sequenced using the Illumina HiSeq platform. Prior to alignment, FASTQ files were demultiplexed and assessed for sequence quality including base call quality, gc content, adapter contamination and incomplete bisulfite conversion. The reads were aligned to the genome (GRCh37/hg19 assembly) using a methylation-aware aligner (Bismark/Bowtie2). Data generation and read alignment was conducted at the Epigenomics Core Facility of Weill Cornell Medical College.
We assayed 192 placental samples, which included 182 unique samples and 10 replicates. Prior to analyzing the data, we implemented additional preprocessing of the data, including filtering of low coverage sites (<10x) with minimum coverage in at least 40% of samples and samples with a minimum of 75% of sites called. The final dataset included 21,598 CpG sites in 163 unique samples.
Statistical analysis
To assess the association between methylation and gene expression levels across the imprintome, we leveraged existing placental gene expression data on 108 imprinted genes previously generated using the NanoString nCounter platform [Citation36]. An expression quantitative trait methylation (eQTM) analysis was performed using the Matrix eQTL R package [Citation37], and cis-eQTMs were defined as gene-CpG pairs with genomic coordinates falling within 10,000 bp of each other. Multiple testing correction of the eQTM analysis was performed using the eigenMT method [Citation38]. The eQTMs were annotated based on CpG density using the annotatr R package. We identified birth weight-related differentially methylated regions (BW-DMRs) contrasting SGA and LGA infants against AGA infants using the DMRcate R package [Citation39], modeling read counts using a beta-binomial distribution with dispersion shrinkage [Citation40]. Criteria used to define BW-DMRs included setting the Gaussian kernel bandwidth at 1000 nucleotides, the bandwidth scaling factor to 50 and the minimum number of sites per region at 2 CpGs. BW-DMR annotations based on genomic context were assigned using the genomation R package [Citation41]. Genomic coordinates for epigenomic marks mapped by the NIH Roadmap Epigenomics Mapping Consortium were sourced using the DeepBlueR package [Citation42]. Information for histone modification marks (H3K27ac, H3K4me1, H3K27me3, H3K36me3, H3K4me3, H3K9me3) and DNAse I hypersensitivity sites were obtained from sample E091, a specimen harvested from a female placenta at gestational week 16. Logistic regression analyses were conducted to assess the association between CpG methylation and adverse birth weight categories (SGA/LGA vs. AGA), additionally adjusting for maternal ethnicity and maternal gestational diabetes. Methylation at peak CpG sites (CpG sites with maximum effect size within each BW-DMR) was modeled using the log2 ratio of methylated and unmethylated reads (M-values). All analyses were conducted using R version 3.4.3.
Supplemental Material
Download Zip (702.6 KB)Acknowledgments
This work is supported by NIH-NIMH R01MH094609, NIH-NIEHS R01ES022223, NIH-NIEHS R01ES022223-03S, NIH-NIEHS R24ES028507, NIH-NIEHS P30ES023515, and NIH-NIEHS K99ES029571-01. We would like to thank the Epigenomics Core at Weill Cornell, particularly Alicia Alonso and Thadeous J. Kacmarczyk, for the library preparation, sequencing and preprocessing of the generated data.
Disclosure statement
No potential conflict of interest was reported by the authors.
Supplementary material
Supplemental data for this article can be accessed here.
Additional information
Funding
Related Research Data
References
- Burton GJ, Jauniaux E. What is the placenta?. Am J Obstet Gynecol. 2015;213(4 Suppl):S6.e1-S6.e4.
- Sadovsky Y, Clifton VL, Burton GJ. Invigorating placental research through the “Human Placenta Project. Placenta. [ Internet]. 2014 cited 2018 May 15;35:527. Available from: https://www.sciencedirect.com/science/article/pii/S0143400414005931?via%3Dihub.
- Bartolomei MS, Ferguson-Smith AC. Mammalian genomic imprinting. Cold Spring Harb Perspect Biol. [ Internet]. 2011 cited 2014 Jul 14;3. Available from: http://www.pubmedcentral.nih.gov/articlerender.fcgi?artid=3119911&tool=pmcentrez&rendertype=abstract.
- Renfree MB, Suzuki S, Kaneko-Ishino T. The origin and evolution of genomic imprinting and viviparity in mammals. Philos Trans R Soc Lond B Biol Sci. [ Internet]. 2013 cited 2014 Aug 15;368:20120151. Available from: http://www.pubmedcentral.nih.gov/articlerender.fcgi?artid=3539366&tool=pmcentrez&rendertype=abstract.
- Moore T, Haig D. Genomic imprinting in mammalian development: a parental tug-of-war. Trends Genet. [ Internet]. 1991 cited 2014 Aug 27;7:45–49. Available from: http://www.ncbi.nlm.nih.gov/pubmed/2035190.
- Patten MM, Ross L, Curley JP, et al. The evolution of genomic imprinting: theories, predictions and empirical tests. Heredity (Edinb). [ Internet]. 2014 cited 2018 May 15;113:119–128. Available from: http://www.ncbi.nlm.nih.gov/pubmed/24755983.
- Choufani S, Shuman C, Weksberg R. Molecular findings in Beckwith-Wiedemann syndrome. Am J Med Genet C Semin Med Genet. [ Internet]. 2013 cited 2014 Aug 20;163C:131–140. Available from: http://www.ncbi.nlm.nih.gov/pubmed/23592339.
- Azzi S, Abi Habib W, Netchine I. Beckwith-Wiedemann and Russell-Silver Syndromes: from new molecular insights to the comprehension of imprinting regulation. Curr Opin Endocrinol Diabetes Obes. [ Internet]. 2014 cited 2014 Aug 29;21:30–38. Available from: http://www.ncbi.nlm.nih.gov/pubmed/24322424.
- Prats-Puig A, Carreras-Badosa G, Bassols J, et al. The placental imprinted DLK1-DIO3 domain: a new link to prenatal and postnatal growth in humans. Am J Obstet Gynecol. [ Internet]. 2017 cited 2018 May 15;217:350.e1-350.e13. Available from: http://www.ncbi.nlm.nih.gov/pubmed/28502757.
- St-Pierre J, Hivert M-F, Perron P, et al. IGF2 DNA methylation is a modulator of newborn’s fetal growth and development. Epigenetics. [ Internet]. 2012 cited 2015 Jan 27;7:1125–1132. Available from: http://www.pubmedcentral.nih.gov/articlerender.fcgi?artid=3469454&tool=pmcentrez&rendertype=abstract.
- Koukoura O, Sifakis S, Soufla G, et al. Loss of imprinting and aberrant methylation of IGF2 in placentas from pregnancies complicated with fetal growth restriction. Int J Mol Med. [ Internet]. 2011 cited 2018 May 15;28:481–487. Available from: http://www.spandidos-publications.com/10.3892/ijmm.2011.754.
- Gao W, Li D, Xiao Z, et al. Detection of global DNA methylation and paternally imprinted H19 gene methylation in preeclamptic placentas. Hypertens Res. [ Internet]. 2011 cited 2018 May 15;34:655–661. Available from: http://www.nature.com/articles/hr20119.
- Bourque DK, Avila L, Peñaherrera M, et al. Decreased placental methylation at the H19/IGF2 imprinting control region is associated with normotensive intrauterine growth restriction but not preeclampsia. Placenta. [ Internet]. 2010 cited 2018 May 15;31:197–202. Available from: http://linkinghub.elsevier.com/retrieve/pii/S0143400409003932.
- Guo L, Choufani S, Ferreira J, et al. Altered gene expression and methylation of the human chromosome 11 imprinted region in small for gestational age (SGA) placentae. Dev Biol. [ Internet]. 2008 cited 2018 May 15;320:79–91. Available from: http://www.ncbi.nlm.nih.gov/pubmed/18550048.
- Court F, Tayama C, Romanelli V, et al. Genome-wide parent-of-origin DNA methylation analysis reveals the intricacies of human imprinting and suggests a germline methylation-independent mechanism of establishment. Genome Res. [ Internet]. 2014 cited 2014 Aug 29;24:554–569. Available from: http://www.pubmedcentral.nih.gov/articlerender.fcgi?artid=3975056&tool=pmcentrez&rendertype=abstract.
- Joshi RS, Garg P, Zaitlen N, et al. DNA Methylation Profiling of Uniparental Disomy Subjects Provides a Map of Parental Epigenetic Bias in the Human Genome. Am J Hum Genet. [ Internet]. 2016 cited 2018 May 15;99:555–566. Available from: http://www.ncbi.nlm.nih.gov/pubmed/27569549.
- Wang X, Miller DC, Harman R, et al. Paternally expressed genes predominate in the placenta. Proc Natl Acad Sci. [ Internet]. 2013 cited 2018 Jun 28;110:10705–10710. Available from: http://www.pnas.org/cgi/doi/10.1073/pnas.1308998110.
- Bernstein BE, Stamatoyannopoulos JA, Costello JF, et al. The NIH Roadmap Epigenomics Mapping Consortium. Nat Biotechnol. [ Internet]. 2010 cited 2019 Jan 2;28:1045–1048. Available from: http://www.ncbi.nlm.nih.gov/pubmed/20944595.
- Kundaje A, Meuleman W, Ernst J, et al. Integrative analysis of 111 reference human epigenomes. Nature. [ Internet]. 2015 cited 2019 Jan 2;518:317–330. Available from: http://www.ncbi.nlm.nih.gov/pubmed/25693563.
- Boney CM, Verma A, Tucker R, et al. Metabolic syndrome in childhood: association with birth weight, maternal obesity, and gestational diabetes mellitus. Pediatrics. [ Internet]. 2005 cited 2015 Jan 22;115:e290–6. Available from: http://www.ncbi.nlm.nih.gov/pubmed/15741354.
- Van Lieshout RJ, Boyle MH. Canadian youth born large or small for gestational age and externalizing and internalizing problems. Can J Psychiatry. [ Internet]. 2011 cited 2015 Feb 4;56:227–234. Available from: http://www.ncbi.nlm.nih.gov/pubmed/21507279.
- Kappil MA, Green BB, Armstrong DA, et al. Placental expression profile of imprinted genes impacts birth weight. Epigenetics. 2015;10:842–849.
- Maunakea AK, Nagarajan RP, Bilenky M, et al. Conserved role of intragenic DNA methylation in regulating alternative promoters. Nature. [ Internet]. 2010 cited 2016 Oct 17;466:253–257. Available from: http://www.ncbi.nlm.nih.gov/pubmed/20613842.
- Lev Maor G, Yearim A, Ast G. The alternative role of DNA methylation in splicing regulation. Trends Genet. [ Internet]. 2015 cited 2019 May 23;31:274–280. Available from: http://www.ncbi.nlm.nih.gov/pubmed/25837375.
- Iglesias-Platas I, Martín Trujillo A, Court F, et al. Distinct promoter methylation and isoform-specific expression of RASFF1A in placental biopsies from complicated pregnancies. Placenta. [ Internet]. 2015 cited 2018 Jun 27;36:397–402. Available from: http://www.ncbi.nlm.nih.gov/pubmed/25703593.
- Hanna CW, Peñaherrera MS, Saadeh H, et al. Pervasive polymorphic imprinted methylation in the human placenta. Genome Res. [ Internet]. 2016 cited 2019 Jun 3;26:756–767. Available from: http://www.ncbi.nlm.nih.gov/pubmed/26769960.
- Hamada H, Okae H, Toh H, et al. Allele-specific methylome and transcriptome analysis reveals widespread imprinting in the human placenta. Am J Hum Genet. [ Internet]. 2016 cited 2019 Jun 3;99:1045–1058. Available from: http://www.ncbi.nlm.nih.gov/pubmed/27843122.
- Sanchez-Delgado M, Court F, Vidal E, et al. Human oocyte-derived methylation differences persist in the placenta revealing widespread transient imprinting. Bartolomei MS, editor. PLoS Genet. [ Internet]. 2016;12:e1006427. cited 2019 Jun 3. .
- Joshi RS, Garg P, Zaitlen N, et al. DNA methylation profiling of uniparental disomy subjects provides a map of parental epigenetic bias in the human genome. Am J Hum Genet. [ Internet]. 2016 cited 2019 Mar 19;99:555–566. Available from: http://www.ncbi.nlm.nih.gov/pubmed/27569549.
- Maynard ND, Chen J, Stuart RK, et al. Genome-wide mapping of allele-specific protein-DNA interactions in human cells. Nat Methods. [ Internet]. 2008 cited 2019 Mar 19;5:307–309. Available from: http://www.ncbi.nlm.nih.gov/pubmed/18345007.
- Prickett AR, Ishida M, Böhm S, et al. Genome-wide methylation analysis in Silver–russell syndrome patients. Hum Genet. [ Internet]. 2015 cited 2019 Mar 19;134:317–332. Available from: http://www.ncbi.nlm.nih.gov/pubmed/25563730.
- Diplas AI, Lambertini L, Lee M-J, et al. Differential expression of imprinted genes in normal and IUGR human placentas. Epigenetics. [ Internet]. 2009 cited 2015 Jul 13;4:235–240. Available from: http://www.ncbi.nlm.nih.gov/pubmed/19483473.
- Jirtle RL geneimprint [ Internet]. 2012. Available from: http://www.geneimprint.com.
- Morison IM, Ramsay JP, Spencer HG. A census of mammalian imprinting. Trends Genet. [ Internet]. 2005 cited 2014 Sep 8;21:457–465. Available from: http://www.ncbi.nlm.nih.gov/pubmed/15990197.
- Wang H, Bender A, Wang P, et al. Insights into beta cell regeneration for diabetes via integration of molecular landscapes in human insulinomas. Nat Commun. [ Internet]. 2017 cited 2019 Jan 9;8:767. Available from: http://www.ncbi.nlm.nih.gov/pubmed/28974674.
- Kappil MA, Green BB, Armstrong DA, et al. Placental Expression Profile of Imprinted Genes Impacts Birth Weight. Epigenetics [ Internet]. 2015 cited 2015 Jul 28; Available from: http://www.ncbi.nlm.nih.gov/pubmed/26186239.
- Shabalin AA. Matrix eQTL: ultra fast eQTL analysis via large matrix operations. Bioinformatics. [ Internet]. 2012 cited 2018 May 21;28:1353–1358. Available from: http://www.ncbi.nlm.nih.gov/pubmed/22492648.
- Davis JR, Fresard L, Knowles DA, et al. An efficient multiple-testing adjustment for eQTL studies that accounts for linkage disequilibrium between variants. Am J Hum Genet. [ Internet]. 2016 cited 2018 Jun 13;98:216–224. Available from: http://linkinghub.elsevier.com/retrieve/pii/S0002929715004929.
- Peters TJ, Buckley MJ, Statham AL, et al. De novo identification of differentially methylated regions in the human genome [Internet]. Epigenetics Chromatin. 2015 [cited 2015 Mar 10]. Available from: http://www.epigeneticsandchromatin.com/content/pdf/1756-8935-8-6.pdf.
- Feng H, Conneely KN, Wu H. A Bayesian hierarchical model to detect differentially methylated loci from single nucleotide resolution sequencing data. Nucleic Acids Res. [ Internet]. 2014 cited 2018 Jun 18;42:e69–e69. Available from: http://www.ncbi.nlm.nih.gov/pubmed/24561809.
- Akalin A, Franke V, Vlahoviček K, et al. Genomation: a toolkit to summarize, annotate and visualize genomic intervals. Bioinformatics. [ Internet]. 2015 cited 2018 Jun 18;31:1127–1129. Available from: https://academic.oup.com/bioinformatics/article-lookup/doi/10.1093/bioinformatics/btu775.
- Albrecht F, List M, Bock C, et al. DeepBlueR: large-scale epigenomic analysis in R. Wren J, editor. Bioinformatics. [ Internet]. 2017 cited 2019 Jan 2;33:2063–2064. Available from: https://academic.oup.com/bioinformatics/article/33/13/2063/3045024.