
ABSTRACT
Chromatin-mediated silencing, including the formation of heterochromatin, silent chromosome territories, and repressed gene promoters, acts to stabilize patterns of gene regulation and the physical structure of the genome. Reduction of chromatin-mediated silencing can result in genome rearrangements, particularly at intrinsically unstable regions of the genome such as transposons, satellite repeats, and repetitive gene clusters including the rRNA gene clusters (rDNA). It is thus expected that mutational or environmental conditions that compromise heterochromatin function might cause genome instability, and diseases associated with decreased epigenetic stability might exhibit genome changes as part of their aetiology. We find the support of this hypothesis in invasive ductal breast carcinoma, in which reduced epigenetic silencing has been previously described, by using a facile method to quantify rDNA copy number in biopsied breast tumours and pair-matched healthy tissue. We found that rDNA and satellite DNA sequences had significant copy number variation – both losses and gains of copies – compared to healthy tissue, arguing that these genome rearrangements are common in developing breast cancer. Thus, any proposed aetiology onset or progression of breast cancer should consider alterations to the epigenome, but must also accommodate concomitant changes to genome sequence at heterochromatic loci.
Introduction
The human genome contains significant amounts of repetitive sequences. Many of the most repetitious – the alphoid satellite repeats, Satellites-I, -II, and -III, and the telomeres – may consist of kilobases up to megabases of nearly identical repeats that, if damaged, may repair using sister chromatids, homologous chromosomes, non-homologues, or even repeats in cis as repair templates [Citation1–Citation8]. Such events may generate interchromatid crossovers, translocations, acentric/dicentric chromosomes, repeat expansions and contractions, and/or extrachromosomal circles. Normally, these genome-damaging repair events are disfavoured by the packaging of repetitive sequences as constitutive heterochromatin, usually chemically hallmarked by histone H3 lysine 9 methylation, association with the heterochromatin protein HP1a, histone hypoacetylation, and expansive DNA methylation [Citation9–Citation11]. Heterochromatin potentiates pairing, regulates repair, and inhibits recombination. For example, in Drosophila special repair processes disfavour non-allelic crossovers during repair of double-strand breaks in heterochromatin [Citation12,Citation13]. Mutations in Drosophila that compromise heterochromatin formation allow recombination within constitutive centric heterochromatin and at telomeres [Citation14,Citation15], deregulates telomere length [Citation16,Citation17], destabilizes repeat gene clusters [Citation18], and derepresses expression of genes transposed into heterochromatic repeats [Citation9]. Heterochromatin is considered a prime example of epigenetic gene regulation because silencing and genome stability are stochastic at these loci, variations in the degree of silencing does not correspond to genome changes, and the silencing and stabilizing effects of heterochromatin are transmitted through S-phase [Citation11,Citation19]. Whether such processes exist in other organisms is not yet know, but mutations in the DNA methyltransferases of mouse and humans compromise heterochromatin formation, leading to hypervariability – predominantly loss – of satellite copy number, and derepression of transposable elements [Citation20].
In Drosophila, many mutational, developmental, and environmental factors affect heterochromatin stability [Citation21]. Reduction through any of these means may lead to instability of the repeat sequences replete in the Drosophila genome [Citation22]. Some expressed genes are organized as tandem repeats and, for unknown reasons, are generally subject to epigenetic regulation such that the arrays consist of interspersed expressed and non-expressed copies despite identical sequence [Citation23–Citation25]. This is perhaps a strategy to maximize both expression and stability, but it renders such genes particularly sensitive to loss and gain in conditions that reduce heterochromatin formation or function as these gene arrays are only partially packaged as silenced heterochromatin. We and others have observed that the 18S/5.8S/28S ribosomal RNA gene cluster (henceforth referred to as the ‘45S rDNA,’ from the human nomenclature) is a sensitive locus of copy number changes in Drosophila induced by mutation or by ecological conditions [Citation22,Citation26,Citation27]. This is expected to be broadly pleiotropic to a cell since the rDNA not only controls rRNA production and translational capacity, but the rDNA also mediates other processes regulated by the nucleolus [Citation28–Citation31]. These processes are not fully investigated, nor is the roster of roles in regulating cell-biological responses mediated by the nucleolus fully enumerated. Recently, hints at function in radiation sensitivity and DNA repair, stress response, metabolic rate, and developmental decisions, have become more concrete. Even vaguer notions of roles, such as in ‘stability’ or ‘heterochromatin formation’ have been confirmed and expanded, suggesting that the pleiotropy of rDNA copy number may expand well-beyond the expected impacts on protein synthesis and include many more aspects of nuclear function such as telomere maintenance, transposable element silencing, satellite DNA stability, and others [Citation32–Citation34].
Heterochromatin formation and regulation is not well understood in humans, especially during disease onset and progression, although there is evidence that some diseases may have heterochromatin loss and repeat instability as part of their complex aetiology [Citation35–Citation40]. Breast cancers, along with leukaemias and lymphomas, colorectal cancers, and others, are known to involve expansive genome instability, including chromosome aneuploidies and rearrangements [Citation41–Citation44]. These cancers, and others, are expected to show defects in rDNA regulation because of the cytological presence of Argyrophilic Nucleolar Organizers (AgNORs), silver-stained multiple or aberrant nucleoli. It is not known whether AgNORs are the manifestation of extrachromosomal circles resulting from damage and incorrect repair of the rDNA, as they appear to be in Drosophila. If AgNORs, rDNA loss, and nucleolar defects share common features, then one may reasonably expect that AgNORs and disease-related changes to rDNA copy number may portend changes in stress response, differentiation program, DNA damage response, metabolism, chromosome structural stability, epigenetic instabilities, or other nucleolus-related processes.
In breast cancer, de novo mutations and copy number variations are known to exist but have been difficult to quantify or monitor because of the heterogeneity of typical tumours in situ, thus much of the mutation and copy number mutational analyses have been investigated using cell cultures which can be made clonal and grown to large numbers [Citation31]. Studies investigating copy number changes in cancer have so-far analyzed such changes in the context of adaptive advantage by the cancer phenotype [Citation1,Citation45], but find them to be small and variable in scope, and without any phenotypic consequence. Some cell lines may show distinct interline differences in rDNA copy number, but it is not known whether these existed prior to, or as a consequence of, culturing [Citation46,Citation47]. The large variation in natural and presumably healthy human rDNA copy number [Citation8] also raises the possibility that the ‘aberrant’ copy numbers in these cell lines are merely captured isolates from within natural human population variation [Citation47]. Although copy number variation analysis is progressing with the advent of new low-copy-number sequencing technologies [Citation31], repetitious regions of the genome remain difficult to analyze. Repeated DNAs including the rDNA continue to be under-reported in databases or under-investigated in the literature, either because they do not have a tradition of being considered as mutagenic or capable or regulatory function, or because they are refractory to sequencing technologies and assemblies. It is routine to cull these sequences from databases prior to curation or analysis, and even those few reported analyses have not been confirmed as accurate using other methods [Citation27].
The role of rDNA copy number variation in populations or single cells, or any changes in somatic tissues linked to disease risk, onset, or severity, will remain hypothetical until we have an easy way to ascertain rDNA copy number from small samples. It is with this intention that these studies were undertaken. Herein, we describe a method to rapidly quantify rDNA copy number from fresh or stored human samples and show it is robust and sensitive, exceeding other techniques that rely on bioinformatic analyses. We employed this method to characterize rDNA copy number in breast tumour samples and neighbouring non-tumour cells, discovering that rDNA copy numbers are discordant in the two samples. Notably, in some tumours the copy number of rDNA decreases, and in others, it increases. These findings challenge the previous common notions that rDNA copy numbers increase in cancers (to accommodate increased cell division rates) or that they decrease (as a consequence of genome instability). Rather, we propose that rDNA copy numbers generally become unstable as the stabilizing effects of heterochromatin are compromised by tumour progression.
Results and discussion
Real-time (quantitative) PCR (qPCR) has been used effectively for rDNA copy number determination in Drosophila [Citation26,Citation48]. The benefit of this approach is that it provides robust and sensitive copy number determination with small amounts of genomic DNA extracted from fresh or fixed tissue, and at low cost. The preparation of tissue is technically simple and rapidly done. We applied this general approach to human tissues, where the sensitivity and low cost allowed investigation of rDNA copy number changes in small samples, and from many individuals across large populations.
Design and validation of real-time quantitative PCR primers for copy number determination
Based on validated primer design for quantifying rDNA copy number in Drosophila [Citation26], we designed six primers to amplify three regions of the human 45S pre-rRNA transcription unit, two sets directed at sequences in the 18S region (h18S.1 paired with h18S.2, and h18S.3 paired with h18S.4), and one set directed at the 28S region (h28S.1 and h28S.2) (). Primer sets amplified approximately 100 base pair regions of the rRNA genes with comparable annealing temperatures (). Primer sets were verified by amplifying rDNA segments from whole genomic DNA isolated from blood drawn from an apparently healthy 46-y-old white male with European ancestry and no known family history of cancer. This has been the lab standard for normalization between samples, experiments, or technical replicates.
Table 1. Characteristics of real-time PCR primers in this study.
Figure 1. Schematic map of the ribosomal DNA (rDNA) Repeat and validation of the Real-Time/quantitative PCR (qPCR) approach taken in this study. (a) The 45S rDNA repeat showing how the structure of the 45S primary rRNA transcription unit corresponds to the post-processed 18S, 5.8S, and 28S rRNA subunits. Locations of the primer sets are indicated. NTS = Non-transcribed Spacer, IGS = Intergenic Spacer, ETS = External transcribed spacer/sequence, ITS = Internal transcribed spacers/sequences. (b) Responsiveness of qPCR crossing thresholds (Ct) to DNA concentration for three different primer sets in (A) (see also ), including regression coefficient m (of y = mx+b) and coefficient of determination (R2) of the lines. Graphs that do not have numerical ordinal values share an ordinate with other graphs in the same row. (c) Correlations between qPCR amplifications of the subunits of the 45S unit at four different DNA concentrations (from left to right, 0.1 ng, 1 ng, 10 ng, and 100 ng). (d) Determination of human 18S rDNA copy number (using 18S.12 primer set) from 10 ng template DNA, by normalization to human tRNAMet gene copy number (see ), in the presence of different concentrations of competing Drosophila DNA. (e) Determination of human rDNA copy number from varied amounts of template DNA, by normalization to human tRNAMet gene copy number, in the presence of competing Drosophila genomic DNA such that the total concentration of template DNA was kept constant at 16 ng. Data from (D) are included in this graph as the green, yellow, and orange data points. (f) Correlation between copy number determination of enhanced GFP (eGFP) and human Bloom Syndrome helicase (BLM) from cell lines bearing stable integrations of varied copy numbers of a BLM::eGFP fusion transgene. Throughout this figure, error bars indicate standard error of the mean (S.E.M.) for triplicate or quadruplicate technical reactions.
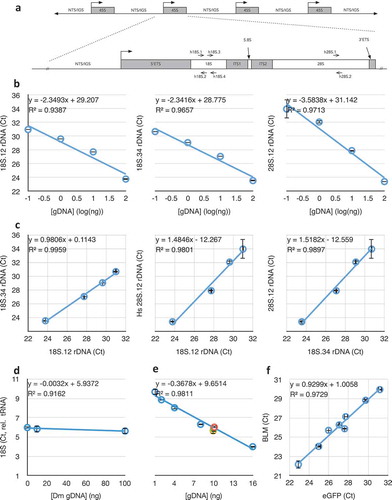
Target rDNA sequences are under strong selective pressure and are not known to vary between individuals or between repeat units within individuals [Citation49–Citation54]. Without known exception among eukaryotes, the 18S and 28S rRNA subunits of the ribosome are transcribed as a single pre-rRNA transcript from the 45S rDNA gene, then post-processed in the nucleolus into independent structural ribosomal RNAs (rRNAs). As such, we expected a strong correlation between the two 18S targets’ and between the 18S and 28S targets’ copy numbers, as we are aware of no mechanism or rearrangement in any organism that breaks the fundamental correlation of these two co-transcribed subunit sequences. We validated rDNA copy number determination across a 100-fold dilution range for both 18S and the 28S target sequences, centred on 10 nanograms per reaction, which was empirically determined to be the most robust in studies of Drosophila rDNA copy number [Citation48]. Coefficients of determination of 0.94, 0.97, and 0.97, respectively (), and coefficients of determination of 1.0, 0.98, and 0.99 for pairwise comparisons () confirmed the robustness of the primer sequences in quantifying rDNA copy number, even from low DNA concentration samples (1 ng/reaction). These regressions are much stronger than those reported in other studies using other techniques [Citation27], which is an indicator that qPCR may yield more accurate data than high-throughput sequencing in determining copy number. The ability to perform multiple reactions also allows us to evaluate accuracy in copy number determination. Recalculation of regression excluding the 10 nanogram data points did the least to alter these values, suggesting this concentration is most robust, as in Drosophila. Henceforth, in this study, unless otherwise indicated, rDNA copy number determinations were done with 10 nanograms of genomic DNA per individual reaction, performed at least in triplicate. This amount of template DNA is well within an acceptable range of DNA yield from dried blood cards (average yield > 500 ng/1 cm2), fresh unspun blood (average yield > 100 µg/200 µL whole blood), or FFPE sections (average yield ~ 500 ng/five 10 µm sections). Although we did not test multiple DNA sources from any single individual, the consistency of low- and single-copy number genes (see below) across all samples at all concentrations suggests the source/storage of DNA does not detectably affect copy number determination.
To compare relative rDNA copy numbers between different samples, we designed primers to three tRNA genes. Each is multicopy, but their distributed location throughout the genome makes them relatively stable in copy number provided the genomes in question are free from overlapping segmental duplications or deficiencies (i.e., copy number variations), or from chromosomal aneuploidies. To assure that these would be minor sources of error, we also designed primers to multiple single-copy genes amplified in normal cells (Materials and Methods). DNA extracted from the same male peripheral blood and from unrelated primary male human foreskin fibroblast cultures were tested for copy numbers of each tRNA and each single-copy gene.
Specificity of amplified and quantified sequences were confirmed by analysis of the post-hoc melt-curves for each of the rRNA and tRNA sequences, each primer set producing a single peak in a graph of the first-order derivative of fluorescence change with respect to temperature. In each case, high-concentration (1.7%) agarose gel electrophoresis was performed and a band of the expected size was the only visible PCR product. Sanger sequencing of five individual reactions further confirmed that the population of amplified DNA was homogenous and corresponded to the desired target sequence. In our hands, the primer sets directed at tRNAMet and 18S.12 performed the best, so unless otherwise indicated these are used for the remainder of the work.
We challenged quantitative amplification of human rDNA (and tRNA gene) in two ways. First, we held constant the concentration of human DNA and challenged it with no, 10 nanograms (equivalent mass of DNA), and 100 nanograms (10-fold excess) of Drosophila genomic DNA. Given the approximate 10-fold larger genome size of humans than of Drosophila, the last condition represents an approximate 100 gene-molar excess of the single-copy genes. Although rDNA copy numbers vary within both humans and Drosophila, they can be considered approximately equal in copy number in broad populations [Citation8]. Comparable sequences between these two species are less than perfectly complementary (95% for the 18S.2 primer, 91% and 64% for the 18S.34 set, and 89% for the 28S.1 primer, ), despite being in conserved regions of the rRNAs. Even with molar excess of Drosophila genomic rDNA target, there was no detectable difference in human rDNA quantification (); the coefficient of determination was very high, and the regression coefficient was near-zero (m = −0.003), suggesting that competing Drosophila DNA had no measurable impact on quantification of human rDNA copy number.
Second, we challenged human rDNA amplification by titrating the human DNA to correspond with increased titer of Drosophila DNA, keeping the total amount of genomic DNA constant at 16 nanograms. In this configuration, the molar-competition spans from 0 to 150-fold gene-molar excess but at a 10-fold lower DNA concentration than the previous experiment, and again we detected no difference in rDNA copy number relative to tRNA normalization (, R2 = 0.98). Based on these two competitive experiments, we conclude that the quantification of rDNA copy number in humans is remarkably robust to DNA concentration, even when in competition with vast excess of a homologous ‘contaminating’ animal DNA. We expect that contamination by organisms more-diverged than animals (e.g., bacteria, fungi) would be of negligible concern in routine laboratory applications.
A similar analysis was performed using rDNA and tRNA gene copy number with three single-copy genes. Without exception, copy numbers of rDNA and tRNA relative to these ‘denominator’ copy numbers were consistent across the range of concentrations used above (R2 for Rnmt2 (Gene ID: 1787) was 0.98 over the same concentration range shown in , R2 for Snail2 (Gene ID: 6591) was 0.99, R2 for Bloom Helicase (Gene ID: 641) was 0.98). Finally, we confirmed the sensitivity and robustness of relative copy number determination of the last gene by using a series of established Bloom Syndrome cell line clones (all derived from a precursor GM08505 strain), each containing stably transformed (i.e., integrated) BLM-GFP fusion genes. Eight sub-lines have different numbers and loci of integrations, but BLM and GFP sequences always co-varied (R2 = 0.97, ).
It is critical to emphasize that absolute copy number comparisons of rDNA, tRNA gene, and unique genes are not possible. This is the unavoidable expectation, as copy number is derived from qPCR reaction crossing thresholds (Cts), which are affected by primer sequence, annealing kinetics and temperature, the length and sequence composition of the inter-primer sequence, subtle sequence biases in SYBR binding, etc. For this reason, while comparisons of relative copy number between samples or conditions are valid, absolute determination of copy number of one gene relative to another in any one sample is certainly not. This is clear from the data of , where the Y-intercept of a known 1-to-1 correlation is not zero (b = 1.01).
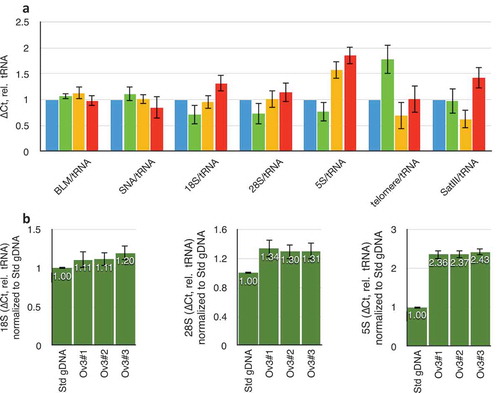
Relative amplification of single-copy and tRNA genes were compared between male blood and genomic DNA extracted from tissue sections from ovaries of three healthy human women. tRNA/single-copy genes did not vary, although rDNA, telomeric repeats, and satellites did (). This situation is expected given the known variation in these repetitive sequences between individuals in the population. Three genomic DNA preparations from three sequential sections of the same ovarian tissue showed rDNA repeat determinations to be robust across technical replicates ().
Figure 2. Variation in repeat DNA copy number in different individuals. (a) Variation in copy numbers of single-copy genes (BLM and SNA), three rDNA targets (18S, 28S, and 5S), telomeric repeats, and satellite-III, relative to tRNAMet. Blue data are from the laboratory standard DNA, and are by definition set to unity. Green, yellow, and red datasets are from three different individual ovaries obtained from the Univeristy of Arizona Tissue Acquisition and Cellular/Molecular Analysis Shared Resource without any identifying information. (b) Data obtained from three consecutive sections of one individual ovary. ‘Std gDNA’ is the laboratory standard human genomic DNA from peripheral blood. Throughout this figure, error bars indicate standard error of the mean (S.E.M.) for triplicate or quadruplicate technical reactions. S.E.M. from the laboratory standard is pooled into the data from the other individuals’ values.
Epigenetic instabilities in breast cancer – AgNOR to rDNA loss?
Breast cancer is among one of the cancers with clear cytological manifestations of nucleolar instability [Citation55–Citation58]. The presence of supernumerary argyrophilic nucleolar organizing regions (AgNORs) is interpreted as either fragmentation of nucleoli or the derepression of inactive rDNA arrays (or both). In Drosophila, presence of supernumerary nucleoli correlates with rDNA excision to create extrachromosomal circles of rDNA genes [Citation5], likely a result of derepression, damage, and repair from template copies in cis [Citation22,Citation59]. Further, the appearance of supernumerary or ‘fragmented’ nucleoli correlates with the severity of rDNA loss, as is expected from a simple excision of acentric rDNA extrachromosomal circles followed by a cell division [Citation33]. Whether AgNORs present in breast cancer tumours correspond to rDNA copy number loss in those tumours is not known.
We obtained 29 samples of breast cancer tumours (). Tumours were from invasive ductal carcinomas with evidence for lymph node metastases, and were of various genetic subtypes – Estrogen Receptor positive or negative, Progesterone Receptor positive or negative, HER2 over-expression or not (typed on the 0–3+ scale, where 1–2 were taken as negative), and of varied Ki-67 scores; two were ‘triple-negative’ and had Ki-67 fractions of 90%. In each case, formalin-fixed paraffin-embedded tumour tissues were obtained and two sequential 10 µm slices made. The first was haemotoxilin-eosin stained to define tumour tissue and healthy marginal tissue from the same patient sample. We attempted to normalize areas on the slides with similar cell numbers, avoiding connective tissue and adipose when possible. Tumour and non-tumour areas were marked, and the corresponding areas on the unstained second section were scraped and DNA isolated using filter-binding after xylenes extraction. For each paired sample, we determined tRNAM-AUG gene, 18S, 28S, and 5S rDNA copy numbers. Throughout our samples, when tumour and non-tumour samples are independently analyzed, the 18S and 28S remained correlated, further indicating bona fide changes in 45S rDNA copy number and not artefactual vagaries of DNA extraction or the qPCR reactions.
Table 2. Demographics of breast samples.
By analyzing 28S/tRNA as a function of 18S/tRNA separately for both tumour (, red) and non-tumour (blue) samples, we could conclude that the expected 28S-18S correlation exists and is of equal slope (regression coefficients of 1.83 for tumour and 1.66 for non-tumour, both statistically indistinguishable from the slope of 1.5 representing linearity, as in ) and correlation (R2 = 0.74 for tumour and 0.53 for non-tumour) for both types of tissues. The difference in coefficients of determination is likely due to a larger experimental error in the tumour-derived samples. Thus, we conclude that the overall rDNA array structure remains unaffected in tumours, suggesting that any changes in copy number would involve addition or subtraction of whole 45S rRNA genes, rather than amplification/loss of the 18S or 28S independently. We also detected that the relative rDNA copy numbers span the same ranges, with no strong evidence for any bias in the spread of values in tumour or non-tumour samples (). But it is likely that the high variation in copy numbers between individuals might obscure any differences in rDNA copy numbers within individuals as a result of the disease.
Figure 3. Comparisons of rDNA copy number changes in breast cancer tumours. (a) Correlation of 18S and 28S rDNA copy numbers is retained in both tumour (red) and non-tumour (blue) samples. (b) Data from (A) projected into one dimension to visualize the spread of individual data points. Black lines show the means. ‘nT’ = non-tumour, ‘T’ = tumour. The ordinal scale is shared with (a). (c) Plot of differences in 18S and in 5S rDNA copy numbers between tumour and non-tumour samples from the same individual. Black heavy lines highlight 0,0 origin, indicative of no change between 5S and/or 18S copy number between tumour and non-tumour; deviation from the origin is indicative of differences in one or both copy numbers. (d) As in (c), but comparing differences in 28S and 5S rDNA copy numbers. (e) Replotting of the absolute value of the data from 3C and 3D to highlight the discordance in the extent of changes to the 5S and 45S rDNA copy numbers. Throughout this figure, error bars indicate standard error of the mean (S.E.M.) for triplicate or quadruplicate technical reactions.
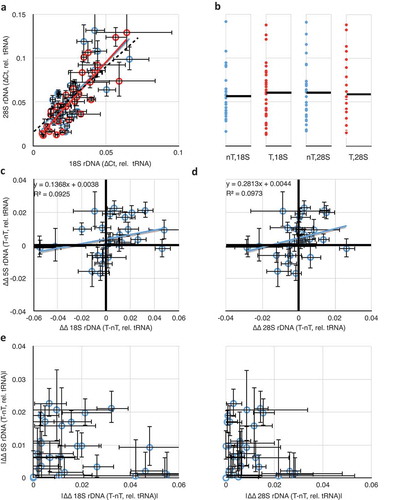
To more sensitively detect changes in rDNA copy number, we analyzed the data from as paired (tumour and non-tumour from the same individual biopsy) samples. We considered 5S rDNA copy number changes by plotting the difference between tumour 5S/tRNA and non-tumour 5S/tRNA (5ST/tRNAT – 5SnT/tRNAnT) as a function of the differences between 18S rDNA copy number changes (18ST/tRNAT – 18SnT/tRNAnT) () or 28S rDNA copy number changes (). In both cases, we could clearly detect individuals with altered rDNA copy numbers (both 18S/28S and 5S) in tumours compared to non-tumours as those data that deviated from the 0,0 origin. In about half, a clear difference in rDNA copy number was detectable between tumour and non-tumour tissue from the same patient. For example, in 10 (of 29) samples, the copy number of 28S rDNA was larger in the tumour relative to the non-tumour, with an average gain of 26% and a population deviation of 15%, and in 6 (of 29) it was smaller, with an average loss of 22% ± 11%. For the 5S, 10 samples showed an increase in rDNA copy number (21% ± 9%), and four showed a decrease (16% ± 9%). As expected from , differences in 18S and 28S copy number retained their linear relationships with R2 = 0.83 and a regression coefficient of 1.84.
We plotted the absolute value of differences in 5S as a function of differences in 18S or 28S () to demonstrate that changes in the copy numbers of rRNA genes in these two clusters are not themselves correlated positively or negatively (R2 of 0.02 and 0.04, respectively). Thus, it is equally likely in any given tumour sample with an increase in 45S rDNA copy number to have an increase or a decrease in 5S copy number, and decreases in 45S are not enriched for either increases or decreases in 5S. These results suggest that the changes to the 45S and 5S rDNA clusters are independent, and the degrees of changes are uncorrelated. Our finding adds illuminating detail to a previous report [Citation45], which showed increases in 5S and decreases in 45S copy numbers in multiple cancers (including breast cancer) but did not analyze co-relation in the same individual. We detect hyper-variability rather than uniform increases or decreases, indicating that the reported correlation between 45S and 5S rDNA copy numbers [Citation27] is regulated in a way that is ineffective in breast cancer tissues. This possibility would be a striking departure from the expected biology of the 45S and 5S rDNA concerted copy number maintenance, and might serve as a powerful diagnostic for breast cancer onset or progression.
That some samples had higher rDNA copy numbers, and others had lower, suggests that rDNA arrays are subjected to general instability with losses and gains both occurring. This argues against developmental differences, since it seems likely that developmentally programmed changes to rDNA copy number would be uniform in direction, if not in direction and degree. Similarly, it seems unlikely that selective pressures would enrich for tumours with both increases and decreases in copy number if there is a growth (or cancer) advantage to either losses or gains in rDNA copy number. Instead, we find these data most easy to reconcile as a result of destabilization of repeat copy number in general. This assertion, and our data, are consistent with those recently published by Xu and colleagues [Citation31], and by Wang and Lemos [Citation45], although both of those studies analyze their data in the context of a cancer adaptive phenotype for rDNA copy number changes. These researchers showed that in tumours or samples derived from leukaemias and lymphomas, medulloblastomas, osteosarcomas, and oesophagal adenocarcinomas, although the average rDNA copy number was reduced, there were clear cases of individuals with increased copy numbers.
Those studies reported much larger changes in copy number than did we, but some of the data in those studies indicate copy numbers that were surprisingly low (in some cases, fewer than five copies of the 5S or widely discordant 18S, 5.8S, and 28S copy numbers), indicating their approach may not have generated interpretable absolute copy numbers (see below).
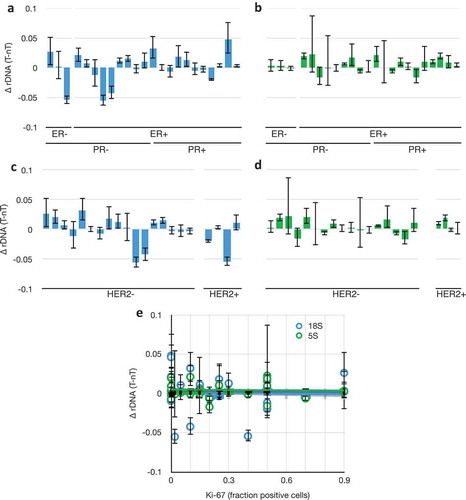
Despite the heterogeneity in genetic subtypes (), we could detect no correlation between rDNA variability and any of the genetic markers as categorical variables, or with Ki-67 as a continuous variable (). We conclude from this that it is unlikely that these factors, or the known genome instability in triple-negative breast cancers, are driving rDNA instability. Rather, we favour the interpretation that the universal loss of heterochromatin function in breast cancers is the cause.
Figure 4. 18S and 5S rDNA copy number changes as a function of breast cancer genetic subtype. (a) Differences in 18S rDNA copy numbers between paired tumour and non-tumour samples as a function of categorical grouping of Estrogen Receptor Negative (ER-) and Positive (ER+), and Progesterone Receptor (PR). Data from . (b) As in (a), but with 5S rDNA. (c) As in (a), but categorically grouped by Her2 expression phenotype. Grades 0–1+ were called ‘negative’ and 2–3+ were called ‘positive.’ (d) as in (e), but with 5S rDNA. (e) Differences in 18S (blue) and 5S (green) rDNA copy numbers between paired tumour and non-tumour samples as a function of Ki-67 expression, R2 (18S) = 0.003, R2 (5S) = 0.001. Data and S.E.M. are from .
Variations in telomeres and satellite repeats
The rDNA repeats are regulated and stabilized by the formation of heterochromatin [Citation25]. We expected that if the underpinning defect in cancer cells is to heterochromatin function, rather than specific regulation of the rDNA, then other repeat-sequences would also be affected. To test this, we analyzed ‘first-order’ (repeat-to-tRNA) changes in other repeat DNA sequences: the telomeric repeats and satellite-III sequences. The former are simple and non-transcribed, and altered heterochromatin structures at chromosome ends contributes to telomere length misregulation and allows alternative lengthening of telomeres [Citation60,Citation61] or de novo capping by heterologous sequences [Citation15]. The latter are stress-responsive transcribed pericentric repeats [Citation62–Citation64].
We analyzed the telomeric repeats using an approach modified [Citation26] from Richard Cawthon [Citation65,Citation66]. Telomere repeat copy number in tumour DNA was plotted as a function of copy number in non-Tumour DNA from the same biopsy (). It is clear that deviation from the diagonal (dashed line) is statistically distinguishable from the regression line, but is moderate-to-non-existent in extent (uniformly less than 2%, dotted lines). The coefficient of determination is very low (R2 = 0.33), and even these very-small effects are attributable in part to individual variation, rather than the tumour phenotype. Correspondingly, the coefficients of variations (C.V.s) do not differ, C.V. is 0.8% for the non-tumour samples, and 0.6% for the tumour samples. These results are consistent with the relatively small changes in telomere length in breast cancers, despite the common reactivation of telomerase in this cancer type [Citation67–Citation70].
Figure 5. Comparison of telomere and satellite repeats in paired tumours and non-tumour tissues. (a) Very weak correlation between telomeric repeat copy number in tumours versus non-tumours from the same individuals. Mean copy numbers are indicated (mean for non-tumours, vertical blue line, is 0.007; mean for tumours, horizontal red line, is 0.008). X- and Y-axis values are per cent difference from the lab standard; dashed diagonal is no difference between tumour and non-tumour (y = x), and dotted diagonals demarcate a 2% difference (y = 1x ± 0.02). (b) No correlation between Satellite-III in tumours versus non-tumours from the same individuals. Throughout this figure, error bars indicate standard error of the mean (S.E.M.) for triplicate or quadruplicate technical reactions.
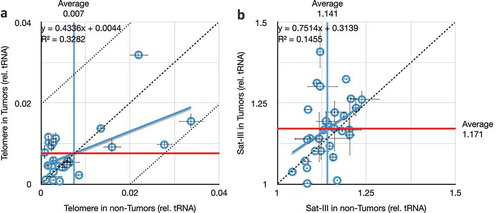
For the satellite-III DNA, we used techniques designed for Drosophila satellite sequences [Citation26]. Three trends were evident upon analysis (). First, tumours exhibit increased variation within the population of 29 individuals analyzed here. Specifically, the coefficient of variation nearly doubles in tumours (C.V. is 4.3% for non-tumours and 8.3% for tumours). Second, in general, tumours possess more Sat-III copies than do non-tumour tissues from the same individual (range of 1.04 to 1.24 for non-tumours, and range of 1.00 to 1.41 for tumours). Third, the average Sat-III copy numbers were unchanged in tumours compared to non-tumours when taken as populations (mean was 1.14 for non-Tumour samples and 1.17 for tumour samples). These latter two points seem contradictory, highlighting one of the enduring problems of analyzing repeat copy number changes in large populations, namely that copy number is so variable between individuals that even significant changes within individuals are often shrouded when (even small) populations are analyzed (e.g., [Citation45]). But it is clear from analyzing data from individuals that there are just as many decreases in Sat-III number as increases, and that the increases are larger in scale (+7% ± 7%, range of 1% to 25%) than are the decreases (−4% ± 4%, range of −1% to −13%).
We interpret these data as further support of our interpretation that the proximate cause of genome instability at repeats is a reduction in epigenetic stability of repeat sequences in general. And, as with the rDNA, there was no clear trend toward gains or losses of repeat number, merely the occurrence of increased variability. While this may ultimately derive from loss of the rDNA itself [Citation71], the alternative that a proximate cause of epigenetic instability affecting all repeats lies elsewhere cannot be ruled out. These results indicate that repeat DNA in general, including rDNA specifically, are unstable in progressing breast cancer cells.
Assessing whether 45S-5S is a risk factor for breast cancer
Blood is of mesodermal origin, and most of the cells in the breast cancer tumours are of endodermal origin, so these two cell types last shared a common cellular ancestor prior to gastrulation. This allowed us to probe whether we could detect rDNA copy number polymorphisms that prefigure later epigenetic instability, as a metric for early risk of later development of breast cancer. This hypothesis derives credibility from the demonstration that naturally and experimentally low rDNA copy number at fertilization result in adult epigenetic instabilities in model systems, and the finding that loss of rDNA leads to cell-autonomous defects in epigenetic stability [Citation33]. Blood from the patients from which breast cancer tumours were derived was not available, but the commonality of response (differences between tumour and non-tumour) suggested that if rDNA copy number detects prefigured breast cancer in individuals, it might be detected in blood. We therefore obtained genomic DNA from 51 patients involved in a clinical study designed to ascertain breast cancer risk alleles; about half were diagnosed with breast cancer, and none were from the same immediate families. We screened these samples for rDNA copy number in the attempt to find if uniformly low, uniformly high, or notably altered 45S-to-5S ratio of rDNA copy number was correlated with cancer diagnosis.
The known broad variance in rDNA copy number, both 18S and 28S (), argued against this simple hypothesis, and against the possibility that rDNA copy number could be used as a pre-clinical screen for cancer risk. However, we did discover that the 5S copy number in all of the study participants was low and did not vary much between patients (, note the much smaller range of the abscissa compared to the ordinate), and showed no detectable correlation with 45S copy number (R2 is 0.08 for patients with a cancer diagnosis, and is 0.03 for non-diagnosed patients). It is of some debate whether 45S and 5S copy numbers are equally variable. Analysis of few family lineages has demonstrated that the copy number of 5S appears more stable than the 45S [Citation3], however the published correlation between 45S and 5S copy number in healthy people is strong and robust even between different racial groups worldwide, and under experimental perturbation [Citation27], suggesting that both copy numbers must be variable. The latter studies reported an approximately 10-fold variance in 45S and 40-fold variance in 5S rDNA copy numbers in European men and women (135 of 201 of our samples are non-hispanic white women), while we found only a 1.6-fold variance in the medial 90% of samples.
Figure 6. Comparisons of 18S rDNA and 5S rDNA in blood. (a) The correlation between 28S and 18S copy number is retained in blood samples taken from both women diagnosed with (red) or not diagnosed with breast cancer (blue). (b) The correlation between 5S and 18S rDNA copy numbers reported in [Citation27] is not found in our dataset (no diagnosis, blue, R2 = 0.03; positive diagnosis, red, R2 = 0.08). (a) and (b) share an ordinate, error bars are S.E.M., and data are copy numbers relative to tRNAMet. (c) Extremely weak correlation between 18S rDNA copy number and 5S copy number in whole blood taken from people with no indication of any cancer diagnosis. Data are presented without error bars and with censoring of the highest values for clarity, but all data are present in the inset graph. (d) Template dose response for the 5S rDNA primers, as in . (e) Comparison of 5S rDNA copy number determined by qPCR and Southern blot quantification.
![Figure 6. Comparisons of 18S rDNA and 5S rDNA in blood. (a) The correlation between 28S and 18S copy number is retained in blood samples taken from both women diagnosed with (red) or not diagnosed with breast cancer (blue). (b) The correlation between 5S and 18S rDNA copy numbers reported in [Citation27] is not found in our dataset (no diagnosis, blue, R2 = 0.03; positive diagnosis, red, R2 = 0.08). (a) and (b) share an ordinate, error bars are S.E.M., and data are copy numbers relative to tRNAMet. (c) Extremely weak correlation between 18S rDNA copy number and 5S copy number in whole blood taken from people with no indication of any cancer diagnosis. Data are presented without error bars and with censoring of the highest values for clarity, but all data are present in the inset graph. (d) Template dose response for the 5S rDNA primers, as in Figure 1B. (e) Comparison of 5S rDNA copy number determined by qPCR and Southern blot quantification.](/cms/asset/809bfedd-24ff-4da8-a142-c5e922d6e928/kepi_a_1649930_f0006_c.jpg)
It is formally possible that the lack of 45S-5S correlation in our samples is itself a pre-breast cancer indicator, and reflects an instability and loss of 5S sequences in women at risk for breast cancer development. However, our results and those of Gibbons and colleagues [Citation27] were derived from two different methodologies. Ours was rDNA copy number ascertainment from qPCR (relative to tRNA gene copy number), while the correlation reported by Gibbons and colleagues was derived from bioinformatic analysis of high throughput DNA sequencing, the real-time PCR validation data for which were not published. Therefore, the difference between 45S-5S correlation in healthy and breast cancer patients could be a bona fide biomarker, or it could be an artefact of either method of determination.
Quantification of rDNA copy number in normal human blood
To address the correlation between 45S and 5S rDNA copy numbers in individuals not selected to have a history of breast cancer, we obtained 201 blood samples from the Arizona Health Sciences Center Biorepository at the University of Arizona (). Too few healthy people donated blood for our needs, so we instead obtained blood from people of a broad range of age and both sexes whose blood was drawn as part of diagnosis of non-cancer afflictions. The blood was prepared as before, and 45S and 5S were determined relative to tRNAMet. In those samples, we observed the same lack of correlation between 45S and 5S copy number (). This adequately refutes our hypothesis that rDNA copy number differences could prefigure breast cancer development late in life, and further refutes the possibility that breast cancer development disrupts a natural coupling of 45S and 5S copy number. However, it does not identify the origin of the disparity between the data of Gibbons and colleagues and our own: it could be that informatic calculation of rDNA copy number is error-prone, or it could be that qPCR determination is insensitive, particularly with respect to the 5S. We disfavour the latter possibility as we see no evidence of such when quantifying 5S copy number over a range of genomic DNA concentrations ().
Table 3. Demographics of blood samples.
To resolve this conflict, we selected blood samples with large and small 5S rDNA counts and subjected them to Southern dot-blot analysis. We observed a very strong correlation between Southern-based copy number determination and the results from qPCR across a broad range (). This is in good agreement with similar experiments in Drosophila, where very small differences in 18S rDNA copy number by qPCR could be robustly quantified and then independently validated by genetic means [Citation48]. Thus, our findings question the value of rDNA copy number determination using DNA deposited in high-throughput sequencing databases, consistent with those reported rDNA counts being so at-odds with other methodologies [Citation8]. We cannot speculate whether any potential error that may exist in databases is a result of biases in sequencing, quality control, the extraction and analysis of copy number data, or some other step in the informatics ‘pipeline.’ It seems prima facie erroneous that some samples had fewer than 10 copies of either 45S or 5S rDNAs [Citation45], which is incompatible with life in any known eukaryote [Citation8,Citation51]. Instead, our data support our assertion that the existing databases are not reliable sources of rDNA copy number data, and it is likely that if rDNA copy number proves to be a risk factor or a diagnostic for human disease, then a simple and reliable protocol, such as ours, will be necessary to validate data in databases or from patients.
rDNA copy numbers do not correlate with age, sex, or ethnicity
Our collection of blood from breast cancer patients, and from patients with non-cancer diagnoses, allowed us to ascertain deviations in average rDNA copy number as a consequence of age, sex, and ethnicity. These data could prove useful in evaluating hypotheses linking rDNA copy number to age [Citation72,Citation73], disease status, or involvement in lifestyle choices that lead to greater disease risk (e.g., alcohol consumption, cigarette smoking, overeating [Citation74]). We re-analyzed the rDNA copy number from the non-cancer-diagnosis individuals from the Tucson area and this time looked for correlations between average rDNA copy number and sex and ethnicity as categorical conditions (). No condition grouped rDNA copy number significantly away from the others. Thus, we conclude that in our samples, there is no evidence to support the hypothesis that rDNA copy number differs in the blood of different sexes or ethnicities.
Figure 7. Comparisons between rDNA copy numbers and population variables. (a) Consistent lack of correlation between different rDNA cluster copy numbers (18S and 5S) in males (blue, y = 1.61x + 0.83, R2 = 0.24) and females (pink, y = 0.78x + 1.06, R2 = 0.19). (b) Consistent weak correlation between different rDNA cluster copy numbers (18S and 5S) in hispanic (green, y = 1.20x + 0.72, R2 = 0.37) and non-hispanic white (orange, y = 1.75x + 0.87, R2 = 0.30) individuals. (c) Consistent lack of correlation between 18S and 5S rDNA copy numbers as a function of age of blood donor. All values in this graph are represented as rDNA copy number relative to tRNAMet, and normalized to the lab standard.
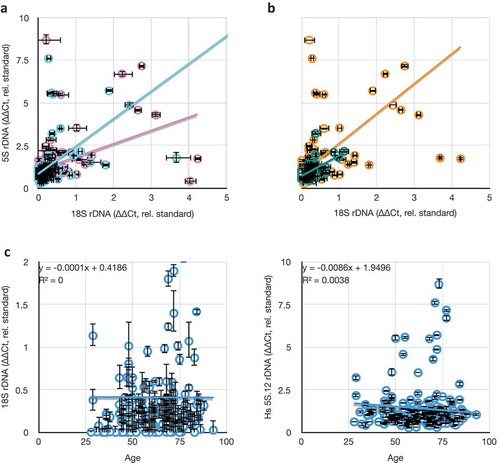
Ageing has been linked to rDNA loss in yeast, and the application of that phenomenon to humans has been proposed and, in some cases, supported [Citation73]. In contrast to those studies, we could detect no correlation between individual rDNA copy number or C.V. with age at time of blood collection (). This lack of apparent correlation is no-doubt affected by the widely variant copy number at birth of these patients, and it is still possible that individuals will exhibit rDNA loss as a function of ageing. At present, sufficiently broad sampling of blood over the lifetimes of individuals is not available, so while the issue of individual rDNA copy number loss is still outstanding, it can be said that ‘snapshot’ rDNA copy number is not predictive of biological age. This alone makes rDNA copy number a poor metric for age or sex, and extreme caution must be employed before considering such metrics in disease risk, disease onset, or forensic identification.
Concluding remarks
We have presented a method for quickly, inexpensively, sensitively, accurately, and reproducibly determining the copy number of repeated DNAs, in particular, the ribosomal RNA genes (45S and 5S rDNAs), from patient samples. This approach was pioneered in the model system Drosophila, but its application here has allowed us to directly test multiple hypotheses concerning repeat DNA stability in both healthy individuals and breast tumours.
We find, first, that the rDNA show signs of general instability, consistent with previous work showing derepression of heterochromatin-mediated stability in cancer. This finding is supported by our demonstration that the satellite repeats vary in time with (although not in the same direction as) increased rDNA variation. As all of the repeat sequences are stabilized by heterochromatin, we envision that an early step in cancer progression is the loss of heterochromatin function. Changes in copy numbers of rDNA, satellites, telomeres, and perhaps other repetitive sequences are then secondary and random. Second, we find that the reported covariation between 45S and 5S gene copy numbers is not evident using techniques other than high-throughput sequencing. Our data demonstrating the sensitivity, responsiveness, and confirmation by Southern blot analyses suggests that great caution must be exercised when deriving repeat copy numbers from curated sequencing data. Third, our findings refute hypotheses suggesting that increases or decreases in rDNA copy number are adaptive for disease. Rather than being selected for by increased demands for protein synthesis, or selected against by trimming genomes of superfluous DNA, we conclude that hyper-variability is a general outcome of disease onset. The salient phenotype is increased variability, not an increased or decreased rDNA transcription or rRNA output. It is likely that the observed preferential losses in cultured cancer cell lines are an artefact of growth in vitro, and that losses may merely be more stable than gains in culture. Fourth, we have demonstrated a facile, rapid, inexpensive, precise, and accurate real-time PCR-based strategy for rDNA copy number quantification using very small amounts of fresh or fixed tissue.
Materials and methods
DNA from tumour and tissue samples
Five consecutive 1 µm slices were cut from formalin-fixed-paraffin-embedded tissue blocks and DNA purification was obtained by using QIAamp DNA FFPE Tissue Kit (Qiagen). Basically, 1 ml of xylenes was added to each tube, vortexed for 1 min, then centrifuged at 14,000 rpm for 2 min and the supernatant removed through two ethanol washes. For each, ATL buffer and proteinase K were added, the samples ground with a pestle, and incubated for 1 h at 56°C and 1 h at 90°C. RNAse A was added to the samples and left at room temperature for 2 min, then the samples were transferred to columns and were washed with buffer AL, buffer AW1, and finally buffer AW2. Samples were eluted with 100 µL buffer ATE and quantified using a Synergy H1 Microplate Reader (BioTek).
DNA from blood cards
DNA purification was performed using GenSolve DNA Recovery Kit (Gentegra), the QIAshredder Kit (Qiagen), and the QIAamp Blood Mini Kit (Qiagen). Basically, half of each blood card was cut and placed in individual microcentrifuge tubes with Recovery Solution A and the blood allowed to resuspend overnight at room temperature. Tubes were then incubated, with rotation, for 1 h at 56°C. Recovery Solution B was added along with the samples to QIAshredder columns and centrifuged at 13,300 rpm for 2 min. The columns were discarded and ethanol added, the samples vortexed and briefly centrifuged, then transferred to QIAamp columns and centrifuged at 8000 rpm for 1 min. Columns were washed with buffer AW1 then with buffer AW2. Finally, samples were eluted in two steps of buffer AE, in a total of 100 μL of DNA solution, then quantified using a Synergy H1 Microplate Reader (BioTek).
DNA from drosophila and human blood
Tissue was ground with a mini-pestle in a microcentrifuge tube in a solution containing 100 mM Tris pH 8.0, 50 mM ethylenediaminetetraacetic acid, 1% Sodium Dodecylsulfate, and 1 µg Proteinase K. The slurry was digested for an hour at 65°C, then extracted through a series of phenol, phenol-chloroform, chloroform, and ether. The DNA was ethanol-precipitated and resuspended in TE (10 mM Tris pH 8.0, 1 mM ethylenediaminetetraacetic acid) containing 0.1 µg RNAseA. DNA concentration was determined using a Synergy H1 Microplate Reader (BioTek), and DNA samples were stored at high concentration at −80°C until use.
Real-time PCR reactions
Real-time PCR reactions were done as described previously [Citation26,Citation48], including controls on an ABI Step-One or Stop-One-Plus using SYBR Green chemistry, full-length (2 h) reaction cycle, and obligate post-hoc melt curve analysis. Reactions were adjusted to be 12 µL total reaction volume. Reactions were performed in triplicate or more, and data were accepted as valid if the standard error of the mean of the replicates was less than 0.1. Primers for non-rDNA targets are: Bloom Helicase (GGCTGCTGTTCCTCAAAATAATCTACAG and ATTATTAAGTGTTCTGGCTGAGTGACG), Snail2 (CCCGTATCTCTATGAGAGTTACTCC and GTATGCTCCTGAGCTGAGGATCTC), RNMT2 (CTTTGATGGCAGCATACAGTGTTCTGG and CCTGTGAATTTCTTCTGCAGTTTCAAGC), eGFP (GAGGGTGAAGGTGATGCAACATACGG and GCCATGGAACAGGTAGCTTCCCAG).
Numerical analysis
Analyses were performed on an Apple MacBook Pro using Numbers version 6.0 (build 6194). Descriptive and frequentist statistical analyses (e.g., regression, slope/intercept) were from embedded functions.
For simple comparisons between copy numbers of two genes in the same sample (e.g., ), Crossing thresholds (Cts) could be directly compared. Ct is calculated by determining the PCR cycle at which the signal first crosses the average plus 10 standard deviations of all preceding cycles. Errors are generally presented as Standard Errors of the Mean, derived from the pooled errors of the copy number of the gene in question and the tRNA normalizer, run in triplicate or quadruplicate. Standard error of the mean is justified as these data are from technical (assay) replicates of DNA extracted from single individuals. Errors were pooled using the standard summation of errors (SEM-pooled = √((SEM-target-1)2) + (SEM-target-2)2).
For copy number determination between different samples (e.g., , ) crossing thresholds were converted to relative amounts by first subtracting tRNA Ct from the target gene Ct, then using that as an exponent (2(Ct-target – Ct-tRNA); this is commonly referred to as the ‘∆Ct’ method. Where appropriate (e.g., , ), the ‘∆∆Ct’ method was used, which calculates ∆Cts for the sample and for a standard (in this case a human DNA sample that is a study-wide standard in the laboratory); these data indicate the proportion of rDNA-to-tRNA in the sample relative to the rDNA-to-tRNA of the standard, allowing us to compare values between qPCR reactions.
Correlations were considered weak if R2 was below 0.65, and non-existent if below 0.20. A priori criteria for accepting Type-I errors (alpha) was set at 0.01 at the beginning of the study.
Human data
Breast cancer tumour and adjacent samples from 29 individuals were obtained from Dr. L. LeBeau. It was determined by the University of Arizona Institutional Review Board that the use of the tissues did not require board oversight for this study (protocol #15–0477-0333) as the work did not meet the definition of ‘human subjects’ by U.S. Department of Health and Human Services which state that ‘human subject means a living individual about whom an investigator (whether professional or student) conducting research obtains data through intervention or interaction with the individual, or identifiable private information.’ Samples were de-identified, and shared without personal information for the purpose of this study.
DNA samples from 51 individuals taking part in a trial to identify cancer risk alleles were collected under protocol #12–0138 (to C. Laukaitis), which was approved by the University of Arizona Institutional Review Board. Samples were de-identified, and shared without personal information for the purpose of this study.
Blood samples from 200 individual patients obtained from the Arizona Health Sciences Center Biorepository (from D. Harris) were de-identified, and shared without personal information for the purpose of this study.
Samples were further de-identified by assigning new serial numbers to all samples; the key linking the original de-identified number from the source (i.e., LeBeau, Laukaitis, Harris) to the n this study is safeguarded by our laboratory.
Acknowledgments
GFP-BLM cell lines were obtained from Dr. Mary Yagle and Dr. Nathan Ellis. The University of Arizona Cancer Center provided core and facilities support, funded through National Institutes of Health Support Grant P30CA023074. Blood DNA (Figure 6(a-b,e)) or blood samples (Figures 6(c) and 7) were obtained from the AHSC Biorepository at The University of Arizona College of Medicine. Ovary samples (Figure 2) were obtained from the Univeristy of Arizona Tissue Acquisition and Cellular/Molecular Analysis Shared Resource (TACMASR). TACMASR also performed the tissue sections of the breast tumour samples. Support also came from the Department of Cellular and Molecular Medicine, the Univeristy of Arizona College of Medicine, the Arizona State Museum, and Transformative Research Award (R01) GM123640, granted to Keith A. Maggert. Finally, Dr. Nicholas Ratterman’s excellent sociolinguistic parsimony and keen advice was invaluable, as were the delicate urgings of Dr. Diana Darnell.
Disclosure statement
No potential conflict of interest was reported by the authors.
Additional information
Funding
References
- Stults DM, Killen MW, Williamson EP, et al. Human rRNA gene clusters are recombinational hotspots in cancer. Cancer Res. 2009;69:9096–9104.
- Gonzalez IL, Gorski JL, Campen TJ, et al. Variation among human 28S ribosomal RNA genes. Proc Natl Acad Sci U S A. 1985;82:7666–7670.
- Stults DM, Killen MW, Pierce HH, et al. Genomic architecture and inheritance of human ribosomal RNA gene clusters. Genome Res. 2008;18:13–18.
- Krystal M, D’Eustachio P, Ruddle FH, et al. Human nucleolus organizers on nonhomologous chromosomes can share the same ribosomal gene variants. Proc Natl Acad Sci U S A. 1981;78:5744–5748.
- Peng JC, Karpen GH. H3K9 methylation and RNA interference regulate nucleolar organization and repeated DNA stability. Nat Cell Biol. 2007;9:25–35.
- Ranzani GN, Bernini LF, Crippa M. Inheritance of rDNA spacer length variants in man. Mol Gen Genet. 1984;196:141–145.
- Cohen S, Yacobi K, Segal D. Extrachromosomal circular DNA of tandemly repeated genomic sequences in Drosophila. Genome Res. 2003;13:1133–1145.
- Long EO, Dawid IB. Repeated genes in eukaryotes. Annu Rev Biochem. 1980;49:727–764.
- Elgin SC, Reuter G. Position-effect variegation, heterochromatin formation, and gene silencing in Drosophila. Cold Spring Harb Perspect Biol. 2013;5:a017780.
- Vogel MJ, Guelen L, de Wit E, et al. Human heterochromatin proteins form large domains containing KRAB-ZNF genes. Genome Res. 2006;16:1493–1504.
- Bintu L, Yong J, Antebi YE, et al. Dynamics of epigenetic regulation at the single-cell level. Science. 2016;351:720–724.
- Ryu T, Bonner MR, Chiolo I. Cervantes and Quijote protect heterochromatin from aberrant recombination and lead the way to the nuclear periphery. Nucleus. 2016;7:485–497.
- Chiolo I, Minoda A, Colmenares SU, et al. Double-strand breaks in heterochromatin move outside of a dynamic HP1a domain to complete recombinational repair. Cell. 2011;144:732–744.
- Weiler KS, Wakimoto BT. Heterochromatin and gene expression in Drosophila. Annu Rev Genet. 1995;29:577–605.
- Perrini B, Piacentini L, Fanti L, et al. HP1 controls telomere capping, telomere elongation, and telomere silencing by two different mechanisms in Drosophila. Mol Cell. 2004;15:467–476.
- Garcia-Cao M, O’Sullivan R, Peters AH, et al. Epigenetic regulation of telomere length in mammalian cells by the Suv39h1 and Suv39h2 histone methyltransferases. Nat Genet. 2004;36:94–99.
- Savitsky M, Kravchuk O, Melnikova L, et al. Heterochromatin protein 1 is involved in control of telomere elongation in Drosophila melanogaster. Mol Cell Biol. 2002;22:3204–3218.
- Peng JC, Karpen GH. Heterochromatic genome stability requires regulators of histone H3 K9 methylation. PLoS Genet. 2009;5:e1000435.
- Hathaway NA, Bell O, Hodges C, et al. Dynamics and memory of heterochromatin in living cells. Cell. 2012;149:1447–1460.
- Damelin M, Bestor TH. Biological functions of DNA methyltransferase 1 require its methyltransferase activity. Mol Cell Biol. 2007;27:3891–3899.
- Spofford JB. Position-effect variegation in Drosophila. In: M. Ashburner, E. Novitski, editors. The genetics and biology of drosophila. Academic Press, London; 1976. p. 955–1019.
- Aldrich JC, Maggert KA. Transgenerational inheritance of diet-induced genome rearrangements in Drosophila. PLoS Genet. 2015;11:e1005148.
- Miller OL Jr., Beatty BR. Visualization of nucleolar genes. Science. 1969;164:955–957.
- McStay B, Grummt I. The epigenetics of rRNA genes: from molecular to chromosome biology. Annu Rev Cell Dev Biol. 2008;24:131–157.
- Guetg C, Lienemann P, Sirri V, et al. The NoRC complex mediates the heterochromatin formation and stability of silent rRNA genes and centromeric repeats. EMBO J. 2010;29:2135–2146.
- Aldrich JC, Maggert KA. Simple quantitative PCR approach to reveal naturally occurring and mutation-induced repetitive sequence variation on the Drosophila Y chromosome. PLoS One. 2014;9:e109906.
- Gibbons JG, Branco AT, Godinho SA, et al. Concerted copy number variation balances ribosomal DNA dosage in human and mouse genomes. Proc Natl Acad Sci U S A. 2015;112:2485–2490.
- Kobayashi T. A new role of the rDNA and nucleolus in the nucleus–rDNA instability maintains genome integrity. Bioessays. 2008;30:267–272.
- Salim D, Gerton JL. Ribosomal DNA instability and genome adaptability. Chromosome Res. 2019;27:73–87.
- Bughio F, Maggert KA. The peculiar genetics of the ribosomal DNA blurs the boundaries of transgenerational epigenetic inheritance. Chromosome Res. 2019;27:19–30.
- Xu B, Li H, Perry JM, et al. Ribosomal DNA copy number loss and sequence variation in cancer. PLoS Genet. 2017;13:e1006771.
- Zhou J, Sackton TB, Martinsen L, et al. Y chromosome mediates ribosomal DNA silencing and modulates the chromatin state in Drosophila. Proc Natl Acad Sci U S A. 2012;109:9941–9946.
- Paredes S, Maggert KA. Ribosomal DNA contributes to global chromatin regulation. Proc Natl Acad Sci U S A. 2009b;106:17829–17834.
- Larson K, Yan SJ, Tsurumi A, et al. Heterochromatin formation promotes longevity and represses ribosomal RNA synthesis. PLoS Genet. 2012;8:e1002473.
- Slee RB, Steiner CM, Herbert BS, et al. Cancer-associated alteration of pericentromeric heterochromatin may contribute to chromosome instability. Oncogene. 2012;31:3244–3253.
- Dialynas GK, Vitalini MW, Wallrath LL. Linking Heterochromatin Protein 1 (HP1) to cancer progression. Mutat Res. 2008;647:13–20.
- Atkin NB, Brito-Babapulle V. Heterochromatin polymorphism and human cancer. Cancer Genet Cytogenet. 1981;3:261–272.
- Ci X, Hao J, Dong X, et al. Heterochromatin protein 1alpha mediates development and aggressiveness of neuroendocrine prostate cancer. Cancer Res. 2018;78:2691–2704.
- Zhang R, Adams PD. Heterochromatin and its relationship to cell senescence and cancer therapy. Cell Cycle. 2007;6:784–789.
- Pezer Z, Ugarkovic D. Role of non-coding RNA and heterochromatin in aneuploidy and cancer. Semin Cancer Biol. 2008;18:123–130.
- Storchova Z, Pellman D. From polyploidy to aneuploidy, genome instability and cancer. Nat Rev Mol Cell Biol. 2004;5:45–54.
- Chin K, de Solorzano CO, Knowles D, et al. In situ analyses of genome instability in breast cancer. Nat Genet. 2004;36:984–988.
- de Vargas Wolfgramm E, Alves LN, Stur E, et al. Analysis of genome instability in breast cancer. Mol Biol Rep. 2013;40:2139–2144.
- Richard SM, Bailliet G, Paez GL, et al. Nuclear and mitochondrial genome instability in human breast cancer. Cancer Res. 2000;60:4231–4237.
- Wang M, Lemos B. Ribosomal DNA copy number amplification and loss in human cancers is linked to tumor genetic context, nucleolus activity, and proliferation. PLoS Genet. 2017;13:e1006994.
- Schawalder J, Paric E, Neff NF. Telomere and ribosomal DNA repeats are chromosomal targets of the bloom syndrome DNA helicase. BMC Cell Biol. 2003;4:15.
- Killen MW, Stults DM, Adachi N, et al. Loss of Bloom syndrome protein destabilizes human gene cluster architecture. Hum Mol Genet. 2009;18:3417–3428.
- Paredes S, Maggert KA. Expression of I-CreI endonuclease generates deletions within the rDNA of drosophila. Genetics. 2009a;181:1661–1671.
- Erickson JM, Rushford CL, Dorney DJ, et al. Structure and variation of human ribosomal DNA: molecular analysis of cloned fragments. Gene. 1981;16:1–9.
- Wilson GN, Szura LL, Rushford C, et al. Structure and variation of human ribosomal DNA: the external transcribed spacer and adjacent regions. Am J Hum Genet. 1982;34:32–49.
- Prokopowich CD, Gregory TR, Crease TJ. The correlation between rDNA copy number and genome size in eukaryotes. Genome. 2003;46:48–50.
- Richard GF, Kerrest A, Dujon B. Comparative genomics and molecular dynamics of DNA repeats in eukaryotes. Microbiol Mol Biol Rev. 2008;72:686–727.
- Hugerth LW, Muller EE, Hu YO, et al. Systematic design of 18S rRNA gene primers for determining eukaryotic diversity in microbial consortia. PLoS One. 2014;9:e95567.
- Wellauer PK, Dawid IB. The structural organization of ribosomal DNA in Drosophila melanogaster. Cell. 1977;10:193–212.
- Bankfalvi A, Ofner D, Schmid KW, et al. Standardized in situ AgNOR analysis in breast pathology: diagnostic and cell kinetic implications. Pathol Res Pract. 1999;195:219–229.
- Lesty C, Chleq C, Contesso G, et al. Nucleoli and AgNOR proteins in 32 cases of primary breast carcinoma. Spatial pattern of interactions between 50 clinical and histometric criteria. Anal Quant Cytol Histol. 1992;14:175–186.
- Barwijuk-Machala M, Musiatowicz B, Cylwik J, et al. AgNOR, Ki-67 and PCNA expression in fibroepithelial tumours of the breast in correlation with morphological features. Folia Morphol (Warsz). 2004;63:133–135.
- Bednarek AK, Sahin A, Brenner AJ, et al. Analysis of telomerase activity levels in breast cancer: positive detection at the in situ breast carcinoma stage. Clin Cancer Res. 1997;3:11–16.
- Cawthon RM. Telomere measurement by quantitative PCR. Nucleic Acids Res. 2002;30:e47.
- Cawthon RM. Telomere length measurement by a novel monochrome multiplex quantitative PCR method. Nucleic Acids Res. 2009;37:e21.
- Derenzini M, Ceccarelli C, Santini D, et al. The prognostic value of the AgNOR parameter in human breast cancer depends on the pRb and p53 status. J Clin Pathol. 2004;57:755–761.
- Guerrero PA, Maggert KA. The CCCTC-binding factor (CTCF) of Drosophila contributes to the regulation of the ribosomal DNA and nucleolar stability. PLoS One. 2011;6:e16401.
- Holland ML, Lowe R, Caton PW, et al. Early-life nutrition modulates the epigenetic state of specific rDNA genetic variants in mice. Science. 2016;353:495–498.
- Jiang WQ, Nguyen A, Cao Y, et al. HP1-mediated formation of alternative lengthening of telomeres-associated PML bodies requires HIRA but not ASF1a. PLoS One. 2011;6:e17036.
- Jiang WQ, Zhong ZH, Nguyen A, et al. Induction of alternative lengthening of telomeres-associated PML bodies by p53/p21 requires HP1 proteins. J Cell Biol. 2009;185:797–810.
- Jolly C, Lakhotia SC. Human sat III and Drosophila hsr omega transcripts: a common paradigm for regulation of nuclear RNA processing in stressed cells. Nucleic Acids Res. 2006;34:5508–5514.
- Jolly C, Metz A, Govin J, et al. Stress-induced transcription of satellite III repeats. J Cell Biol. 2004;164:25–33.
- Kobayashi T. Regulation of ribosomal RNA gene copy number and its role in modulating genome integrity and evolutionary adaptability in yeast. Cell Mol Life Sci. 2011;68:1395–1403.
- Malinovskaya EM, Ershova ES, Golimbet VE, et al. Copy number of human ribosomal genes with aging: unchanged Mean, but narrowed range and decreased variance in elderly group. Front Genet. 2018;9:306.
- Nawaz S, Hashizumi TL, Markham NE, et al. Telomerase expression in human breast cancer with and without lymph node metastases. Am J Clin Pathol. 1997;107:542–547.
- Rha SY, Jeung HC, Park KH, et al. Changes of telomerase activity by alternative splicing of full-length and beta variants of hTERT in breast cancer patients. Oncol Res. 2009;18:213–220.
- Umbricht CB, Sherman ME, Dome J, et al. Telomerase activity in ductal carcinoma in situ and invasive breast cancer. Oncogene. 1999;18:3407–3414.
- Valgardsdottir R, Chiodi I, Giordano M, et al. Structural and functional characterization of noncoding repetitive RNAs transcribed in stressed human cells. Mol Biol Cell. 2005;16:2597–2604.
- Wang M, Lemos B. Ribosomal DNA harbors an evolutionarily conserved clock of biological aging. Genome Res. 2019;29:325–333.