
ABSTRACT
Copper is an essential trace nutrient and an enzymatic cofactor necessary for diverse physiological and biological processes. Copper metabolism is uniquely controlled in the placenta and changes to copper metabolism have been linked with adverse birth outcomes. We investigated associations between patterns of DNA methylation (DNAm; measured at >485 k CpG sites) and copper concentration measured from placentae in two independent mother-infant cohorts: the New Hampshire Birth Cohort Study (NHBCS, n = 306) and the Rhode Island Child Health Study (RICHS, n = 141). We identified nine copper-associated differentially methylated regions (DMRs; adjusted P < 0.05) and 15 suggestive CpGs (raw P < 1e-5). One of the most robust variably methylated CpGs associated with the expression of the antioxidant, GSTP1. Our most robust DMR negatively associates with the expression of the zinc-finger gene, ZNF197 (FDR = 4.5e-11). Genes co-expressed with ZNF197, a transcription factor, are enriched for genes that associate with birth weight in RICHS (OR = 2.9, P = 2.6e-6, N = 194), genes that are near a ZNF197 consensus binding motif (OR = 1.34, P = 0.01, N = 194), and for those classified in GO biological processes growth hormone secretion (P = 3.4e-4), multicellular organism growth (P = 3.8e-4), and molecular functions related to lipid biosynthesis (P = 1.9e-4). Further, putative transcriptional targets for ZNF197 include genes involved in copper metabolism and placentation. Our results suggest that copper metabolism is tied to DNAm in the placenta and that copper-associated patterns in DNAm may mediate normal placentation and foetal development.
Introduction
Copper is an essential trace nutrient, utilized in many cuproenzymes and vital to a diverse array of cellular functions that are crucial to life. Copper deficiency, while uncommon in the United States, can occur when dietary sources of copper (yeast bread, potatoes, tomatoes, ready-to-eat cereal, and beef) are scarce, or when intestinal absorption is impaired. Copper toxicity is extremely rare, but can result when copper dust is inhaled (e.g., when mining or grinding copper-containing metal), or when acidic water or food is exposed to copper and ingested [Citation1]. High copper concentrations are toxic, necessitating strict copper ion homoeostasis. Menkes and Wilson diseases, which result from mutations in the copper metabolism genes ATP7A and ATP7B, respectively, demonstrate the essentiality of copper and copper metabolism in humans [Citation2].
This balance is particularly critical during in utero development when copper ion homoeostasis is required for proper foetal development and placental function; variation in copper concentration in placenta [Citation3–Citation6], maternal serum [Citation7–Citation11], and cord blood [Citation7,Citation9] has been associated with adverse birth outcomes, including low birth weight. As one of the only human tissues that expresses both ATP7A and ATP7B, the placenta uniquely controls copper metabolism and foetal access to copper. ATP7A controls copper transfer from the placenta to foetal the circulation, while ATP7B controls the return of excess placental copper to maternal circulation [Citation12]. Likely in coordination with changing hormone levels, placental and cord blood copper levels appear to increase in the third trimester to accommodate the storage of copper in the foetal liver [Citation13,Citation14]. Although the mechanism by which copper is transferred from maternal to foetal circulation is not yet fully elucidated, maternal serum copper is higher than umbilical cord serum copper, suggesting that the placenta acts as a partial barrier [Citation9,Citation13]. Unlike the heavy metal cadmium, copper does not appear to accumulate in the placenta under maternal excess [Citation5,Citation15,Citation16]. Loss of function in copper metabolism genes can result in copper accumulation in the placenta and miscarriage [Citation12,Citation17,Citation18].
Though the specific biological processes that associate with variations in copper concentration have not been thoroughly studied in the placenta, studies of other tissues provide evidence that DNA methylation is involved. Animal models of Wilson disease suggest that liver damage associated with copper accumulation may be partially mediated by global hypomethylation [Citation19–Citation21]. Through inhibition of S-Adenosylhomocysteine Hydrolase (SAHH), a key enzyme that regulates the amount of s-adenosylmethionine (SAM) available for methylation reactions, copper accumulation reduces a cell’s methylation potential [Citation20,Citation22]. In mice, global hypomethylation led to a decreased ability for liver cells to respond to oxidative stress [Citation21]. In this model, copper chelation or methyl donor supplementation restored global methylation levels and improved liver function [Citation19,Citation21]. It remains unclear how variability in placental copper concentrations impacts placental functions and to what extent changes in DNA methylation patterns are involved.
Although copper metabolism is tightly controlled by necessity, it can be influenced by endogenous factors beyond the overt alterations observed in Mendelian disease. Recent research in placental cells has found that insulin decreases the action of ATP7B and increases the action of ATP7A [Citation23]. Accordingly, studies of type I and II diabetes have found altered copper metabolism in cases vs. controls and rat models of diabetes have higher tissue concentrations of copper [Citation24]. In Cohen diabetic rats, placental hypomethylation is ameliorated by copper supplementation [Citation6]. Taken together, these findings support a scenario in which copper metabolism in the placenta could become uncoupled by environmental factors, leading to changes in the epigenetic landscape of the placenta. To more broadly consider the impact of variation in placental copper concentration on DNA methylation in a human population, we assess site-specific and regional changes to DNA methylation that associate with placental copper concentration and how these changes associate with the birth weight in two independent cohorts using a meta-analytic framework.
Results
This study analysed data from 306 mother–infant pairs from the New Hampshire Birth Cohort (NHBCS) and 141 mother–infant pairs from the Rhode Island Child Health Study (RICHS), with the demographics of the participants for this study shown in . A few notable differences exist between the two cohorts. RICHS contains more small for gestational age (SGA) and large for gestational age (LGA) newborns than NHBCS by design (). RICHS samples have slightly higher median copper concentration (880.1 ng/g vs 847.1 ng/g in NHBCS, ). Lastly, the RICHS cohort is slightly more racially diverse than the NHBCS cohort ().
Table 1. Participant demographics.
To analyse the associations between placental copper concentration and genome-wide epigenetic landscape, we utilized an epigenome-wide association study, or EWAS, design. Within each cohort and for each CpG individually, methylation M-values for all placental samples were regressed on corresponding dichotomized placental copper concentrations, while also adjusting for infant sex, maternal pregnancy smoking status, highest achieved maternal education level, and the estimated proportions of putative placental cell types. The genomic inflation factors (median (T-statistic)2/0.4549) for RICHS (1.2) and NHBCS (0.94) EWAS, respectively, did not indicate substantial statistical confounding. The RICHS EWAS produced 21 CpGs with suggestive P-values (p < 10−5) and two CpGs that were significant after Bonferroni correction (p < 10−7, ). The NHBCS EWAS produced 9 CpGs with suggestive P-values (). These two EWAS were combined via meta-analysis, which produced 15 CpGs with suggestive P-values for association with placental copper status ().
Figure 1. Epigenome-wide association study results for placental copper status.
Volcano plots display the p-value and effect estimate (log fold change) for the a. RICHS, b. the NHBCS cohort-level associations, as well as for c. the meta-analysis. d. The Manhattan plot of meta-analysis results indicates -log10(p-value) for individual CpG associations with placental copper status, as well as locations on the chromosomes (indicated on x-axis). Red vertical lines indicate differentially methylated regions found by CombP. Blue dots represent CpGs within the DMR.
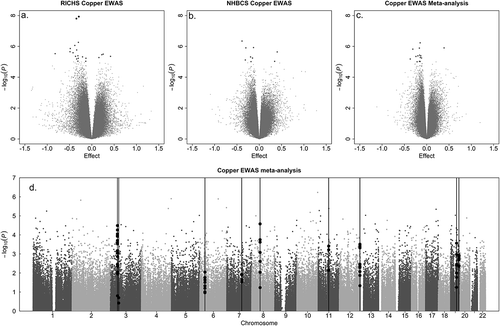
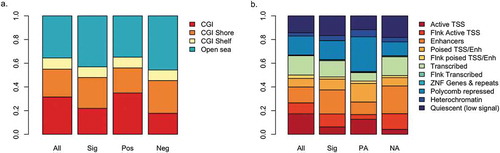
In both the cohort-level EWASs and the meta-analysis, suggestive and significant hits were spread throughout the genome (). Copper status was more often associated with lower methylation (hypomethylation) than higher methylation (hypermethylation) among top results for all three analyses (-c; Tables S1-S3). Among CpG sites passing a liberal threshold of significance in the meta-analysis (p < 0.001), we find that CpG sites that trend negatively with placental copper are enriched among putative enhancers (OR = 2.15, P = 0.003, N = 813) and amongst regions that flank active transcription start sites (OR = 3.65, P = 1.3 × 10⁻⁴, N = 813, ). Accordingly, though not statistically significant, we find those CpG sites are also enriched among CpG shores (1.5 kb out from CpG island regions; OR = 1.4, P = 0.08, N = 813, ).
Figure 2. Distribution of results among genomic compartments.
a. Proportion of CpG sites in CpG islands (CGI), CGI shores and CGI shelves. Open sea CpGs are not near any CGI feature. b. Proportion of CpG sites within ChromHMM states. For both figures, compartment distributions are shown for all CpGs on the 450k array, all significant CpG sites (Sig), positively associated CpG sites (Pos), or negatively associated CpG sites (Neg). TSS and Enh are abbreviations of transcription start site and enhancer, respectively.
One of the most significant differentially methylated positions (DMP) in the meta-analysis is found in a CpG island shore and is annotated in foetal placenta cells as being in an enhancer region [Citation25]. Cg25866895 resides in a 5ʹ CpG island shore, upstream of the GSTP1 promoter. It is also in a DNaseI hypersensitivity site, indicating that the CpG is in accessible chromatin [Citation26]. For both cohort-level EWASs, methylation at cg25866895 is negatively associated with copper status, meaning that higher copper associates with lower CpG methylation at the locus (Table S3). Methylation at this position is negatively associated with the expression of GSTP1 (P = 0.005) among 194 placental samples with matched CpG methylation and transcript expression data in the RICHS cohort.
When unaccounted for in the statistical model, population admixture is a confounder of association studies. RICHS is slightly more ethnically diverse than NHBCS (). Ethnicity was not included in the cohort-level EWASs in this study because of missing race/ethnicity data in both cohorts. However, the inflation factors for the cohort-level results do not suggest population stratification. Additionally, CpGs with significant inter-study heterogeneity (Cochran’s Q-test p-values < 0.05) constituted only 5.5% of tested CpGs, were not enriched among the most significant results (Fisher exact test, Cochran’s Q-test p-value < 0.05 vs. meta p-value < 0.0001) and were removed from downstream analysis. Finally, in a sensitivity analysis conducted on the top significant CpGs in each cohort-level EWAS, the associations of placental copper status and CpG methylation were robust to the addition of race in the regression model (Table S4).
We employed the Comb-p method to find local genomic regions enriched in low P-values from the meta-analyses, considering that these differentially methylated regions (DMRs) might be more biologically relevant than individually significant CpGs. Using the meta-analysis P-values, we found nine significant DMRs (regional P-value < 0.05, , ). Zinc-finger genes are overrepresented in the significant DMRs (4 of 9, ). The most significant DMR is on chromosome 3 at the 5ʹ region of the gene, ZNF197. For the most significant CpG in the DMR at ZNF197, the average difference in per cent methylation between high and low copper levels at ZNF197 is 6.3% (RICHS – 8%, NHBCS – 4.6%, Table S5).
Table 2. Copper-associated differentially methylated regions.
Within the RICHS cohort, we assessed 194 placental samples with matched CpG methylation and transcript expression data for functional consequences to differential methylation levels among the significant DMRs. For two of the nine DMRs, methylation level at the most significant CpG within the DMR was associated with lower transcription of the nearest gene (ZNF197 FDR = 6.6e-12; ZNF614 FDR = 2.9e-07, ). Methylation level at the ZNF197 DMR is positively associated with copper status (regional adjusted P < 5.2e-14, ,c) and negatively associated with transcription of ZNF197 (FDR = 6.6e-12, ) [Citation26,Citation27].
Figure 3. Copper-associated DMR at ZNF197.
Mean methylation proportion for CpGs within the ZNF197 DMR, between high and low placental copper groups, indicates that higher copper results in higher methylation across the DMR in a. NHBCS and c. RICHS. b. DMR location relative to the ZNF197 start site, and chromatin information for foetal placenta from the ROADMAP epigenomics project [Citation26] (DNaseI hypersensitivity region, RNA-seq signal and ChromHMM annotation) and the UCSC genome browser [Citation27] (CpG island) are also displayed.
![Figure 3. Copper-associated DMR at ZNF197.Mean methylation proportion for CpGs within the ZNF197 DMR, between high and low placental copper groups, indicates that higher copper results in higher methylation across the DMR in a. NHBCS and c. RICHS. b. DMR location relative to the ZNF197 start site, and chromatin information for foetal placenta from the ROADMAP epigenomics project [Citation26] (DNaseI hypersensitivity region, RNA-seq signal and ChromHMM annotation) and the UCSC genome browser [Citation27] (CpG island) are also displayed.](/cms/asset/99785bf2-4830-455d-9865-2b3fd29d07da/kepi_a_1661211_f0003_c.jpg)
The DMR at ZNF197 overlaps the promoter and 5ʹ untranslated region of the ZNF197 gene. Accordingly, chromatin annotation by ChromHMM in foetal placenta cells marks the region as an active promoter or the region flanking an active promoter. The DMR also overlaps a CpG island and DNaseI hypersensitivity site (). Members of the DMR are consistently more methylated in the higher copper status samples, across both cohorts (,c, Table S5).
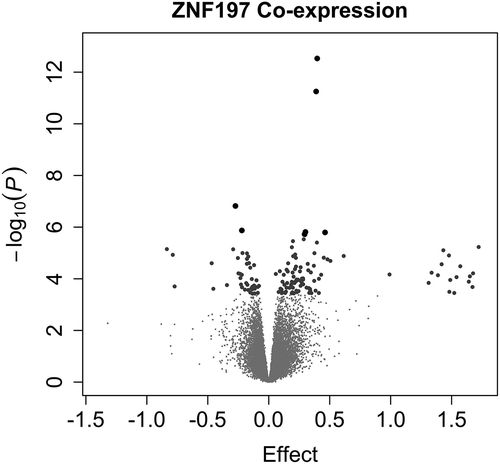
ZNF197 is known to have a DNA binding transcription factor activity. Specifically, ZNF197 is reported to act as a transcriptional repressor of the master regulator, hypoxia-inducible factor 1 alpha, HIF1α [Citation28]. Given its potential to affect the transcriptional landscape, we sought potential transcriptional targets and cascades of ZNF197. First, we found regions in the genome that matched the consensus binding motif for ZNF197 [Citation29]. We also assessed how the transcript levels of other genes correlate with ZNF197 transcript abundance (co-expression). One hundred and thirty-eight transcripts were significantly co-expressed with ZNF197 (). Co-expressed genes are enriched for genes that associate with birth weight in RICHS (OR = 2.9, P = 2.6e-6, N = 194) and genes that are near a ZNF197 consensus binding motif (OR = 1.34, P = 0.01, N = 194). ZNF197 co-expressed genes are enriched for GO biological processes growth hormone secretion (P = 3.4e-4), multicellular organism growth (P = 3.8e-4), and molecular functions related to lipid biosynthesis (P = 1.9e-4; Table S6).
Figure 4. ZNF197 Genome-Wide Co-expression.
Volcano plots display the p-value and effect estimate (log fold change). One hundred and thirty-eight genes are significantly co-expressed with ZNF197 (larger points in the volcano plot). Large grey dots indicate that the association had a false discovery rate (by Benjamini Hochberg method) less than 0.05 and the large black dots indicate a Bonferroni-adjusted p-value less than 0.05.
We used both ZNF197 co-expression and motif analysis to generate a list of potential targets of ZNF197. We narrowed putative binding regions to only those that are found within open chromatin in placenta (ROADMAP Epigenomics, DNaseI hypersensitivity) [Citation26] and were immediately upstream of the transcription start site of a gene annotated in Ensembl (v37) [Citation30]. We narrowed the co-expression results to just those transcripts with P-values less than 0.01 (equivalent to an FDR<0.18). The intersection of genes that were analysed for co-expression with ZNF197 and genes with an accessible ZNF197 binding motif was ranked by P-value, and a combined, optimized super-list of genes were generated by a Cross-Entropy Monte Carlo algorithm [Citation31] ().
Table 3. Super-list of genes co-expressed with and containing a binding motif for ZNF197.
Higher placental copper concentration in RICHS is associated with almost 3 times the odds of SGA than AGA while accounting for LGA (multinomial linear regression; N = 141; OR = 2.98; P-value = 0.02). This association was not observed in NHBCS (N = 343; OR = 0.95, P-value = 0.93). While the expression of ZNF197 alone does not associate with birth weight status, the transcripts that are significantly co-expressed with ZNF197 are enriched (OR = 2.5, P = 1.3 × 10⁻¹⁰) among transcripts that are significantly associated with birth weight in a transcriptome-wide association study of birth weight in RICHS (N = 194, FDR<0.05).
Discussion
We combined data from two mother-infant cohorts to evaluate associations between placental copper concentration and genome-wide DNA methylation in placenta. The methods used for quantifying DNA methylation and copper concentration were identical in both cohorts, and the placental concentrations of copper were similar to those reported in other cohorts [Citation32]. On a cohort-level, we did not find any consistent evidence of an association between copper status and methylation status at any single CpG. However, from the meta-analysis, we found evidence of nine larger regions of the genome that were differentially methylated with copper concentration.
In both individual cohorts, and in the meta-analysis – hypomethylation is more common than hypermethylation. This finding is in accordance with previous findings that link increased copper in liver with decreased methylation through the disruption of methionine metabolism [Citation20]. The CpGs that were less methylated in the higher copper placentas were enriched among putative enhancers, regions that flank active transcription start sites and CpG island shores. These regions of the genome represent areas of active DNA methylation turnover. Whereas hypermethylation of normally unmethylated CpG island promoters is a well-described mechanism for transcriptional inhibition, variation in the methylation status of such regions is low and generally a poor predictor of gene expression. Conversely, CpG island shores and enhancer elements exhibit higher variation in DNA methylation, and recent studies stress the importance of altered methylation at enhancer elements as an important contributor to variation in gene expression [Citation33].
GSTP1, one of our most significant DMPs, encodes the dominant isoform of the important detoxifying enzyme, glutathione-S-transferase in the placenta, and is responsible for inactivating reactive oxygen species [Citation34]. In a study of methylation changes in liver associated with Wilson disease, GSTP1 was hypomethylated in both mouse models and Wilson disease patients [Citation21]. Interestingly, while other differentially methylated gene promoters were ameliorated by choline treatment, GSTP1 was not, leading the authors to conclude that differential methylation of GSTP1 was a feature of ATP7B deficiency and copper accumulation, but not the result of the hypomethylation mediated by the copper-induced inhibition of SAHH [Citation21]. It has been suggested by others that upregulated GST expression is a biomarker of cell’s first response to oxidative stress [Citation35].
Our most robust DMR was at the promoter of zinc-finger gene and transcription factor, ZNF197. The DMR overlaps a DNaseI hypersensitivity region, a CpG island and the transcription start site of ZNF197. Copper status is positively correlated with DNAm in the DMR; meaning that higher copper concentration associates with more DNAm. DNAm at the most significant CpG in the DMR was negatively associated with transcript abundance. As the DMR is in a promotor-region, this result is in accordance with the canonical relationship of promoter DNAm and transcriptional repression. ZNF197 is a member of the SCAN family of zinc-finger protein, which is substantially expanded in eutherians (placental mammals) [Citation36,Citation37]. Additionally, ZNF197 specifically appears to be under positive selection among Homininae (includes genera Homo, Pan and Gorilla), and likely plays a role in placentation [Citation38]. Finally, in a hepatic cell line (HepG2), ZNF197 is differentially expressed with cupric chloride treatment [Citation39].
ZNF197 was significantly co-expressed with 138 other gene transcripts, throughout the genome. These genes are enriched for GO biological process terms for growth and growth hormone secretion, which suggests that the ZNF197 transcriptional network could be involved in foetal growth signalling. Further, transcripts that were co-expressed with ZNF197 were enriched among transcripts that are significantly associated with birth weight. We observe a negative association between placental copper and SGA birth in RICHS, but not in NHBCS. RICHS is better powered to detect this association, given the oversampling of extremes, but likely the effect estimate is biased, and would be attenuated in a more general population. Reports of both negative [Citation5] and positive [Citation3,Citation4] associations between placental copper and birth weight exist in extant research studies. This disagreement is not altogether unexpected, since both low and high concentrations of copper are detrimental and the prevalence of copper deficiency varies by the study population. In populations where copper deficiency is common [Citation40,Citation41], one might expect to find a positive correlation between copper and birth weight.
The motif analysis of ZNF197 suggests that it may be involved in copper metabolism, by targeting CCDC93, which is involved in trafficking ATP7A [Citation42]. However, by sharing information between ZNF197 motif-binding and co-expression, we find that targets of ZNF197 may be more broadly involved in placentation, placental development, metabolism and foetal growth. GLI2 is a regulator of the HedgeHog pathway, is required for embryonic development and maintaining placental function [Citation43]. GLI2 is also differentially methylated in placentae from early-onset preeclampsia [Citation44]. BSG, a plasma membrane protein in the immunoglobulin superfamily, is important to implantation [Citation45]. Though it has not been previously described in placenta, in cancer studies, LINC00968 is associated with the activation of the WNT signalling pathway [Citation46]. WNT, a key patterning gene, has been implicated in placental invasion and development through DNA methylation studies [Citation47,Citation48].
Copper concentration in placental tissue and maternal serum has been linked to adverse birth outcomes, including low birth weight [Citation3–Citation5,Citation9], diabetes [Citation49–Citation51] and preeclampsia [Citation11,Citation52]. All of these adverse outcomes are also linked to oxidative stress [Citation6,Citation10,Citation11]. It is intriguing to consider our findings from that perspective. One of our most significant DMPs, GSTP1, is linked to oxidative stress [Citation35,Citation53] and our most significant DMR, ZNF197, has been linked to Hypoxia Inducible Factor 1a (HIF1A) [Citation28], which is stabilized by copper [Citation54]. While our top results, an antioxidant and a transcription factor linked to hypoxia response, may seem paradoxical – hypoxia leads to oxidative stress through the generation of superoxide anions by mitochondria [Citation55]. However, expression of ZNF197 and HIF1A were not significantly associated in this study, and we did not find evidence of differential expression of any other markers of oxidative stress, including the cuproenzyme Cu, Zn-superoxide dismutase (SOD1). Yet, these enzymes are more prominently controlled in the post-translational level, and so not identifying transcript changes may be indicative of their normal physiologic regulation.
To our knowledge, this is the only study yet to examine the relationships between human placental copper and DNAm. Despite this, many of our individual findings are consistent with copper research in other models and tissues. In rodent livers and placentae, higher copper correlates with global hypomethylation [Citation19–Citation21]. Antioxidant enzymes within glutathione metabolism (specifically GSTP1) associate with copper in liver among humans, rodents and canines. Although it has not been studied extensively, ZNF197 is differentially expressed in cultured liver cells treated with copper salts. This consistency across multiple studies, with different technologies, models, and tissues, is notable. It lends support that our results are robust and relevant within the broader topic of placental health and early development. However, our findings should be interpreted within the context of this study’s limitations.
This is an observational study in which placental copper concentrations and DNAm levels were both measured in placenta at term. Thus, we cannot conclude that our results are representative of copper and DNAm associations throughout development. We adjusted for likely confounders in our study, but cannot rule out the possibility that unmeasured or residual confounding remains in our analysis. Two potential confounders are self-reported maternal smoking and ethnicity. We adjusted for any reported smoking during pregnancy in our primary analysis, but self-reported smoking lacks the sensitivity of the biomarker, cotinine, which could also detect exposure to secondhand smoke [Citation56]. Similarly, while sensitivity analysis suggests that self-reported ethnicity had little to no effect in our observations, a genetic estimate of heritage may be more informative. To limit statistical confounding due to differing cellular composition between individuals, our models are adjusted for putative cellular heterogeneity. However, a paucity of information about placental cell composition and methylation patterns requires that we use a reference-free approach [Citation57]. Very few of our EWAS results reached any genome-wide significance threshold. Our DMR and enrichment analyses utilized methylation results with raw p-values < 1 × 10⁻⁴. Thus, there are likely some false-positive findings among these hits. Power is a common problem in epigenetic epidemiology given the high dimensionality of the data and the small effect sizes [Citation58]; however, the accordance with our findings with others is encouraging and sufficient motivation for further study of the role of copper metabolism and methylation in pregnancy and placental function. Further, both cohorts utilized in this study consisted predominantly of healthy white mothers from the New England region of the United States, limiting the generalizability of our findings. Lastly, the placental copper concentrations in this study are similar to those previously reported and are likely within the physiologically normal range. As copper deficiency and toxicity are rare in the US, our results are more representative of general population patterns that result from normal variation in copper metabolism.
Conclusion
Placental and foetal development rely on the balance of copper within the placenta. Here we have shown that DNAm patterns within the placenta associate with placental copper status. Specifically, the methylation level and associated expression level of the antioxidant GSTP1 and the transcription factor gene ZNF197 associate with copper level. The expression of ZNF197 is associated with regulators of placentation, genes that associate with birth weight and are enriched in biological processes including growth hormone secretion and multicellular organism growth. The present study provides evidence that placental copper and copper metabolism play a role in placentation, in part through the differential methylation of GSTP1 and ZNF197.
Methods
Cohorts
The New Hampshire Birth Cohort Study (NHBCS) was initiated in 2009 and is an ongoing study comprised of a cohort of mother-infant pairs. Pregnant women between 18 and 45 years of age were recruited from the study’s participating prenatal care clinics in New Hampshire, USA. Women were included in the cohort if their primary source of drinking water was from an unregulated residential well, they had resided in the same household since their last menstrual period and had no plans to move before delivery. All participants provided written informed consent in accordance with the requirements of the Institutional Review Board (IRB) of Dartmouth College. In this study, NHBCS participants were singleton pregnancies recruited between February 2012 and September 2013. Data provided from this cohort are placental copper concentration and site-specific measures of DNA methylation (n = 306). Questionnaires and medical record abstraction were utilized to collect sociodemographic, lifestyle, and anthropometric data ().
The Rhode Island Child Health Study (RICHS) enrolled mother-infant pairs from the Women & Infants Hospital in Providence, Rhode Island, between September 2010 and February 2013. Mothers were at least 18 y of age, had no life-threatening conditions, and delivered singletons free of congenital/chromosomal abnormalities at or after 37 weeks of gestation. Infants who were born small for gestational age (≤10th birth weight percentile) or large for gestational age (≥90th birth weight percentile) were oversampled. Infants who were adequate for gestational age (between the 10th and 90th birth weight percentiles), and matched for gestational age and maternal age were coincidentally enrolled. All participants provided written informed consent and all protocols were approved by the IRBs at the Women & Infants Hospital of Rhode Island and Emory University, respectively. Data provided by this study include placental copper concentrations, site-specific measures of placental DNA methylation (Illumina 450 k beadarray), and placental transcript expression (RNA-seq). Interviewer-administered questionnaires were utilized to collect sociodemographic and lifestyle data. Structured medical record review was used to collect anthropometric and medical history data ().
Data collection
Anthropomorphic measures Both of the studies have parallel demographic and anthropomorphic measures for mothers and babies, as well as placental genome-wide CpG methylation and metal concentration data. Birth weight (g), head circumference (cm), and birth length (cm) were abstracted from medical records. z-Scores were calculated for each, standardized by gestational time and infant sex, via Fenton growth curves [Citation59]. Infants with standardized BW percentiles below the 10th percentile are classified as small for gestational age (SGA); those above the 90th percentile as large for gestational age (LGA); and those between the 10th and 90th percentile as adequate for gestational age (AGA). Mother’s BMI was calculated from height and weight collected from medical records ().
Study covariates Self-reported highest achieved maternal education level was coded as either high school or less or more than high school. Maternal smoking was defined as any self-reported smoking during any point of pregnancy versus reported no smoking during pregnancy. Foetal sex was obtained from medical records. Foetal race was self-reported and coded as white or not white.
Sample collection The same placental sampling protocol was used by both cohorts. Placenta samples were biopsied from the foetal side adjacent to the cord insertion site within 2 h of delivery. Maternal decidua was removed. Samples were placed in RNAlater (Life Technologies) and then frozen at −80°C. Both RNA and DNA were extracted (Norgen Biotek) and quantified using a Qubit Fluorometer (Life Technologies) and were subsequently stored at −80°C.
Measurements
CpG methylation Both cohorts measured DNA methylation via Illumina Infinium Human Methylation 450 K BeadArray (Illumina) at the University of Minnesota Genomics Centre (NHBCS n = 306, RICHS n = 141). Bisulphite modification was performed with the EZ Methylation kit (Zymo Research, Irvine, CA). Samples were randomized across multiple batches and batch variables were recorded to allow for batch-effect corrections. Data were assembled using BeadStudio (Illumina). The raw methylation array data are available via the NCBI Gene Expression Omnibus (GEO) for NHBCS and RICHS via accession numbers GSE71678 and GSE75248, respectively.
Quality control, normalization and filtering of methylation data were all performed in the R statistical programming language. We excluded CpG probes that: had poor detection p-values (p-value > 0.001). No samples had to be excluded due to poor quality (as indicated by having more than 5% failing CpG probes). Background correction, dye bias, and functional normalization were performed via the minfi Bioconductor package [Citation60–Citation62]. Methylation data were exported from minfi as β-values, representing the proportion of methylated alleles for each CpG site. Standardization across probe types was performed via beta mixture quantile (BMIQ) normalization [Citation63]. β-values were adjusted for batch effects using the combat function in the R package, sva [Citation64,Citation65]. β-values were logit-transformed (M-values) to better approximate a normal distribution [Citation66]. Prior to downstream analysis, CpG probes were filtered to remove probes that were located on the X- or Y-chromosomes, had a single nucleotide polymorphism (SNP; with minor allele frequency >1%) within 10 bp of the target CpG [Citation67], or were non-specific [Citation68]. After QC and filtering, 409,882 CpG probes from 306 placental samples for NHBCS and 398,332 CpG probes from 141 placental samples for RICHS remained for analysis.
Using the 450 K CpG methylation data, we estimated the proportions of constituent putative cell types in each placental sample with non-negative matrix factorization via RefFreeEWAS package in R [Citation57]. Using the 10,000 CpGs with the greatest variability in methylation, we identified four putative constituent cell mixtures in the RICHS and NHBCS cohorts, respectively, and then used the full set of CpGs for each cohort (NHBCS p = 408,367 and RICHS p = 397,040) to estimate the relative proportions of each putative cell type per placental sample.
Gene expression Transcriptome-wide sequencing was performed on 197 placental samples from RICHS, including the 141 samples with 450 K methylation array data and measured placental copper. We used an RNeasy Mini Kit (Qiagen) to isolate total RNA, which was then stored at −80°C until analysis. We quantified RNA using a Nanodrop Spectrophoto-metre (Thermo Scientific), assessed RNA integrity via Agilent Bioanalyzer (Agilent), removed ribosomal RNA with a Ribo-Zero Kit [Citation69], converted to cDNA using random hexamers (Thermo Scientific), and performed transcriptome-wide RNA sequencing via the HiSeq 2500 platform (Illumina) [Citation70]. Raw reads have been deposited at the NCBI sequence read archive (SRP095910).
QC was performed in FastQC. Reads passing QC were mapped to the human reference genome (h19) using the Spliced Transcripts Alignment to a Reference (STAR) aligner. Further QC was performed with the Bioconductor package, edgeR [Citation71]. Low-expressed transcripts were excluded and the remaining transcripts normalized via the trimmed mean of M-values (TMM) method [Citation72]. Robust estimates of dispersion were calculated [Citation73]. Annotation for the transcripts was provided by the biomaRt package for the ensembl GCh37 human reference genome [Citation30,Citation74]. Transcripts that had no annotation were removed. Normalized transcript data were exported from edgeR as counts per million (CPM) for surrogate variable analysis.
To adjust for unmeasured confounding effects, such as cell-type heterogeneity, we generated surrogate variables from the normalized transcript reads (as CPM) via the svaseq function in the sva package [Citation65,Citation75]. The number of surrogate variables was estimated with the num.sv function using the Buja and Eyuboglu (‘be’) method and 100 permutations. In the svaseq function, the iteratively re-weighted least-squares method was used to empirically estimate of control transcripts. The model (design) argument used for num.sv and svaseq differed by the application. To compare methylation and expression, target CpG M-values alone were used for the model. For co-expression analyses, only log2(CPM) of the target transcript was used for the model. The recommended number of surrogate variables were added to downstream models.
Copper quantification For both RICHS and NHBCS placental samples, copper concentrations were quantified at the Dartmouth Trace Elements Analysis Core using inductively coupled plasma mass spectrometry (ICP-MS). Details of the processing are described elsewhere [Citation76]. None of the samples in either cohort had non-detectable copper concentrations. We dichotomized copper concentrations by the study-specific median concentration (857.2 μg/g) for the EWAS analysis.
Statistical analysis
Robust linear modelling of methylation data For each CpG, we used robust linear models to regress methylation M-values on copper status for all samples. Each model included covariates for infant’s sex, maternal smoking status, maternal education level and the four cell-type covariates determined by refFreeEWAS. This analysis was conducted in R. The robust linear models were run with the rlm function from the MASS package [Citation77]. Estimates, standard errors, test statistics, and P-values were generated with the coeftest function in the lmtest package [Citation78]. The covariance matrix of the estimated coefficients (vcov argument) were supplied by the vcovHC function (type = ‘HC0’) in the sandwich package [Citation79,Citation80].
METAL meta-analysis We used inverse variance weighted fixed-effects models to meta-analyse the cohort-specific copper-associations via the METAL software package. We filtered CpGs with significant interstudy heterogeneity (Cochran’s Q-test p-values < 0.05) [Citation81]. In R, the p.adjust function in the stats package was used to calculate false discovery rates [Citation82].
Comb-p for DMRs To find contiguous genomic regions with differential methylation (differentially methylated region, DMR), we used the Comb-P method [Citation83]. Comb-P identifies genomic regions enriched for low p-values (meta P < 1e-4), corrects for auto-correlation with neighbouring CpGs (within 1000 bp) using the Stouffer-Liptak method, then generates a regional P-values adjusted for multiple testing, using the Sidak correction. DMRs with an adjusted regional P-value less than 0.05 were considered significant.
CpG Annotation Genomic intervals for CpG islands (CGI), chromHMM states [Citation25,Citation26], and DNaseI hypersensitivity were downloaded from the UCSC Genome Browser (hg19/GRCh37) [Citation27]. CpG sites were annotated to a CGI if they were within a CGI interval, annotated to the CGI shores if they were within the 2 kb region flanking a CGI, and annotated to a CGI shelf if they were within the 2 kb flanking CGI shores. Open sea CpGs are not within CGI, shores or shelves. CpGs were also annotated to a chromatin-based functional genomic category (e.g. promoter, enhancer, transcribed region) using ChromHMM, established by Ernst and Kellis [Citation25] and applied to foetal placenta cells [Citation26]. DNaseI hypersensitivity intervals were used to confirm open chromatin around significant DMRs.
edgeR-robust QL F-tests of sequence transcripts To model RNA-seq data, we used the R Bioconductor package, edgeR. Normalized and filtered data were fit to a negative binomial-generalized linear model, with robust quasi-likelihood (QL) methods to account for gene-specific variability (glmQLFit, robust). Hypothesis testing via edgeR quasi-likelihood F-tests (glmQLFtest) compared methylation M-values from the most significant CpG within each DMR to the log(CPM) of transcripts within 1 MB of the DMR, while also accounting for the recommended number of surrogate variables [Citation73]. Transcripts with an FDR < 0.05 were considered significantly differentially expressed.
edgeR was used as described above to assess the co-expression of genes. For this application, log(CPM) for ZNF197 (ENSG00000186448) was tested against the log(CPM) of all other transcripts passing QC and filtering, while also accounting for the recommended number of surrogate variables. Transcripts with an FDR < 0.05 were considered significantly differentially co-expressed with ZNF197.
edgeR was used as described above to model the associations between birth weight percentile and RNA transcript abundance. Here, each infant’s birth weight percentile [Citation59] was tested against the log(CPM) of all other transcripts passing QC and filtering, while also accounting for race, sex, known batch and the recommended number of surrogate variables. Transcripts with an FDR < 0.05 were considered significantly differentially co-expressed with ZNF197.
MEME-FIMO motif analysis The consensus binding motif for ZNF197 [Citation29] was compared the Ensembl human reference genome (GRCh38) in the Find Individual Motif Occurrences (FIMO) tool from MEME suite 5.0.2 (http://meme-suite.org; [Citation84]). The results were re-annotated to the GRCh37 Ensembl human reference genome and then filtered to only those occurrences that coincided with open chromatin as indicated by the DNase-seq of a placenta sample from a 113d foetus (Roadmap Epigenomics Project; ENCSR035QHH [Citation26]). Motifs were also filtered to those that matched orientation with and were within 1500 bp of a gene TSS (in Ensembl GRCh37). Motifs were ranked by the P-values assigned by FIMO.
Rank aggregation Ensembl IDs and (minimum, if multiple IDs were present) p-values from the ZNF197 co-expression analysis and motif analysis, respectively, were filtered to the intersecting Ensembl IDs and ranked by P-value. The RankAggreg function from the RankAggreg R package [Citation31] was used to create an optimized rank of the top 25 ensembl IDs, using the Cross-Entropy Monte Carlo algorithm, (P-value) weighted-Spearman distance, and a rho value of 0.01.
Enrichment tests Fisher’s exact tests were used to test the enrichment of significant ZNF197 motif occurrences among genes that are significantly co-expressed with ZNF197. Fisher’s exact tests were also used to test the enrichment of genes that are co-expressed with ZNF197 among the genes that are associated with birth weight percentile. Finally, among significant CpGs from the meta-analysis, fisher’s exact tests were used to assess enrichment of positively or negatively associated CpG sites within each of the ChromHMM chromatin states, as well as within CGI, shores and shelves.
Gene Ontology analysis Gene ontology analysis was conducted via the goana function in the limma package [Citation85]. GO analysis was used to test for the enrichment of gene ontology terms among the genes that are co-expressed with ZNF197.
Multinomial logistic regression Multinomial logistic regression was used to determine the odds of SGA or LGA, with reference to AGA status with placental copper concentration. Birth weight group (defined above) was regressed on dichotomized placental copper concentration, with the function multinom function in the R package nnet [Citation77].
Supplemental Material
Download Zip (43.9 MB)Disclosure statement
No potential conflict of interest was reported by the authors.
Supplementary material
Supplemental data for this article can be accessed here.
Additional information
Funding
Related Research Data
References
- Collins JF, Klevay LM. Copper. Adv Nutr. 2011;2:520–522.
- Crisponi G, Nurchi VM, Fanni D, et al. Copper-related diseases: from chemistry to molecular pathology. Coord Chem Rev. 2010;254:876–889.
- Zadrożna M, Gawlik M, Nowak B, et al. Antioxidants activities and concentration of selenium, zinc and copper in preterm and IUGR human placentas. J Trace Elem Med Biol. 2009;23:144–148.
- Mbofung CMF, Subbarau VV. Trace element (Zinc, copper, iron and magnesium) concentrations in human placenta and their relationship to birth weight of babies. Nutr Res. 1990;10:359–366.
- Kantola M, Purkunen R, Kröger P, et al. Accumulation of Cadmium, Zinc, and Copper in maternal blood and developmental placental tissue: differences between Finland, Estonia, and St. Petersburg. Environ Res. 2000;83:54–66.
- Ergaz Z, Guillemin C, Neeman-azulay M, et al. Placental oxidative stress and decreased global DNA methylation are corrected by copper in the Cohen diabetic rat. Toxicol Appl Pharmacol. 2014;276:220–230.
- Bermúdez L, García-Vicent C, López J, et al. Assessment of ten trace elements in umbilical cord blood and maternal blood: association with birth weight. J Transl Med. 2015;13:291.
- Alebic-Juretic A, Frkovic A. Plasma copper concentrations in pathological pregnancies. J Trace Elem Med Biol. 2005;19:191–194.
- Osada H, Watanabe Y, Nishimura Y, et al. Profile of trace element concentrations in the feto-placental unit in relation to fetal growth. Acta Obstet Gynecol Scand. 2002;81:931–937.
- Bellos I, Papantoniou N, Pergialiotis V. Serum ceruloplasmin levels in preeclampsia: a meta-analysis. J Matern Fetal Neonatal Med. 2018;31:2342–2348.
- Sak S, Barut M, Çelik H, et al. Copper and ceruloplasmin levels are closely related to the severity of preeclampsia. J Matern Fetal Neonatal Med. 2018;1–7.
- Hardman B, Michalczyk A, Greenough M, et al. Distinct functional roles for the Menkes and Wilson copper translocating P-type ATPases in human placental cells. Cell Physiol Biochem Int J Exp Cell Physiol Biochem Pharmacol. 2007;20:1073–1084.
- Irwinda R, Wibowo N, Putri AS. The Concentration of micronutrients and heavy metals in maternal Serum, Placenta, and Cord Blood: a cross-sectional study in preterm birth [Internet]. J Pregnancy. 2019;2019:1–7. [cited 2019 Apr 17]. Available from: https://www.hindawi.com/journals/jp/2019/5062365/
- McArdle HJ, Andersen HS, Jones H, et al. Copper and Iron Transport Across the Placenta: regulation and Interactions. J Neuroendocrinol. 2008;20:427–431.
- Sawicka-Kapusta K, Bydlon G, Zakrzewska M, et al. Heavy metal concentration in human Placenta from Southern Poland. [ cited 2019 Apr 24]. Available from: http://inis.iaea.org/Search/search.aspx?orig_q=RN:41131312
- Mukhacheva SV, Bezel’ VS. Heavy metals in the mother–placenta–fetus system in bank voles under conditions of environmental pollution from copper plant emissions. Russ J Ecol. 2015;46:564–572.
- Malik A, Khawaja A, Sheikh L. Wilson’s disease in pregnancy: case series and review of literature. BMC Res Notes. 2013;6:421.
- Walker LR, Rattigan M, Canterino J. A case of isolated elevated copper levels during pregnancy. J Pregnancy. 2011;2011:385767.
- Medici V, Shibata NM, Kharbanda KK, et al. Wilson disease: changes in methionine metabolism and inflammation affect global DNA methylation in early liver disease. Hepatol Baltim Md. 2013;57:555–565.
- Le A, Shibata NM, French SW, et al. Characterization of Timed changes in Hepatic copper concentrations, Methionine Metabolism, Gene Expression, and Global DNA Methylation in the Jackson Toxic milk mouse model of Wilson Disease. Int J Mol Sci. 2014;15:8004–8023.
- Mordaunt CE, Shibata NM, Kieffer DA, et al. Epigenetic changes of the thioredoxin system in the tx-j mouse model and in patients with Wilson disease. Hum Mol Genet. 2018;27:3854–3869.
- Delgado M, Pérez-Miguelsanz J, Garrido F, et al. Early effects of copper accumulation on methionine metabolism. Cell Mol Life Sci CMLS. 2008;65:2080–2090.
- Hardman B, Michalczyk A, Greenough M, et al. Hormonal regulation of the Menkes and Wilson copper-transporting ATPases in human placental Jeg-3 cells. Biochem J. 2007;402:241–250.
- Beshgetoor D, Hambidge M. Clinical conditions altering copper metabolism in humans. Am J Clin Nutr. 1998;67:1017S–1021S.
- Ernst J, Kellis M. Chromatin-state discovery and genome annotation with ChromHMM. Nat Protoc. 2017;12:2478–2492.
- Roadmap Epigenomics Consortium, Kundaje A, Meuleman W, et al. Integrative analysis of 111 reference human epigenomes. Nature. 2015;518:317–330.
- Karolchik D, Hinrichs AS, Furey TS, et al. The UCSC Table Browser data retrieval tool. Nucleic Acids Res. 2004;32:D493–496.
- Li Z, Wang D, Na X, et al. The VHL protein recruits a novel KRAB-A domain protein to repress HIF-1α transcriptional activity. Embo J. 2003;22:1857–1867.
- Lambert SA, Jolma A, Campitelli LF, et al. The Human Transcription Factors. Cell. 2018;172:650–665.
- Yates A, Akanni W, Amode MR, et al. Ensembl 2016. Nucleic Acids Res. 2016;44:D710–D716.
- Pihur V, Datta S, Datta S. RankAggreg, an R package for weighted rank aggregation. BMC Bioinformatics. 2009;10:62.
- Iyengar GV, Rapp A. Human placenta as a ‘dual’ biomarker for monitoring fetal and maternal environment with special reference to potentially toxic trace elements: part 2: essential minor, trace and other (non-essential) elements in human placenta. Sci Total Environ. 2001;280:207–219.
- Kennedy EM, Goehring GN, Nichols MH, et al. An integrated -omics analysis of the epigenetic landscape of gene expression in human blood cells. BMC Genomics. 2018;19:476.
- Zusterzeel PLM, Peters WHM, De Bruyn MAH, et al. Glutathione S-transferase isoenzymes in decidua and placenta of preeclamptic pregnancies. Obstet Gynecol. 1999;94:1033–1038.
- Simpson DM, Beynon RJ, Robertson DHL, et al. Copper-associated liver disease: a proteomics study of copper challenge in a sheep model. PROTEOMICS. 2004;4:524–536.
- Kaneko-Ishino T, Ishino F. The role of genes domesticated from LTR retrotransposons and retroviruses in mammals. Front Microbiol. 2012;3:262.
- Edelstein LC, Collins T. The SCAN domain family of zinc finger transcription factors. Gene. 2005;359:1–17.
- Crosley EJ, Elliot MG, Christians JK, et al. Placental invasion, preeclampsia risk and adaptive molecular evolution at the origin of the great apes: evidence from genome-wide analyses. Placenta. 2013;34:127–132.
- Muller P, van Bakel H, van de Sluis B, et al. Gene expression profiling of liver cells after copper overload in vivo and in vitro reveals new copper-regulated genes. JBIC J Biol Inorg Chem. 2007;12:495–507.
- Ugwuja EI, Akubugwo EI, Ibiam U, et al. lasma Copper and Zinc among Pregnant women in Abakaliki, Southeastern Nigeria. Internet J Nutr Wellness. 2010;10:unpaginated ref.41.
- Winiarska-Mieczan A. Cadmium, Lead, Copper and Zinc in breast milk in Poland. Biol Trace Elem Res. 2014;157:36–44.
- Phillips-Krawczak CA, Singla A, Starokadomskyy P, et al. COMMD1 is linked to the WASH complex and regulates endosomal trafficking of the copper transporter ATP7A. Mol Biol Cell. 2015;26:91–103.
- Tang C, Mei L, Pan L, et al. Hedgehog signaling through GLI1 and GLI2 is required for epithelial-mesenchymal transition in human trophoblasts. Biochim Biophys Acta. 2015;1850:1438–1448.
- Yuen RK, Peñaherrera MS, von Dadelszen P, et al. DNA methylation profiling of human placentas reveals promoter hypomethylation of multiple genes in early-onset preeclampsia. Eur J Hum Genet. 2010;18:1006–1012.
- Igakura T, Kadomatsu K, Kaname T, et al. A null mutation in Basigin, an Immunoglobulin superfamily member, indicates its important roles in Peri-implantation Development and Spermatogenesis. Dev Biol. 1998;194:152–165.
- Wang Y, Zhou J, Xu Y-J, et al. Long non-coding RNA LINC00968 acts as oncogene in NSCLC by activating the Wnt signaling pathway. J Cell Physiol. 2018;233:3397–3406.
- Wong NC, Novakovic B, Weinrich B, et al. Methylation of the adenomatous polyposis coli (APC) gene in human placenta and hypermethylation in choriocarcinoma cells. Cancer Lett. 2008;268:56–62.
- Novakovic B, Rakyan V, Ng HK, et al. Specific tumour-associated methylation in normal human term placenta and first-trimester cytotrophoblasts. Mol Hum Reprod. 2008;14:547–554.
- Li P, Yin J, Zhu Y, et al. Association between plasma concentration of copper and gestational diabetes mellitus. Clin Nutr Edinb Scotl. 2019.
- Atari-Hajipirloo S, Valizadeh N, Khadem-Ansari M-H, et al. Altered Concentrations of Copper, Zinc, and Iron are associated with increased levels of Glycated Hemoglobin in patients with type 2 diabetes mellitus and their first-degree relatives. Int J Endocrinol Metab. 2016;14:e33273.
- Mishu FA, Muttalib MA, Sultana B. Serum zinc and copper levels in gestational diabetes mellitus in a tertiary care hospital of Bangladesh. BIRDEM Med J. 2018;8:52–55.
- Guller S, Buhimschi CS, Ma YY, et al. Placental expression of ceruloplasmin in pregnancies complicated by severe preeclampsia. Lab Investig J Tech Methods Pathol. 2008;88:1057–1067.
- Mistry HD, Kurlak LO, Williams PJ, et al. Differential expression and distribution of placental glutathione peroxidases 1, 3 and 4 in normal and preeclamptic pregnancy. Placenta. 2010;31:401–408.
- Collins JF, Prohaska JR, Knutson MD. Metabolic crossroads of iron and copper. Nutr Rev. 2010;68:133–147.
- Thompson LP, Al-Hasan Y. Impact of oxidative stress in fetal programming. J Pregnancy. 2012;2012:582748.
- Lindsay RP, Tsoh JY, Sung H-Y, et al. Secondhand smoke exposure and serum cotinine levels among current smokers in the USA. Tob Control. 2016;25:224–231.
- Houseman EA, Kile ML, Christiani DC, et al. Reference-free deconvolution of DNA methylation data and mediation by cell composition effects. BMC Bioinformatics. 2016;17:259.
- Bakulski KM, Fallin MD. Epigenetic epidemiology: promises for public health research. Environ Mol Mutagen. 2014;55:171–183.
- Fenton TR, Kim JH. A systematic review and meta-analysis to revise the Fenton growth chart for preterm infants. BMC Pediatr. 2013;13:59.
- Fortin J-P, Triche TJ, Hansen KD. Preprocessing, normalization and integration of the Illumina HumanMethylationEPIC array with minfi. Bioinforma Oxf Engl. 2017;33:558–560.
- Aryee MJ, Jaffe AE, Corrada-Bravo H, et al. Minfi: a flexible and comprehensive Bioconductor package for the analysis of Infinium DNA methylation microarrays. Bioinforma Oxf Engl. 2014;30:1363–1369.
- Triche TJ, Weisenberger DJ, Van Den Berg D, et al. Low-level processing of Illumina Infinium DNA Methylation BeadArrays. Nucleic Acids Res. 2013;41:e90.
- Teschendorff AE, Marabita F, Lechner M, et al. A beta-mixture quantile normalization method for correcting probe design bias in Illumina Infinium 450 k DNA methylation data. Bioinforma Oxf Engl. 2013;29:189–196.
- Johnson WE, Li C, Rabinovic A. Adjusting batch effects in microarray expression data using empirical Bayes methods. Biostat Oxf Engl. 2007;8:118–127.
- Leek JT, Johnson WE, Parker HS, et al. The sva package for removing batch effects and other unwanted variation in high-throughput experiments. Bioinforma Oxf Engl. 2012;28:882–883.
- Du P, Zhang X, Huang -C-C, et al. Comparison of Beta-value and M-value methods for quantifying methylation levels by microarray analysis. BMC Bioinformatics. 2010;11:587.
- Barfield RT, Almli LM, Kilaru V, et al. Accounting for population stratification in DNA methylation studies. Genet Epidemiol. 2014;38:231–241.
- Chen Y, Lemire M, Choufani S, et al. Discovery of cross-reactive probes and polymorphic CpGs in the Illumina Infinium HumanMethylation450 microarray. Epigenetics. 2013;8:203–209.
- Huang R, Jaritz M, Guenzl P, et al. An RNA-Seq strategy to detect the complete coding and non-coding transcriptome including full-length imprinted macro ncRNAs. PloS One. 2011;6:e27288.
- Bentley DR, Balasubramanian S, Swerdlow HP, et al. Accurate whole human genome sequencing using reversible terminator chemistry. Nature. 2008;456:53–59.
- Robinson MD, McCarthy DJ, Smyth GK. edgeR: a Bioconductor package for differential expression analysis of digital gene expression data. Bioinforma Oxf Engl. 2010;26:139–140.
- Robinson MD, Oshlack A. A scaling normalization method for differential expression analysis of RNA-seq data. Genome Biol. 2010;11:R25.
- Chen Y, Lun ATL, Smyth GK. From reads to genes to pathways: differential expression analysis of RNA-Seq experiments using Rsubread and the edgeR quasi-likelihood pipeline. F1000Res. 2016;5:1438.
- Durinck S, Spellman PT, Birney E, et al. Mapping identifiers for the integration of genomic datasets with the R/Bioconductor package biomaRt. Nat Protoc. 2009;4:1184–1191.
- Leek JT. svaseq: removing batch effects and other unwanted noise from sequencing data. Nucleic Acids Res. 2014;42:e161–e161.
- Punshon T, Li Z, Marsit CJ, et al. Placental Metal Concentrations in Relation to Maternal and Infant Toenails in a U.S. Cohort. Environ Sci Technol. 2016;50:1587–1594.
- Venables WN, Ripley BD. Modern Applied Statistics with S [Internet]. 4th ed. New York (NY): Springer; 2002 [cited 2018 Nov 28]. Available from: www.springer.com/us/book/9780387954578
- Zeileis A, Hothorn T. Diagnostic checking in regression relationships. R News. 2002 Dec;2:7–10.
- Zeileis A. Object-oriented Computation of Sandwich Estimators. J Stat Softw. 2006;16:1–16.
- Zeileis A. Econometric Computing with HC and HAC Covariance Matrix Estimators. J Stat Softw. 2004;11:1–17.
- Willer CJ, Li Y, Abecasis GR. METAL: fast and efficient meta-analysis of genomewide association scans. Bioinforma Oxf Engl. 2010;26:2190–2191.
- Benjamini Y, Hochberg Y. Controlling the false discovery rate: a practical and powerful approach to multiple testing. J R Stat Soc Ser B Methodol. 1995;57:289–300.
- Pedersen BS, Schwartz DA, Yang IV, et al. Comb-p: software for combining, analyzing, grouping and correcting spatially correlated P-values. Bioinformatics. 2012;28:2986–2988.
- Grant CE, Bailey TL, Noble WS. FIMO: scanning for occurrences of a given motif. Bioinformatics. 2011;27:1017–1018.
- Ritchie ME, Phipson B, Wu D, et al. limma powers differential expression analyses for RNA-sequencing and microarray studies. Nucleic Acids Res. 2015;43:e47.