
ABSTRACT
Epigenetic information is able to interact with the cellular environment and could be especially useful for reprograming gene expression in response to a physiological perturbation. In fact the genes induced or repressed by osmotic stress undergo significant changes in terms of the levels of various histone modifications, especially in the acetylation levels of histone H3. Exposing yeast to high osmolarity results in the activation of stress-activated protein kinase Hog1, which plays a central role in gene expression control. We evaluated the connection between the presence of Hog1 and changes in histone H3 acetylation in stress-regulated genes. We found a parallel increase in the acetylation of lysines 9 and 14 of H3 in induced genes during stress, which was largely dependent on Hog1 at the genome-wide level. Conversely, we observed that acetylation decreased in repressed genes and was not dependent on Hog1. However, lack of Hog1 sometimes produced different, and even opposite, effects on the induction and acetylation of H3 of each gene. We also found that the acetylation state of lysine 9 of H3 was altered in the strains deficient in Nut1 HAT and Hos1 HDAC in the genes up-regulated during osmotic stress in an Msn2/Msn4-independent manner, while lysine 9 acetylation of H3 varied in the strains deficient in Sas2 HAT and Rpd3 HDAC for the Msn2/Msn4-dependent induced genes. The results presented here show new, unexpected participants in gene regulation processes in response to environmental perturbations.
Introduction
In eukaryotic cells, genetic material is packed in a complex structure called chromatin. Most of the information needed for living cells comes ultimately from the DNA sequence. However, in addition to the genetic information, there is another type of information, called epigenetics, which is formed by different patterns of marks, such as DNA methylation and histone modifications. While the information stored in the DNA sequence of an organism remains virtually unchanged, epigenetic information is able to vary by interacting with the environment, thus modulating and regulating essential chromatin functions, particularly the activation or repression of gene transcription. This hence constitutes a mechanism by which cells can adapt to possible changes in their environment.
Histones take part in epigenetic information by undergoing multiple post-translational modifications, most of which are reversible (reviewed in [Citation1]), whose multiple combinations have been called the histone code [Citation2–Citation5]. It has been postulated that the different patterns of histone modifications could act as a signalling system by actively participating in the recognition of, and the interaction with, trans-acting regulator factors [Citation2–Citation5]. Alternatively, histone modifications can directly affect the nucleosome structure to facilitate DNA accessibility by allowing for trans-acting factors to gain access to DNA [Citation6,Citation7]. These two proposed mechanisms could also act simultaneously. It is noteworthy that the epigenetic modulation of gene expression by environmental factors is emerging as an important mechanism in different diseases, such as cancer, neurogenerative conditions, for example Parkinson’s disease, and psychiatric disorders like schizophrenia [Citation8–Citation10].
One of the most extensively studied histone modifications, and one that is most directly related to gene expression regulation, is lysine acetylation. In vivo there are two enzymatic activities that can alter the acetylation state of histones, namely histone acetyltransferases (HATs) and histone deacetylases (HDACs). Most have physico-functional connections to transcriptional regulation, and act as complexes composed of several subunits that can modulate their activities. Classically, HATs have been associated with gene expression activation, whereas HDACs have been involved in gene repression. Consistently, histone acetylation and deacetylation have been linked with transcriptional activity and inactivity, respectively. Several genome-wide studies have shown in the yeast Saccharomyces cerevisiae that H3 acetylation at the promoters is the histone modification that best correlates with transcriptional activity [Citation11–Citation13]. Interestingly, this suggests something special about this histone, because most HATs have potential H3 acetylation activity, either exclusively or accompanied by other specificities. So, even though several proteins exhibit histone acetyltransferase activity in yeast, if we omit Hat1p [Citation14] and Esa1p [Citation15,Citation16], which selectively modify histone H4, the other HATs have a marked preference for histone H3. More specifically, it has been reported that Gcn5p [Citation17], Sas3p [Citation18], Nut1p [Citation19], Sas2p [Citation20] and Hpa2p [Citation21] preferentially acetylate H3. Taf1p [Citation22] and Elp3p [Citation23] were initially described as HATs with specificity for H3. However, it has been subsequently shown that neither protein is actually a HAT in vivo [Citation24–Citation26]. Histone H3 is also a substrate of several HDACs present in yeast, such as Rpd3 [Citation27], Hda1 [Citation28], and Hos2 [Citation29]. Other HDACs have been described in yeast, for example Sir2, which is able to deacetylate H3 in vitro [Citation30] but whose function appears to be the deacetylation of lysine 16 of H4 in promoting silencing (reviewed in [Citation31]). There are also others, like Hos1 and Hos3, whose specificity is not well known.
Transcription initiation by RNA polymerase II is regulated by many proteins that range from sequence-specific DNA binding factors to general transcription machinery and its regulators (reviewed in [Citation32]). Coactivators, such as SAGA (Spt-Ada-Gcn5), TFIID, and Mediator, are conserved multiprotein complexes that are recruited to cognate promoters, which leads to RNA polymerase II recruitment and subsequent preinitiation complex formation [Citation33]. Interestingly, many of these complexes have proteins with histone-modifying enzymatic activity among their subunits. It is generally accepted that histone modifications should play a role in the preinitiation complex assembly process, which leads to transcriptional activation (reviewed in [Citation32]). Although research has been intense in this field, mechanistic descriptions of how cellular signals drive the selection of specific histone-modifying activities to yield local chromatin changes to allow gene activation are still lacking.
A widely used model system to dissect the transcriptional activation process is physiological perturbation, such as osmotic stress, which causes genome-wide transcriptional changes in yeast. This system is suitable not only because the molecular mechanism has been well studied, but also because the activation of osmotic stress-responsive genes can be performed by several mechanisms, including the recruitment of chromatin-modifying activities (reviewed in [Citation34]). Exposure of yeast to osmotic stress results in the activation of stress-activated protein kinase (SAPK) Hog1, which plays a central role in reprograming gene expression in the cell. Active Hog1 directly regulates several unrelated transcription factors, such as Hot1, Smp1, Msn1, Msn2/Msn4 and Sko1, and each is responsible for controlling the expression of a subset of osmoresponsive genes either directly or in collaboration with other factors [Citation35,Citation36]. It is worth noting that the functional hierarchy between Hog1 kinase and some of these factors is dynamic because, for instance, recruitment of Hog1 to the STL1 promoter depends on activator Hot1, whereas recruitment of the kinase to the CTT1 promoter depends on transcription factors Msn2 and Msn4 [Citation37]. Once at the promoters, Hog1 also participates in recruiting basic transcription complexes, such as SAGA or Mediator, chromatin-modifying activities, such as SWI/SNF or the large Rpd3L complex and, finally, RNA polymerase II [Citation38–Citation43]. It is important to highlight that some of these complexes have proteins among their subunits capable of modifying the state of acetylation of histones. For instance, Gcn5 and Nut1 HATs are components of SAGA and Mediator, respectively, and Rpd3 is the catalytic subunit of the Rpd3L complex with HDAC activity. Therefore, it is quite likely that the acetylation of histones actively participates in the mechanism of reprograming gene expression in response to osmotic stress.
We have previously reported that the genes induced or repressed by mild osmotic stress (with 0.4 M NaCl) undergo significant genome-wide changes in the levels of various histone modifications within the first 10 minutes of stress. In particular, the genes activated by saline stress increase the acetylation levels in lysines 9 and 14 of histone H3 (H3K9 and H3K14), mainly at the transcription start site (TSS) region [Citation12].
The present study attempts to answer two relevant questions. First, is there a causal connection between the presence of SAPK Hog1 at the promoters of the stress-activated genes and increased histone H3 acetylation? Second, what are the enzymatic HAT and HDAC activities involved in the changes produced in H3K9 acetylation at osmotic stress-induced genes?
Results
Hog1 affects the activity of the osmoresponsive genes and histone H3 acetylation via different mechanisms
We previously showed genome-wide that transcriptional activation or repression of genes by moderate saline stress is accompanied by rapid changes in the acetylation pattern of histones (ref 12). In particular, via ChIP-on-chip experiments using high-resolution tiling microarrays, we showed that acetylation at lysines 9 and 14 of histone H3 increases in osmostress up-regulated genes and decreases in repressed genes [Citation12]. The transcriptional regulation of most of the genes that are strongly responsive to saline stress is quite or fully dependent on the presence of SAPK Hog1 [Citation44–Citation47]. As Hog1 regulates the activation or repression of stress genes via several mechanisms, including the recruitment of several chromatin modifying activities (reviewed in [Citation34]), we wondered whether the increase or decrease in the acetylation of lysine 9 of histone H3 (H3K9ac) also depends on the presence of Hog1. We selected this acetylation site because it is the histone modification that best correlates with transcription activity [Citation12]. However, our results indicated that another H3 acetylation of lysine, namely H3K14ac, behaves similarly to H3K9ac, because we observed a highly positive correlation between changes produced on each position during the stress response [Citation12]. We carried out a chromatin immunoprecipitation analysis for H3K9ac or H3K14ac before and after 10 minutes of osmotic stress (0.4 M NaCl) using high-resolution tiling microarrays, as previously described [Citation12] in a hog1∆ mutant strain. Specifically, we measured the modification levels of H3K9ac or H3K14ac in relation to the H3 unmodified core histone. As an example, shows the H3K9ac profile of the STL1 gene in four independent experiments; in the wild type (wt) before and after stress and in hog1∆ before and after stress. It can be seen that H3K9ac signals before the stress in both wt and hog1∆ strains are similar, and that the stress treatment increases the signal in the wt strain but not in the hog1∆ strain. This result shows that the increase in acetylation of H3K9 in the STL1 gene is completely dependent on the presence of the Hog1 protein. shows the changes observed in the level of H3K9ac from −500 to +500 bp in relation to the actual TSS [Citation48] upon saline stress in the whole set of analysed genes (left columns), in a set of 248 genes defined as being induced by osmotic stress [Citation12,Citation47] (centre columns), or in a set of 397 genes repressed by stress [Citation12,Citation47] (right columns) in both the wt strain, data from [Citation12], and the mutant hog1∆ strain. At the genome-wide scale (left columns), no relevant differences were observed between the wt and the hog1∆ mutant. The set of up-regulated genes (centre columns) presented a low acetylation level before stress in the hog1∆ strain, which was similar to that of the wt strain. However, stress increased only slightly the H3K9ac level in the hog1∆ mutant, while the acetylation level sharply rose in the wt strain. In the case of H3K14, the level of acetylation in the induced genes increased moderately with stress in the wt strain but in the mutant it did not increase, rather it decreased ().
Figure 1. Hog1 affects the changes in acetylation at K9 and K14 of histone H3 observed in the osmoresponsive genes during stress. (a) An example of the data from the genomic ChIP-on-chip experiment. Graphics, obtained by the integrative genomics viewer [Citation73], represent the log2 of the ratios between the immunoprecipitation with H3K9ac antibodies in relation to the immunoprecipitation with H3 core histone antibody (H3K9ac/H3 ratio) for the probes over the STL1 gene region. Samples, from top to bottom: wild-type before and after stress and mutant hog1∆ before and after 10 min of 0.4 M NaCl stress. The genomic positions of probe regions are arrayed at the top of the figure. At the bottom, STL1 ORF is depicted as a rectangle, and the arrow indicates the direction of transcription. Bars below the baseline indicate negative values of the log2 of the ratios between H3K9ac and H3 signals. Bars above the baseline indicate positive log2 H3K9ac/H3 values. Changes in H3K9ac (b) and H3K14 (c) for all genes (Total, n = 5142), the osmostress-induced genes (Induced, n = 248) and the osmostress-repressed genes (Repressed, n = 397) in the wild-type and hog1Δ mutant strains before and after of stress. Acetylation (%) refers to the acetylation signal for all the genes (100%) in the wild-type strain without stress. The acetylation signal was calculated as the area between −500 bp and +500 bp with respect to the TSS of the profile of the log2 values of the specific immunoprecipitation of the modified histone in relation to the immunoprecipitation of the core histone H3 (see Materials and Methods for more details). Data show Standard Error bars.
![Figure 1. Hog1 affects the changes in acetylation at K9 and K14 of histone H3 observed in the osmoresponsive genes during stress. (a) An example of the data from the genomic ChIP-on-chip experiment. Graphics, obtained by the integrative genomics viewer [Citation73], represent the log2 of the ratios between the immunoprecipitation with H3K9ac antibodies in relation to the immunoprecipitation with H3 core histone antibody (H3K9ac/H3 ratio) for the probes over the STL1 gene region. Samples, from top to bottom: wild-type before and after stress and mutant hog1∆ before and after 10 min of 0.4 M NaCl stress. The genomic positions of probe regions are arrayed at the top of the figure. At the bottom, STL1 ORF is depicted as a rectangle, and the arrow indicates the direction of transcription. Bars below the baseline indicate negative values of the log2 of the ratios between H3K9ac and H3 signals. Bars above the baseline indicate positive log2 H3K9ac/H3 values. Changes in H3K9ac (b) and H3K14 (c) for all genes (Total, n = 5142), the osmostress-induced genes (Induced, n = 248) and the osmostress-repressed genes (Repressed, n = 397) in the wild-type and hog1Δ mutant strains before and after of stress. Acetylation (%) refers to the acetylation signal for all the genes (100%) in the wild-type strain without stress. The acetylation signal was calculated as the area between −500 bp and +500 bp with respect to the TSS of the profile of the log2 values of the specific immunoprecipitation of the modified histone in relation to the immunoprecipitation of the core histone H3 (see Materials and Methods for more details). Data show Standard Error bars.](/cms/asset/04e655ec-bddc-4184-aecd-597c95a8b772/kepi_a_1664229_f0001_b.gif)
Hog1 could act by directly recruiting a complex with HAT activity in histone H3. In fact it has been reported that SAGA and Mediator – two complexes with different subunits, among which HAT activities exist that can acetylate H3 – are targeted by Hog1 at the up-regulated genes, where they play a critical role in gene expression [Citation39]. Considering that most of the up-regulated genes depended on Hog1p for their activation, one alternative possibility could be that the non-acetylation of H3 in a hog1∆ mutant was a direct consequence of lack of transcription. In both cases, if the changes in H3 acetylation occurred during stress were always mechanistically linked to the direct action of Hog1, the absence of Hog1 would be expected to have a similar quantitative effect on transcription induction and on the changes in H3 acetylation. Therefore, we wondered if Hog1-dependent gene activation and H3 acetylation correlated to one another. To investigate this possibility, in a set of up-regulated genes, we first analysed the dependence on Hog1p of both its transcriptional activation (from the genomic data of the transcription rates taken from [Citation47]) and its increased acetylation (from our genomic data presented here). The selected group of genes contained many of the most strongly induced and most highly expressed osmoregulated genes [Citation44,Citation47,Citation49]. As seen in , dependency on Hog1 was stronger for transcriptional activation than for acetylation, but different patterns were observed. There are some genes, like STL1, GPD1 or GIS1, in which both processes are almost totally dependent on Hog1, but in others, like CTT1, DDR2, GRE2 or HSP12, acetylation depends on Hog1 much less than activation. Interestingly, there are also some genes, like ARO9, whose activation is moderately dependent on Hog1 and whose acetylation is almost completely independent.
Figure 2. The Hog1 dependency of the changes in gene expression and in H3K9 acetylation during osmotic stress do not correlate. (a) Dependency on Hog1 of transcriptional induction [Citation47] and H3K9 acetylation (our data) of specific osmotic stress up-regulated genes after 10 min of 0.4 M NaCl treatment. (b) Pearson correlation (R = 0.221) between the Hog1 dependency of gene induction and acetylation of all the osmotic stress up-regulated genes (n = 194). (c) Dependency on Hog1 of gene repression [Citation47] and H3K9 deacetylation of specific osmotic stress down-regulated genes after 10 min of 0.4 M NaCl treatment. (d) Pearson correlation (R = −0.031) between the Hog1 dependency of gene repression [Citation47] and deacetylation (our data) of all the osmotic stress down-regulated genes (n = 330). In each gene, the percentage of Hog1-dependent H3K9 acetylation/deacetylation and the percentage of Hog1-dependent induction/repression were calculated as detailed in Materials and Methods.
![Figure 2. The Hog1 dependency of the changes in gene expression and in H3K9 acetylation during osmotic stress do not correlate. (a) Dependency on Hog1 of transcriptional induction [Citation47] and H3K9 acetylation (our data) of specific osmotic stress up-regulated genes after 10 min of 0.4 M NaCl treatment. (b) Pearson correlation (R = 0.221) between the Hog1 dependency of gene induction and acetylation of all the osmotic stress up-regulated genes (n = 194). (c) Dependency on Hog1 of gene repression [Citation47] and H3K9 deacetylation of specific osmotic stress down-regulated genes after 10 min of 0.4 M NaCl treatment. (d) Pearson correlation (R = −0.031) between the Hog1 dependency of gene repression [Citation47] and deacetylation (our data) of all the osmotic stress down-regulated genes (n = 330). In each gene, the percentage of Hog1-dependent H3K9 acetylation/deacetylation and the percentage of Hog1-dependent induction/repression were calculated as detailed in Materials and Methods.](/cms/asset/deb54afd-72cf-4abb-9ee8-6ea462096084/kepi_a_1664229_f0002_b.gif)
To extend our observations, we next analysed the possible correlation between the effect of the absence of Hog1 on both induction [Citation47] and acetylation in the full set of up-regulated genes. The obtained result () showed no correlation between both processes, thus lack of Hog1 often affected a specific gene very differently in terms of its expression and its acetylation pattern in histone H3. also displays transcriptional induction for a very high percentage of the genes strongly depending on Hog1 (most points are located between 75% and 100% of induction dependence), while H3K9 acetylation showed very diverse degrees of Hog1 dependence, from 0 to 100%. The fact that a significant number of genes was found on the lower right-hand side of the panel was noticeable, in which no transcriptional induction, but an increase in H3 acetylation with stress was observed in the absence of Hog1. This result suggests that Hog1 influences the increase in both the transcription and acetylation of stress-inducible genes via different mechanisms.
A large proportion of all the genes repressed by stress encoded either ribosomal proteins or the proteins involved in translation [Citation47,Citation49,Citation50], which means that they were very active before stress. It was, therefore, not surprising that the set of repressed genes presented a high acetylation level before stress for both H3K9ac and H3K14ac, which was above the average value of all the genes, in both the wt strain [Citation12] and the hog1∆ mutant (). Conversely to what happened in the up-regulated genes, the reduced acetylation produced by stress was similar in the wt and hog1∆ mutant strains, which indicates that this process does not depend on Hog1 at the genome-wide level. In fact when we inspected a set of specific genes (), we verified that the dependence on Hog1 for acetylation was clearly lower in these genes than in the induced genes. It was noteworthy that all three genes RKI1, NOG1 and RPL28 also repressed their expression quite independently of Hog1 ([Citation47] and ). We also analysed the possible correlation in the set of down-regulated genes between the effect of lack of Hog1 on both repression [Citation47] and deacetylation, and the obtained result () shows no correlation between them.
Taken together, our data suggest that the histone H3 acetylation or deacetylation produced by salt stress is compromised by the absence of Hog1 in many, but not all, genes. Furthermore, lack of Hog1 often affects a specific gene very differently in terms of its expression and its histone H3 acetylation pattern.
The H3K9 acetylation levels of the msn2/msn4-independent osmotic stress up-regulated genes are affected in mutants nut1 HAT and hos1 HDAC
The microarrays analysis data revealed that H3K9 of the osmotic stress-induced genes was hypoacetylated before stress and hyperacetylated after it ( and [Citation12]). We set out to investigate what HDAC and HAT activities were responsible for these acetylation patterns. To this end, the chromatin obtained from both the wild-type cells and a set of mutants in different HDACs and HATs before and after osmostress was immunoprecipitated using antibodies against α-H3K9ac or α-H3 core histone as the control (see Methods) to be analysed by qPCR. We specifically analysed the nine genes shown in . Strikingly, the H3 acetylation results in the HAT and HDAC mutants clearly revealed two well-differentiated patterns. There were six genes (STL1, GPD1, GRE2, HSP42, GIS1 and ARO9) in which the typical increase in acetylation that accompanied their induction was significantly altered in the strains deficient in the HAT Nut1p ( and statistical analysis in ) and in the HDAC Hos1p ( and statistical analysis in ).
Figure 3. The H3K9 acetylation of the Msn2/Msn4-independent up-regulated genes during osmotic stress depends on HAT Nut1. The BY4742 wild type (wt) and the derivative strains carrying mutations in the indicated HATs were grown in YPD medium, and samples were taken before and after 10 min of 0.4 M NaCl treatment. ChIP experiments with antibodies recognizing H3K9 acetylation and the H3 core histone were conducted. The H3K9ac/H3 ratios were calculated for a gene region (−500 to +500) around the TSS of each indicated Msn2/4-independent up-regulated gene. Data show the mean and error bars (Standard Deviation) of at least three independent experiments.
Figure 4. Statistical significance of the H3K9ac/H3 changes during osmotic stress of the mutants with respect to the wild type. The H3K9 acetylation ratio stress/no stress values for the indicated genes were compared between wild type and mutant strains (data corresponding to , , and ). The p-value of two-tailed student’s t-test analysis using a colour code is represented: grey, no significant differences; light orange, p < 0.05; orange, p < 0.01; red, p < 0.001.
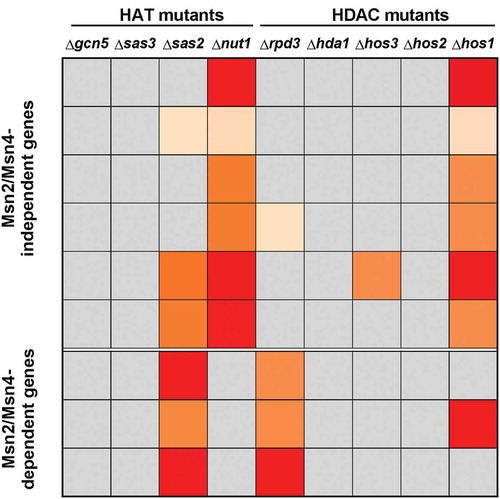
Figure 5. The H3K9 acetylation levels of the Msn2/Msn4-independent osmostress up-regulated genes depend on HDAC Hos1. ChIP experiments were done as described in for the wild-type BY4742 strain and the derivative strains carrying the mutations in the indicated HDACs. Data show the mean and error bars (Standard Deviation) of at least three independent experiments.
It is also remarkable that, in most of the genes, the mutants nut1Δ () and hos1Δ () showed very high levels of H3K9ac during the repression stage that precedes stress. These results suggest a role for HDAC Hos1 in promoting hypoacetylation during repression. In addition, we cannot rule out a function of other HDACs, especially Hda1 and Rpd3, in moderating acetylation during induction (). Our results also suggest a role for Nut1 HAT in promoting H3K9ac during induction, but the highly acetylated state of the nut1Δ mutant before stress is, however, difficult to explain.
As far as we know, none of the six genes whose acetylation during stress was Nut1- and Hos1-dependent was regulated by Msn2 or Msn4. In fact these genes can be regulated by a panoply of different transcription factors. Thus STL1 and GPD1 are regulated mainly by Hot1p [Citation49], GRE2 by Sko1p [Citation38] and ARO9 by Aro80p [Citation51]. GIS1 is regulated by protein kinase Rim15 [Citation52] and the HSP42 gene sequence has HSE target elements of the Hsf1 activator, and lacks the STRE elements targeted by Msn2 and Msn4.
The H3K9 acetylation levels of the msn2/msn4-dependent osmotic stress up-regulated genes are affected in mutants sas2 HAT and rpd3 HDAC
We also analysed the H3K9 acetylation levels in three other genes (CTT1, HSP12 and DDR2) with high gene activation levels under osmotic stress, all of which were regulated by activators Msn2/Msn4 [Citation49]. and (statistical analysis in ) show that the increased acetylation in the three genes was significantly altered in the strains deficient in Sas2 HAT and Rpd3 HDAC, while the same pattern as in the wild-type strain remained in the other mutant strains. This result indicated that Sas2 is involved in H3K9ac formation through a direct (its HAT activity) or indirect mechanism. As seen in , the deletion of HDAC Rpd3 led to a remarkable increase in the H3K9 acetylation of CTT1, HSP12 and DDR2 prior to stress, which suggests that Rpd3 acts in these promoters by promoting hypoacetylation during repression before stress.
Figure 6. The H3K9 acetylation levels of the Msn2/Msn4-dependent osmostress up-regulated genes depend on HAT Sas2. ChIP experiments were done and data are represented as described in for the wild-type BY4742 strain and the derivative strains carrying mutations in the indicated HATs. The H3K9ac/H3 ratios were calculated for a gene region (−500 to +500 bp) around the TSS of each indicated Msn2/Msn4-dependent up-regulated gene. Data show the mean and error bars (Standard Deviation) of three independent experiments.
Figure 7. The H3K9 acetylation levels of the Msn2/Msn4-dependent osmostress up-regulated genes depend on HDAC Rpd3. ChIP experiments were done as described in for the wild-type BY4742 strain and the derivative strains carrying mutations in the indicated HDACs. Data show the mean and error bars (Standard Deviation) of three independent experiments.
It was also noteworthy that, similarly to the six above-described Msn2/Msn4-independent genes, the absence of other HDACs also significantly increased H3 acetylation in relation to the wild strain after stress, especially in mutants hda1∆ and hos1∆ (). Therefore, these HDACs may play a role in the H3 acetylation regulation linked to stress activation, moderating acetylation during induction, but this seems less relevant than that of Rpd3.
The mutations of genes GCN5 and SAS3 do not affect the H3K9 acetylation levels of the osmotic stress up-regulated genes
One important result is that the mutants in Gcn5p or Sas3p had similar acetylation profiles to those of the wild-type strain in all the analysed genes ( and ). This was a surprising finding because proteins Gcn5 and Sas3 are the catalytic subunits of both the evolutionarily conserved SAGA complex and NuA3 complex, respectively, which have a marked preference for histone H3 [Citation17,Citation18,Citation53–Citation56]. Considering that these two HATs are recruited to a similar pool of actively transcribed protein-coding genes [Citation56], perhaps both HATs perform overlapping functions, where one acts in the absence of other, and vice versa. To investigate this possibility, as a gcn5 sas3∆ double mutant is not viable [Citation18], we ran a similar experiment, but in an ada2 sas3∆ mutant to disable the HAT activities of not only NuA3, but also of all the Gcn5-containing complexes [Citation57]. The results obtained with the ada2 sas3∆ double mutant () were similar to those obtained with the single gcn5∆ or sas3∆ mutants, which suggests that neither Gcn5 nor Sas3 strongly affected the H3 acetylation dynamics linked to the gene activation produced by moderate saline stress.
Figure 8. The HAT activity of complexes SAGA and NuA3 does not govern the H3K9 acetylation of the osmotic stress-induced genes. ChIP experiments were done as described in for the wild-type BY4742 strain (wt) and a double mutant in the Ada2 and Sas3 subunits of the SAGA and NuA3 HAT complexes, respectively. The H3K9ac/H3 ratios were calculated for a gene region (−500 to +500 bp) around the TSS of each indicated Msn2/4 dependent or independent up-regulated gene.
The mutations in the main HAT controlling h3k9ac of each osmostress up-regulated gene does not suppress its induction
Global transcriptional induction and H3K9ac level correlate in the osmostress up-regulated genes [Citation12]. However, correlation is not necessarily causation, and the key question as to the function of histone acetylation in transcription induction lies in whether or not it is a prerequisite of the process. We investigated the induction level of the Msn2/Msn4-independent and dependent genes in the yeast strains carrying a mutation of the main HAT responsible for H3K9 acetylation during osmostress, these being mutant nut1∆ and mutant sas2∆, respectively. Induction of mRNA levels was examined at 15 min of osmostress since it has been demonstrated that there is a delay between the process of transcription and its consequent increase in the amount of mRNA [Citation47]. As shown in , the levels of the corresponding mRNAs after stress for several Msn2/Msn4-independent genes were similar between mutants nut1∆ and wild-type strain, conversely to the expected lack of induction observed in a hog1∆ mutant. The most straightforward interpretation of this intriguing result is that alterations to the H3K9ac dynamics induced by Nut1 HAT of the Mediator do not necessarily prevent the up-regulated gene from being transcribed, which suggests that H3K9ac modification is not a prerequisite. This result should be interpreted carefully because transcriptional induction by stress is a dynamic process in which genes are not all activated at the same time or in the same way. We cannot, therefore, rule out that H3K9 acetylation could have consequences on expression at different times to those analysed herein or at greater salt concentrations. Another possibility is that acetylation is not directly linked to transcriptional activation, but performs another type of function that is, for example, related to transcriptional memory [Citation58]. In addition, measurement of mRNA levels may not reflect exactly the transcriptional dynamics, since transcript levels are also dependent on the regulation of their stability [Citation47,Citation59–Citation61].
Figure 9. The mRNA induction of the Msn2/Msn4-independent genes under osmotic stress does not depend on HAT Nut1. The BY4742 wild-type strain (wt) and the mutants in MAPK Hog1 and HAT Nut1 were grown in YPD medium until the exponential phase. Then cells were treated with 0.4 M NaCl for 15 min. The mRNA levels of the indicated Msn2/Msn4-independent genes up-regulated during osmostress were measured as described in Materials and Methods. Data show the fold change in relation to the induction level of the wt strain at 15 min of stress. Represented data are the mean and error bars (SD) of at least three independent experiments.
The mutation in SAS2 in the Msn2/Msn4-dependent genes led to completely different effects depending on the analysed gene. shows that lack of Sas2 did not affect CTT1 expression, but drastically reduced HSP12 expression and increased that of DDR2 several times. Such a result is difficult to interpret. Therefore, the heterogeneity observed in the expression of the genes may be due to Sas2 participating in this process in a quite indirect manner by altering some signalling route with ramified effects.
Figure 10. The mRNA induction of the Msn2/Msn4-dependent genes under osmotic stress does not depend on HAT Sas2. Growth and stress treatment of the BY4742 wild-type strain and the mutants in MAPK Hog1 and HAT Sas2 were done as described in . The measurements of the mRNA levels of the indicated Msn2/Msn4-dependent genes up-regulated during osmostress were taken as described in . Data represent the mean and error bars (Standard Deviation) of three independent experiments.
Discussion
The analysis of transcriptional modulation in response to stress is an interesting model to understand how cells adjust their transcriptional programme in response to extracellular stimuli. Hog1 is a key element in reprograming gene expression upon osmostress, because it acts on hundreds of stress-responsive genes through a plethora of transcription factors (reviewed in [Citation34,Citation62,Citation63]). In fact most of the genes regulated by osmostress are dependent on this kinase. It has also been well described that the transcriptional induction of the genes provoked by osmotic stress correlates with alterations in histone modifications, particularly their acetylation [Citation12,Citation38–Citation43]. Therefore, in gene activation by stress, two different types of mechanisms converge: that of the trans-acting protein factor and that of epigenetic signals. We present evidence herein arguing that both mechanisms are connected in some way, as we show that the increased H3K9 acetylation accompanying gene activation by stress is also largely dependent on Hog1. However, we also studied the possible correlation between the dependency on Hog1 of both processes at the gene level by studying both a few selected up-regulated genes and the full set of stress-activated genes. This study indicates that this correlation does not exist. These results suggest that the transcriptional activation and increased acetylation of histone H3 observed in the genes up-regulated by saline stress are independent processes or, in any case, the one cannot be considered the cause of the other. It is worth noting that this proposal is applicable to specific H3K9 acetylation and is, hence, not contradictory with the direct participation of Hog1 in the recruitment of the histone-modifying enzymes described in other cases [Citation38–Citation43].
The participation of Hog1 in the reduction in H3K9 acetylation during the repression of genes by stress seems less relevant because, for most genes, this process was independent of the presence of Hog1. Taken together, these data indicate that a general model cannot be established by which Hog1 directs a histone modification scheme that allows, or leads to, the transcriptional activation or repression of genes regulated by stress.
We also ran an analysis to identify the HATs and HDACs responsible for the alterations to the H3K9 acetylation state of several stress-induced genes. We found that there were genes in which H3K9ac was altered in the strains deficient in Nut1 and Hos1, as well as other genes in which H3K9ac varied in the strains deficient in Sas2 and Rpd3. It is worth pointing out that the genes in the first group were all independent of activators Msn2/Mns4, while the second group comprised those genes that were all dependent on these activators. The decrease in H3K9 acetylation during stress for both groups of genes in strains nut1∆ and hos1∆ and in sas2∆ and rpd3∆ ( and –) was also noticeable. One expected result would have been to observe no increase in H3K9 acetylation with stress in the HAT mutant, and a higher acetylation level before stress in the HDAC mutant, which would indicate that Nut1 or Sas2 was responsible for the increase produced in the wild-type strains, and that Hos1 or Rpd3 was responsible for the low acetylation level of these genes before stress. However, the observed behaviour is difficult to interpret, viz: how do we explain that the acetylation level observed before stress in most genes in the HATs mutants was higher than in the wild-type strain? One possible explanation is that the actual modification state of a certain position of chromatin was due to a balance between one HAT (or more) and one HDAC (or more), where HAT established an acetylated histone platform that would serve to recruit HDAC activities, which would lead to the deacetylation of the region. A similar mechanism to provide a binding surface to recruit activators has been proposed for acetylation and deacetylation in gene expression [Citation64].
The involvement of Nut1 (also called Med5), a component of Mediator, in changes in the chromatin structure of the Msn2/Mns4-independent genes activated by osmotic stress, is not surprising because the recruitment of Mediator by several activators that are transcriptionally activated in response to environmental stress or under non-optimal growth conditions has been previously described [Citation65]. Notably many, but not all, activators can recruit Mediator. Specifically, Mediator strongly associates with the promoters activated by Gal4, Hsf1, Ace1 and Sko1, but does not detectably associate with the promoters activated by Msn2, Msn4 or Rap1 [Citation65]. In agreement with these data, none of the six genes whose H3K9ac is Nut1- and Hos1-dependent was regulated by Msn2 or Msn4. Therefore, the participation of Mediator in the activation of the genes is not regulated by Msn2/Msn4, and the action of HAT activity of Nut1 during the process seems very likely. However, our finding that induction of the expression of these genes is not being altered in a Nut1 mutant leads us to suggest that H3K9 acetylation is, at least under our experimental conditions, a dispensable consequence of the mechanism rather than a cause of it.
The six genes showing Nut1 dependency in the H3 acetylation pattern (STL1, GPD1, GRE2, HSP42, GIS1 and ARO9) also displayed inverted behaviour in the variation of acetylation in the HDAC mutant hos1∆ compared to the wild-type strain (). This is an interesting finding because Hos1p is a poorly characterized class I HDAC enzyme whose function has only been revealed to date by combined mutations in the genes encoding HDACs Hos1, Rpd3, and Hos2, which caused the concomitant hyperacetylation of both histones H3 and H4 [Citation66].
As mentioned before, in the Msn2/Mns4-dependent genes CTT1, HSP12 and DDR2 the increase in H3K9 acetylation that took place during the activation by osmotic stress was altered in the strains deficient in Sas2 HAT and Rpd3 HDAC. Lack of involvement of HAT Nut1 in the modulation of the H3K9 acetylation schemes of these three genes matches previous data well, which indicate that Mediator subunits are not recruited to CTT1, and are only very poorly recruited to HSP12 promoters [Citation65], which agrees with the fact that the three are regulated by activators Msn2/Msn4 [Citation49]. The implication of Sas2p in the acetylation modulation of H3K9 in these genes is particularly intriguing because this protein forms a complex, termed the SAS complex, with Sas4p and Sas5p [Citation66], which acetylates mainly histone H4 at lysine 16 [Citation67], but is also able to acetylate free histone H3 at lysine 14 [Citation20]. Its most relevant function is the acetylation dynamics in lysine 16 of H4 during gene silencing [Citation68,Citation69]. These previous data suggest the possibility that the Sas2 function in H3K9 acetylation by osmostress occurs via an indirect mechanism. The heterogeneous results obtained in the analysis of the expression of these genes in the absence of Sas2 could support this idea.
The involvement of HDAC Rpd3 in regulating the activity of osmoregulated genes is well documented. Although traditionally linked to repression, HDAC, like Rpd3 can also function during the gene activation of several yeast genes following salt treatment [Citation40,Citation42]. Rpd3-deficient cells are osmosensitive and show a compromised expression of the osmostress-responsive genes controlled by Hog1 [Citation40]. Hog1 binds and recruits the Rpd3 complex to stress-specific promoters, which results in reduced entry of RNA Pol II and deficient gene expression in an rpd3∆ strain [Citation40]. Moreover, these authors also showed that the specific recruitment of the Rpd3 deacetylase to the promoter region lowered the acetylation of histone H4, but only under stress conditions [Citation40], and this histone modification was not analysed here. However, the role of Rpd3 in inducible genes is controversial because Rpd3p has also been proposed to play an important and direct role in repressing these genes when stress is absent, as Rpd3p binds directly to promoters before stress [Citation42], which better agrees with our results. Interestingly, these authors have also reported that Rpd3-dependent genes require this HDAC for the Msn2p binding upstream of the genes [Citation42]. This connection between Rpd3 and Msn2 is consistent with our findings, which indicate that the H3K9ac of Msn2/Msn4-dependent genes CTT1, HSP12 and DDR2 [Citation49] is controlled by Rpd3.
Regarding the non-involvement of Gcn5 and/or Sas3 in H3 acetylation dynamics linked to gene activation, it has been reported that the increased recruitment of Gcn5p at the osmo-inducible promoters in wild-type cells does not correlate with increased H3 acetylation, and that the deletion of GCN5 does not result in increased osmosensitivity [Citation70]. Furthermore, the requirement of SAGA for proper gene induction under osmostress varies depending on the strength of the extracellular osmotic conditions. At mild osmolarity with 0.4 M NaCl, as used here, the mutations in SAGA genes resulted in cells that did not display clear growth defects and only displayed a slight delay in the expression of two osmoresponsive genes (i.e., STL1 and CTT1), but with no general decrease in gene expression. By contast, under severe osmotic conditions, SAGA mutants showed completely impaired RNA Pol II recruitment and transcription of osmoresponsive genes [Citation39]. Interestingly, Mediator carries out its function upon gene induction under any osmostress conditions [Citation39].
We draw two main conclusions from our results. First, osmotic stress yields a major increase in H3K9 acetylation of up-regulated genes via different mechanisms, both Hog1 dependent and independent. Second, we present evidence showing that during osmotic stress induction, at least two distinct mechanisms act on two differentiated sets of genes, one of which would affect the genes not regulated by Msn2/Msn4 but involving Nut1 and Hos1. The other would affect the genes regulated by Msn2/Msn4 and involve Sas2 and Rpd3. Our results do not allow us to distinguish whether the implication of these histone modifying enzymes is direct or indirect. The results presented herein reveal new, unexpected participants in the regulation of gene expression linked to epigenetic marks. We foresee that an understanding of gene regulation associated with chromatin dynamics will strongly benefit from a more detailed study into the histone modifiers that are physically present and which act at different time points during the transcription process.
Materials and methods
Yeast strains and growth conditions
All the strains generated herein were derived from two wild-type Saccharomyces cerevisiae strains: BY4742 or BY4741 (derivatives of S288c). Cells were grown at 30ºC in YPD-rich medium (1% yeast extract, 2% peptone, 2% glucose) and osmotic stress conditions were created by adding 0.4 M NaCl, prepared from a concentrated NaCl solution, for 10 or 15 minutes. Table S1, which contains the description of the strains used in this study, is presented in the Supplementary Material.
Chromatin immunoprecipitation coupled to the microarray detection of immunoprecipitated DNA (chip-chip) and data analysis
We followed a protocol based on a previously described method [Citation71]. The antibodies recognizing histone modifications used for the ChIP-chip experiments were α-H3 (Abcam, 1791), α-H3K9ac (Upstate, 06–942) and α-H3K14ac (Upstate, 07–353). Chromatin immunoprecipitation, DNA purification and annealed linkers ligation, DNA amplification and microarray hybridization were performed exactly as previously described [Citation12]. Data was processed using ChIP Analytics 1.3 (Agilent). Blank subtraction normalization, inter-array median normalization and intra-array median normalization were carried out. Probes were lifted over to the sacCer3 genome version (April 2011). Transcript boundaries [Citation48] were downloaded from SGD (R64-1-1, http://www.yeastgenome.org). For the calculations shown in and , the H3K9 or H3K14 acetylation level of a region from 500 bp upstream to 500 bp downstream of the TSS was considered [Citation48]. Previously, the ChIP signal with the specific H3 modification antibody was normalized to a control ChIP with a core H3 antibody in each experiment.
In , for calculating the percentage of Hog1-dependent acetylation or deacetylation in each gene, the change observed for the H3K9ac/H3 signals in the area between −500 bp and +500 bp with respect to the TSS (or closer to the ORF than −500 or +500 bp in case there was another neighbour gene in these regions) during osmotic stress was compared for both wt and hog1Δ mutant strains (see also ). For calculating the percentage of Hog1-dependent induction or repression, the ratio in the transcription rate after 10 min of osmotic stress treatment with 0.4 M NaCl with respect to non-stress (t = 0) was calculated (data from [Citation47]). Next, the change in H3K9ac or transcription in the hog1Δ strain was compared to that in the wild type (given as 100%) and this was considered as the Hog1-independent change (occurs in the hog1Δ mutant). Finally, the percentage of Hog1 dependent acetylation/deacetylation or induction/repression was calculated as 100% minus the Hog1-independent change.
Chromatin immunoprecipitation (chip)
Yeast cells were grown at 30ºC in YPD medium until the exponential phase and were subjected to osmotic stress with 0.4 M NaCl for 10 min. For the crosslinking reaction, formaldehyde was added to 45 mL of culture cells (1% formaldehyde final concentration) for 15 min at room temperature with occasional inversion. The reaction was stopped by adding 2.5 M glycine. Immunoprecipitations of histone H3 and histone H3K9ac were performed utilizing the α-H3 (Abcam, 1791) and α-H3K9ac (Abcam, 10,812) antibodies, respectively, in combination with Dynabeads Pan Mouse IgG (Life Technologies, Massachusetts, USA). The chromatin immunoprecipitation experiments were performed as previously described [Citation72] with the following modifications: after reversing formaldehyde mediated cross-linking, samples were treated with Proteinase K (Roche), and DNA was purified using the GeneJET PCR Purification Kit (Fermentas #K0702) according to the manufacturer’s instructions. To determine the enrichment of the DNA regions bound by the protein of interest, qPCR was run as described [Citation61] using the primers listed in Table S2, which is presented in the Supplementary Material. Then, the qPCR amplification data was normalized with the total input DNA value in the corresponding sample, and ratio between H3K9 and H3 was calculated for each time point.
Gene expression measure by RT-qPCR
Yeast cells were grown at 30ºC in YPD medium until the exponential phase and were subjected to osmotic stress by adding 0.4M NaCl at the indicated time. Afterwards, 20 mL of culture cells were centrifuged and the pellet was frozen. Total RNA extraction, cDNA synthesis by retrotranscription and quantitative PCR (RT-qPCR) were performed as previously described [Citation61]. The mRNA levels of the indicated genes were quantified using the primers listed in Table S3 presented in the Supplementary Material, and were normalized with the ACT1 mRNA level in the same sample.
Authors’ contributions
MEP-M and MB performed the experiments. PA and VT conceived, designed and performed the experiments and wrote the paper. All the authors read and approved the manuscript.
Availability of data and material
Raw and processed data were deposited at GEO (reference GSE127742).
Supplemental Material
Download PDF (10.5 KB)Supplemental Material
Download PDF (11.3 KB)Supplemental Material
Download PDF (146 KB)Acknowledgments
The authors are indebted to S. Chavez and J.E. Pérez-Ortín for their helpful discussion and critical reading of the manuscript. We are also grateful to V. Pelechano and J. García-Martínez for providing helpful comments. Finally, thanks also to A.B. Fleming for kindly providing the ada2.sas3 double mutant strain.
Supplementary material
Supplemental data for this article can be accessed here.
Disclosure statement
No potential conflict of interest was reported by the authors.
Additional information
Funding
Related Research Data
References
- Bannister AJ, Kouzarides T. Regulation of chromatin by histone modifications. Cell Res. 2011;21(3):381–395.
- Turner BM. Decoding the nucleosome. Cell. 1993;75(1):5–8.
- Tordera V, Sendra R, Perez-Ortin JE. The role of histones and their modifications in the informative content of chromatin. Experientia. 1993;49(9):780–788.
- Jenuwein T, Allis CD. Translating the histone code. Science. 2001;293(5532):1074–1080.
- Strahl BD, Allis CD. The language of covalent histone modifications. Nature. 2000;403(6765):41–45.
- Shogren-Knaak M, Ishii H, Sun JM, et al. Histone H4-K16 acetylation controls chromatin structure and protein interactions. Science. 2006;311(5762):844–847.
- Lai WKM, Pugh BF. Understanding nucleosome dynamics and their links to gene expression and DNA replication. Nat Rev Mol Cell Biol. 2017;18(9):548–562.
- Pavlou MAS, Outeiro TF. Epigenetics in Parkinson’s Disease. Adv Exp Med Biol. 2017;978:363–390.
- Thomas EA. Histone Posttranslational Modifications in Schizophrenia. Adv Exp Med Biol. 2017;978:237–254.
- Nebbioso A, Tambaro FP, Dell’Aversana C, et al. Cancer epigenetics: moving forward. PLoS Genet. 2018;14(6):e1007362.
- Pokholok DK, Harbison CT, Levine S, et al. Genome-wide map of nucleosome acetylation and methylation in yeast. Cell. 2005;122(4):517–527.
- Magraner-Pardo L, Pelechano V, Coloma MD, et al. Dynamic remodeling of histone modifications in response to osmotic stress in Saccharomyces cerevisiae. BMC Genomics. 2014;15:247.
- Weiner A, Hsieh TH, Appleboim A, et al. High-resolution chromatin dynamics during a yeast stress response. Mol Cell. 2015;58(2):371–386.
- Kleff S, Andrulis ED, Anderson CW, et al. Identification of a gene encoding a yeast histone H4 acetyltransferase. J Biol Chem. 1995;270(42):24674–24677.
- Smith ER, Eisen A, Gu W, et al. ESA1 is a histone acetyltransferase that is essential for growth in yeast. Proc Natl Acad Sci U S A. 1998;95(7):3561–3565.
- Clarke AS, Lowell JE, Jacobson SJ, et al. Esa1p is an essential histone acetyltransferase required for cell cycle progression. Mol Cell Biol. 1999;19(4):2515–2526.
- Kuo MH, Brownell JE, Sobel RE, et al. Transcription-linked acetylation by Gcn5p of histones H3 and H4 at specific lysines. Nature. 1996;383(6597):269–272.
- Howe L, Auston D, Grant P, et al. Histone H3 specific acetyltransferases are essential for cell cycle progression. Genes Dev. 2001;15(23):3144–3154.
- Lorch Y, Beve J, Gustafsson CM, et al. Mediator-nucleosome interaction. Mol Cell. 2000;6(1):197–201.
- Sutton A, Shia WJ, Band D, et al. Sas4 and Sas5 are required for the histone acetyltransferase activity of Sas2 in the SAS complex. J Biol Chem. 2003;278(19):16887–16892.
- Angus-Hill ML, Dutnall RN, Tafrov ST, et al. Crystal structure of the histone acetyltransferase Hpa2: A tetrameric member of the Gcn5-related N-acetyltransferase superfamily. J Mol Biol. 1999;294(5):1311–1325.
- Mizzen CA, Yang XJ, Kokubo T, et al. The TAF(II)250 subunit of TFIID has histone acetyltransferase activity. Cell. 1996;87(7):1261–1270.
- Winkler GS, Kristjuhan A, Erdjument-Bromage H, et al. Elongator is a histone H3 and H4 acetyltransferase important for normal histone acetylation levels in vivo. Proc Natl Acad Sci U S A. 2002;99(6):3517–3522.
- Durant M, Pugh BF. Genome-wide relationships between TAF1 and histone acetyltransferases in Saccharomyces cerevisiae. Mol Cell Biol. 2006;26(7):2791–2802.
- Pokholok DK, Hannett NM, Young RA. Exchange of RNA polymerase II initiation and elongation factors during gene expression in vivo. Mol Cell. 2002;9(4):799–809.
- Karlsborn T, Tukenmez H, Mahmud AK, et al. Elongator, a conserved complex required for wobble uridine modifications in eukaryotes. RNA Biol. 2014;11(12):1519–1528.
- Suka N, Suka Y, Carmen AA, et al. Highly specific antibodies determine histone acetylation site usage in yeast heterochromatin and euchromatin. Mol Cell. 2001;8(2):473–479.
- Wu J, Suka N, Carlson M, et al. TUP1 utilizes histone H3/H2B-specific HDA1 deacetylase to repress gene activity in yeast. Mol Cell. 2001;7(1):117–126.
- Wang A, Kurdistani SK, Grunstein M. Requirement of Hos2 histone deacetylase for gene activity in yeast. Science. 2002;298(5597):1412–1414.
- Imai S, Armstrong CM, Kaeberlein M, et al. Transcriptional silencing and longevity protein Sir2 is an NAD-dependent histone deacetylase. Nature. 2000;403(6771):795–800.
- Moazed D. Common themes in mechanisms of gene silencing. Mol Cell. 2001;8(3):489–498.
- Venters BJ, Pugh BF. How eukaryotic genes are transcribed. Crit Rev Biochem Mol Biol. 2009;44(2–3):117–141.
- Kornberg RD. Mediator and the mechanism of transcriptional activation. Trends Biochem Sci. 2005;30(5):235–239.
- de Nadal E, Posas F. Multilayered control of gene expression by stress-activated protein kinases. Embo J. 2010;29(1):4–13.
- Capaldi AP, Kaplan T, Liu Y, et al. Structure and function of a transcriptional network activated by the MAPK Hog1. Nat Genet. 2008;40(11):1300–1306.
- Ni L, Bruce C, Hart C, et al. Dynamic and complex transcription factor binding during an inducible response in yeast. Genes Dev. 2009;23(11):1351–1363.
- Alepuz PM, Jovanovic A, Reiser V, et al. Stress-induced map kinase Hog1 is part of transcription activation complexes. Mol Cell. 2001;7(4):767–777.
- Proft M, Struhl K. Hog1 kinase converts the Sko1-Cyc8-Tup1 repressor complex into an activator that recruits SAGA and SWI/SNF in response to osmotic stress. Mol Cell. 2002;9(6):1307–1317.
- Zapater M, Sohrmann M, Peter M, et al. Selective requirement for SAGA in Hog1-mediated gene expression depending on the severity of the external osmostress conditions. Mol Cell Biol. 2007;27(11):3900–3910.
- De Nadal E, Zapater M, Alepuz PM, et al. The MAPK Hog1 recruits Rpd3 histone deacetylase to activate osmoresponsive genes. Nature. 2004;427(6972):370–374.
- Ruiz-Roig C, Vieitez C, Posas F, et al. The Rpd3L HDAC complex is essential for the heat stress response in yeast. Mol Microbiol. 2010;76(4):1049–1062.
- Alejandro-Osorio AL, Huebert DJ, Porcaro DT, et al. The histone deacetylase Rpd3p is required for transient changes in genomic expression in response to stress. Genome Biol. 2009;10(5):R57.
- Nadal-Ribelles M, Mas G, Millan-Zambrano G, et al. H3K4 monomethylation dictates nucleosome dynamics and chromatin remodeling at stress-responsive genes. Nucleic Acids Res. 2015;43(10):4937–4949.
- Posas F, Chambers JR, Heyman JA, et al. The transcriptional response of yeast to saline stress. J Biol Chem. 2000;275(23):17249–17255.
- de Nadal E, Alepuz PM, Posas F. Dealing with osmostress through MAP kinase activation. EMBO Rep. 2002;3(8):735–740.
- Sheikh-Hamad D, Gustin MC. MAP kinases and the adaptive response to hypertonicity: functional preservation from yeast to mammals. Am J Physiol Renal Physiol. 2004;287(6):F1102–10.
- Romero-Santacreu L, Moreno J, Perez-Ortin JE, et al. Specific and global regulation of mRNA stability during osmotic stress in Saccharomyces cerevisiae. RNA. 2009;15(6):1110–1120.
- Xu Z, Wei W, Gagneur J, et al. Bidirectional promoters generate pervasive transcription in yeast. Nature. 2009;457(7232):1033–1037.
- Rep M, Krantz M, Thevelein JM, et al. The transcriptional response of Saccharomyces cerevisiae to osmotic shock. Hot1p and Msn2p/Msn4p are required for the induction of subsets of high osmolarity glycerol pathway-dependent genes. J Biol Chem. 2000;275(12):8290–8300.
- Gasch AP, Spellman PT, Kao CM, et al. Genomic expression programs in the response of yeast cells to environmental changes. Mol Biol Cell. 2000;11(12):4241–4257.
- Lee K, Sung C, Kim BG, et al. Activation of Aro80 transcription factor by heat-induced aromatic amino acid influx in Saccharomyces cerevisiae. Biochem Biophys Res Commun. 2013;438(1):43–47.
- Pedruzzi I, Burckert N, Egger P, et al. Saccharomyces cerevisiae Ras/cAMP pathway controls post-diauxic shift element-dependent transcription through the zinc finger protein Gis1. Embo J. 2000;19(11):2569–2579.
- Tse C, Georgieva EI, Ruiz-Garcia AB, et al. Gcn5p, a transcription-related histone acetyltransferase, acetylates nucleosomes and folded nucleosomal arrays in the absence of other protein subunits. J Biol Chem. 1998;273(49):32388–32392.
- Grant PA, Eberharter A, John S, et al. Expanded lysine acetylation specificity of Gcn5 in native complexes. J Biol Chem. 1999;274(9):5895–5900.
- John S, Howe L, Tafrov ST, et al. The something about silencing protein, Sas3, is the catalytic subunit of NuA3, a yTAF(II)30-containing HAT complex that interacts with the Spt16 subunit of the yeast CP (Cdc68/Pob3)-FACT complex. Genes Dev. 2000;14(10):1196–1208.
- Rosaleny LE, Ruiz-Garcia AB, Garcia-Martinez J, et al. The Sas3p and Gcn5p histone acetyltransferases are recruited to similar genes. Genome Biol. 2007;8(6):R119.
- Church M, Smith KC, Alhussain MM, et al. Sas3 and Ada2(Gcn5)-dependent histone H3 acetylation is required for transcription elongation at the de-repressed FLO1 gene. Nucleic Acids Res. 2017;45(8):4413–4430.
- Rienzo A, Poveda-Huertes D, Aydin S, et al. Different mechanisms confer gradual control and memory at nutrient- and stress-regulated genes in yeast. Mol Cell Biol. 2015 Nov;35(21):3669–3683.
- Molin C, Jauhiainen A, Warringer J, et al. mRNA stability changes precede changes in steady-state mRNA amounts during hyperosmotic stress. RNA. 2009 Apr;15(4):600–614.
- Canadell D, García-Martínez J, Alepuz P, et al. Impact of high pH stress on yeast gene expression: A comprehensive analysis of mRNA turnover during stress responses. Biochim Biophys Acta. 2015 Jun;1849(6):653–664.
- Garre E, Romero-Santacreu L, Barneo-Munoz M, et al. Nonsense-mediated mRNA decay controls the changes in yeast ribosomal protein pre-mRNAs levels upon osmotic stress. PLoS One. 2013;8(4):e61240.
- Martinez-Montanes F, Pascual-Ahuir A, Proft M. Toward a genomic view of the gene expression program regulated by osmostress in yeast. OMICS. 2010;14(6):619–627.
- Weake VM, Workman JL. Inducible gene expression: diverse regulatory mechanisms. Nat Rev Genet. 2010;11(6):426–437.
- Millar CB, Grunstein M. Genome-wide patterns of histone modifications in yeast. Nat Rev Mol Cell Biol. 2006;7(9):657–666.
- Fan X, Chou DM, Struhl K. Activator-specific recruitment of Mediator in vivo. Nat Struct Mol Biol. 2006;13(2):117–120.
- Watson AD, Edmondson DG, Bone JR, et al. Ssn6-Tup1 interacts with class I histone deacetylases required for repression. Genes Dev. 2000;14(21):2737–2744.
- Shia WJ, Osada S, Florens L, et al. Characterization of the yeast trimeric-SAS acetyltransferase complex. J Biol Chem. 2005;280(12):11987–11994.
- Suka N, Luo K, Grunstein M. Sir2p and Sas2p opposingly regulate acetylation of yeast histone H4 lysine16 and spreading of heterochromatin. Nat Genet. 2002;32(3):378–383.
- Kimura A, Umehara T, Horikoshi M. Chromosomal gradient of histone acetylation established by Sas2p and Sir2p functions as a shield against gene silencing. Nat Genet. 2002;32(3):370–377.
- Guha N, Desai P, Vancura A. Plc1p is required for SAGA recruitment and derepression of Sko1p-regulated genes. Mol Biol Cell. 2007;18(7):2419–2428.
- Ren B, Robert F, Wyrick JJ, et al. Genome-wide location and function of DNA binding proteins. Science. 2000;290(5500):2306–2309.
- Li T, De Clercq N, Medina DA, et al. The mRNA cap-binding protein Cbc1 is required for high and timely expression of genes by promoting the accumulation of gene-specific activators at promoters. Biochim Biophys Acta. 2016;1859(2):405–419.
- Thorvaldsdóttir H, Robinson JT, Jill P. Mesirov Integrative Genomics Viewer (IGV): high-performance genomics data visualization and exploration. Brief Bioinform. 2013;14:178–192.