
 ?Mathematical formulae have been encoded as MathML and are displayed in this HTML version using MathJax in order to improve their display. Uncheck the box to turn MathJax off. This feature requires Javascript. Click on a formula to zoom.
ABSTRACT
DNA methylation and histone modifications are two major epigenetic marks in mammalian cells. Previous studies have revealed that these two mechanisms interact although a quantitative model of these is still lacking in mammalian cells. Here we sought to develop such a model by systematically evaluating the quantitative relationship between DNA methylation and the core histone modification marks in human epigenomes. This model reflects the interactions of ADD and PWWP domains of DNA methyltransferase (DNMTs) with histone 3 lysine tails. Our analysis integrated 35 whole genome bisulphite sequencing data sets (about 800 million CpG sites), 35 chromatin states and 175 ChIP-Seq histone modification profiles across 35 human cell types. The logistic regression model we built shows that more than half of the variance across DNA methylomes can be explained by the five-core histone modification across varied types of human cell and tissue samples. Importantly, we find that H3K4me3 has a dramatic effect in DNA methylation patterning, highlighting the essential interaction between ADD domain of DNMTs and histone 3 lysine 4 in human. Moreover, our model suggests DNA methylation is generally inhibited by the presence of H3K4me3, H3K4me1 and H3K27me3, while increased levels are found in regions that are marked by H3K9me3 and H3K36me3. In summary, our results provide a comprehensive evaluation of the crosstalk between DNA methylation and histone modification in a variety of human cell types, and shows that DNA methylation patterns can be largely explained by interactions between histone 3 lysine tails and specific domains of DNA methyltransferases.
Introduction
DNA methylation and histone modifications are the two major epigenetic mechanisms of gene regulation [Citation1]. In mammalian cells, DNA methylation is carried out by DNA methyltransferases (DNMTs)[Citation2]. Specifically, DNMT1 is a maintenance DNMT, while DNMT3a/3b are de novo DNMTs and DNMT3L is an inactive member of the family that influences the catalytic activity of DNMT3a/b[Citation3]. The ADD domain of de novo DNMTs has been shown to physically bind to histone 3 tails lacking methylation at lysine 4 (H3K4) [Citation4,Citation5]. This interaction causes the release of the autoinhibition between the ADD and DNA methylation domains [Citation6]. This structural interaction is consistent with previous genome-wide profiling observations that genomic regions with H3K4 methylation are largely depleted of 5-C methylation[Citation7]. The PWWP domain of DNMTs, meanwhile, has been identified as a reader of Histone 3 Lysine 36 tri-methylation (H3K36me3) [Citation8,Citation9]. The interaction between H3K36me3 is thought to lead to higher levels of DNA methylation, typically over gene bodies where this mark is observed. By contrast to these two well characterized interactions, the relationship between DNMTs and H3K27 methylation remains poorly understood. Previous studies have observed both a positive and negative correlation between DNA methylation and H3K27me3 [Citation10]. Moreover, it has been shown that H3K9 methyltransferase have direct interactions with DNMTs in heterochromatin, but the details of this interaction are yet to be fully elucidated [Citation11,Citation12].
Based on the studies mentioned above, it has become clear that there are interactions between DNA methyltransferases and histones. However, the quantitative effect of these interactions on DNA methylation patterning is still poorly understood in mammalian systems. Previous work has shown that a simple regression model was able to quantitatively explain DNA methylation patterning in Saccharamoces cerevisiae expressing murine DNMT3B [Citation13]. We therefore sought to establish whether a similar model can explain DNA methylation patterns in mammalian cells. These models allow us to quantify the effect of DNA methyltransferase and histone lysine methylation interactions and determine both the direction and extent of the effect.
This approach is in contrast to previous attempts to impute DNA methylation data from sequence and epigenomic measurements. Some of these efforts focused on predicting DNA methylation from DNA sequence features [Citation14–Citation18]. However, due to the dynamic nature of epigenetic modifications, sequence-based methods cannot capture cell-type specific profiles. Other studies integrated multiple features, including DNA sequence patterns, DNA structure, transcription factor binding sites, and/or different histone modifications marks to predict DNA methylation [Citation19,Citation20]. However, these methods used random forest or regression tree approaches for imputation, and it was therefore not evident how to interpret the resulting models based on the crosstalk between histone modifications and DNA methylation. Beside these studies, other approaches with related goals had the following limitations: a) some modelled DNA methylation as a binary outcome, thus only methylation status is considered while the extent of methylation is not explained [Citation15,Citation16,Citation18,Citation21–Citation23], b) others restricted their modelling of DNA methylation to specific genomic regions, e.g., CpG island or a window of base pairs, instead of inferring methylation at single-nucleotide resolution for the entire genome [Citation18,Citation22,Citation23], c) most studies tested their results in a limited number of samples and did not develop a universal cell type independent model.
Here we propose to focus our investigation on the crosstalk between histone lysine methylation and their interactions with DNA methyltransferases through quantitative modelling. This model reflects the interactions of ADD and PWWP domains of DNMTs with histone 3 tails. Our study examined DNA methylation at a single-nucleotide resolution across a large number of datasets, and considered both the level of DNA methylation and the abundance of histone modification marks, providing a universal model that can be applied across human cell types/tissues. Our model shows that the presence of combinations of H3K4me3, H3K4me1, H3K9me3, H3K27me3, and H3K36me3 explain a large fraction of DNA methylation variability, and that DNA methylation is generally inhibited by the presence of H3K4me3, H3K4me1 and H3K27me3, while increased levels are found in regions that are marked by H3K9me3 and H3K36me3.
Results
Integration of histone ChIP-Seq and WGBS for 35 human cells
To systematically evaluate the quantitative relationship between histone modifications and DNA methylation, we used datasets from the Roadmap Epigenomics Project of 35 human cells lines and tissues for which WGBS profiles are available [Citation24]. This enabled us to perform an extensive analysis in a wide variety of human cells. We chose to use datasets from the Roadmap Epigenomics Project for two reasons. First, the consortium produced a large number of high-quality whole genome bisulphite sequencing (WGBS) datasets as well as their corresponding ChIP-Seq histone marks for a variety of human cell lines and tissues. Second, the datasets were generated and processed in a consistent manner, allowing an integrative analysis to be robust and limiting technical variation between samples. Among the large number of different types of histone modifications, we chose to focus our analysis on five core histone marks: H3K4me3, H3K4me1, H3K27me3, H3K36me3 and H3K9me3. These marks can be used to identify the major chromatin states for genomic annotation [Citation24,Citation25].
Each WGBS sample contains an average of 25 million CpG sites and their methylation values (ranging from 0 to 1) (see Methods), leading to a total of more than 800 million CpG sites/values across samples. In order to compare across different histone modifications, we used normalized fold change values, i.e., fold changes between specific histone ChIP-Seq sample and control sample (see Methods), to represent histone modification levels for each genomic region. As a result, 175 normalized ChIP-Seq datasets were included to represent the core histone modifications for 35 human cell types. Moreover, we also used chromatin state datasets to characterize the genomic annotations for each 200 base pair non-overlapping genomic regions in the 35 cells. The chromatin states were learnt using ChromHMM to represent the combinatorial pattern of histone marks, as shown in previous studies [Citation24].
We integrated datasets of DNA methylation and histone modifications across our samples. shows the schematic illustration of our integrative approach. For each CpG site, we first retrieved its neighbouring 200 base pairs (centred on the CpG site) of histone ChIP-Seq signal according to the genomic coordinates, and then computed an average ChIP-Seq signal within this region for each histone mark. Each CpG site was therefore associated with five normalized histone modification values. We also assigned each CpG site to its nearest chromatin state based on ChromHMM genomic annotation. This strategy allows us to generate an integrated matrix whose rows represent CpG sites and columns represent chromosome, genomic location, methylation levels, five histone modification values, chromatin state annotation and cell of origin. This integrated matrix thus contains more than 800 million CpG sites and their associated epigenetic and genomic characteristics of interest.
Figure 1. Schematic illustration of the integrative approach.
Genomic features of the integrated dataset
To understand characteristics of the variables in this integrated matrix, we first investigated their distributions. As expected, DNA methylation levels had a bimodal distribution that peaks at low and high methylation levels ()), and histone modification values had a bimodal distribution that peaks at no signal (0) and genomic background (~1 fold) () and Supp Figure1). We next calculated genome-wide Pearson correlations between DNA methylation and the core histone marks ()) (see Methods). We find that H3K4me3, H3K4me1 and H3K27me3 had a significant anti-correlation (−0.6, −0.3 and −0.2 respectively) with DNA methylation, H3K36me3 had a positive correlation (0.1), while DNA methylation and H3K9me3 showed no correlation (~0). This result suggests that histone modifications can affect DNA methylation both positively and negatively.
Figure 2. Relationships among DNA methylation and histone modifications in the integrated dataset. (a). Distribution of DNA methylation values in the integrated dataset. (b). Distribution of H3K4me3 normalized log fold change values in the integrated matrix. (c). Genome-wide Pearson correlations between the five histone modifications and DNA methylation values. (d). Boxplot of DNA methylation values in each learnt chromatin states (y axis). The dots within boxplots represent the medium methylation values.
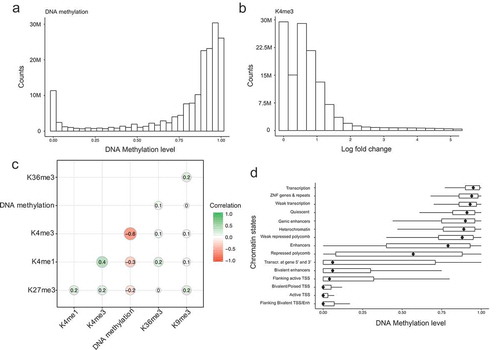
Figure 3. Evaluations of model performance. (a). Model performance based on different combinations of histone modifications as input variables. The x-axis represents the model performance evaluated by RMcFadden. (b). Scatterplot of observed DNA methylation and predicted DNA methylation values. The colour represents density counts of the dots. (c). An example genomic region of the predicated DNA methylation, observed DNA methylation and its corresponding histone modification signal. (d). Model performance in each 35 cell types. The y-axis represents the names of the cell types. The legend represents the corresponding tissue for each cell type.
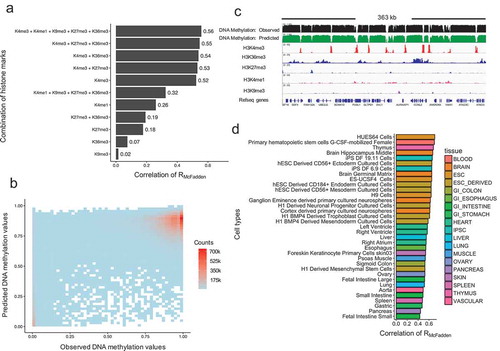
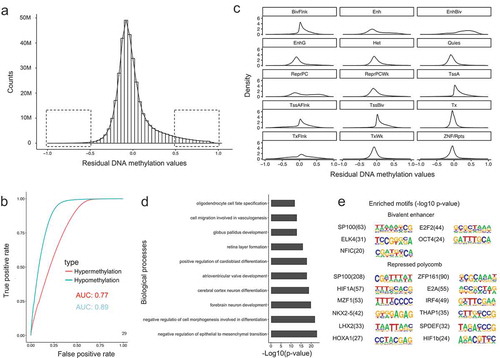
Figure 4. Characteristics of residual DNA methylation values. (a). Distribution of residual DNA methylation values (Predicted minus observed). The two squares represent the regions where residual values have variations larger than 0.5. (b). Receive operation curve (ROC) analysis of the power for the model in predicting hypo- and hypermethylated CpG sites. (c). Density plot of residual DNA methylation values in each chromatin states. (d). Gene ontology enrichment analysis for mis-predicted (high in predictions) CpG sites for repressed polycomb chromatin state regions. (e). DNA motif enrichment analysis for mis-predicted (high in predictions) CpG sites for bivalent enhancers and repressed polycomb chromatin state regions.
We subsequently inspected relationships between DNA methylation and chromatin states. Chromatin states were genomic annotations based on different combinations of histone modifications learnt by the ChromHMM software (Supp Figure 2). ) shows the distribution of DNA methylation in each chromatin state. As expected, chromatin states associated with transcription, ZNF genes and repeats, quiescent and heterochromatin had a high level of DNA methylation, while H3K4me3 associated chromatin states, including bivalent regions (with both H3K4me3 and H3K27me3) and TSS (transcription start site) regions were hypomethylated. Interestingly, we also found that bivalent enhancers (with both H3K4me1 and H3K27me3) tend to be depleted of DNA methylation. Moreover, enhancers and repressed polycomb chromatin states showed highly variable values of DNA methylation, indicating a more complex interaction with DNA methylation than that found in other chromatin states. Taken together, these results suggest specific relationships between DNA methylation, histone modifications and chromatin states across our integrative dataset composed by 35 human cell types. These findings provide a more comprehensive analysis than most previous studies where only one or two methylomes were analysed.
Modelling DNA methylation using multiple logistic regression
To model DNA methylation levels with histone modifications across 35 human cell types, we used a multiple logistic regression model (see Methods). We chose the logistic regression model for two reasons. First, DNA methylation values are bounded between 0 and 1 and can be regarded as the probabilities of CpG sites been methylated. This is thus consistent with the output of a logistic regression model when the target variables are continuous in the range between 0 and 1. Secondly, the learnt parameters and relationships between variables are easy to interpret in a logistic regression model. The following equation then represents the learnt parameters in our integrated model of 800 million CpG sites:
Where x1 to x5 is the log2 fold change values for the H3K4me3, H3K4me1, H3K9me3, H3K27me3 and H3K36me3 respectively, and Pi is the DNA methylation values for each CpG site i.
The logistic regression coefficients represent the change in the log odds of the target variable for a one unit change in the dependent variable. For every one unit increase in the histone modification log2 fold change values, the log odds for a CpG site being methylated (versus non-methylated) decreases by 1.01, 0.29 and 0.29 for H3K4me3, H3K4me1 and H3K27me3, and increases by 0.21 and 0.51 for H3K9me3 and H3K36me3. The standard errors and confidence intervals for the coefficient estimates can be found in Supp Table 1. Given the learnt parameters, it can be seen that H3K4me3, H3K4me1 and H3K27me3 generally inhibit the presence of DNA methylation while H3K9me3 and H3K36me3 generally promote the presence of DNA methylation across the integrated 35 human cells/tissues.
Moreover, from the model, for a one-unit increase in histone modification log2 fold change, we expect to see a 175%, 34% and 34% decrease in odds of methylation (methylated level versus one minus methylated level) for H3K4me3, H3K4me1 and H3K27me, while a 23%, 67% increase in odds of methylation for H3K9me3 and H3K36me3. Intercept of 2.17 indicates that with no histone modifications, the estimated methylation value will be 0.89. This is consistent with the fact that when there is low histone modification signal in the genome, the chromatin will be inactive and thus been highly methylated. As a result, this equation thus provides a universal model for the interactions between core histone marks and DNA methylation patterns.
Evaluation of models with a single or multiple predictor
To evaluate the model performance, we adopted a widely used approach, RMcFadden, to represent the correlation between observed DNA methylation values and predicted DNA methylation values:
Where Lc is a maximum likelihood value from the fitted model, and Lnull is the likelihood value from the model with only an intercept but no covariates. The resulting RMcFadden value captures the fraction of response values that are explained by the input variables. It’s worth noting that the number of response values (millions of CpG sites) is far more than the number of variables (five histone marks). Thus, over-fitting of the model is not possible and separating the dataset into training and test set generates the same result.
We first generated simpler models with single histone marks and evaluated their performance. When a single histone mark was used in our model, we observed the highest RMcFadden values for H3K4me3 (0.52) compared to the other four histone marks (H3K9me3: 0.02, H3K36me3: 0.07, H3K27me3: 0.18, H3K4me1: 0.26) ()). This suggests that H3K4me3 is the strongest predictor of DNA methylation, while H3K4me1, H3K27me3 and H3H36me3 have more limited, but also significant, predictive power in human. Interestingly, this result is different with what we observed in yeast expressing murine DNMT3B, where H3K36me3 is the strongest predictor (RMcFadden value: 0.63), although both systems show a close crosstalk between histone 3 lysine tails and DNA methyltransferase.
We next sought to include only subsets of the histone marks in the model. When we used the four histone marks other than H3K4me3, we obtained a RMcFadden value of 0.32 ()), which was 40 percent lower than using H3K4me3 alone, again highlighting the significant predictive roles of H3K4me3. Finally, when all core histone marks were incorporated in the model, we obtained an overall RMcFadden value of 0.56 ()). This indicates that there is a very strong quantitative relationship between histone modifications and DNA methylation, with more than half of the variation in DNA methylation explained by the core histone marks.
To visualize a genome-wide view of the model, we plot the predicted DNA methylation values against observed DNA methylation values for all the CpG sites ()). The resulting scatterplot shows two enriched groups (in red) where low observed values are also predicted to be low and high observed values are also predicted to be high, indicating our model performs well for these CpG sites. To visualize the model performance in a specific genomic region, we chose a region of 363 kilobases in chromosome 1 in an ESC cell line (HUES64 cells). ) shows the observed (first track in black) and the predicted (second track in green) methylation profile, the core histone modification signals (middle five tracks) and refseq genes (the last track). It is clear from this example that the predicted DNA methylation track agrees well with the observed DNA methylation track. Taken together, these results demonstrate that histone modifications can accurately predict DNA methylation values and that H3K4me3 has the strongest weight in these models.
Performance of the model in individual human cells or tissues
In the previous section, we showed that our model was able to capture a large fraction of the variation of methylome profiles in our integrated 800 million CpG site matrix. The RMcFadden value represented an average across 35 human cells lines and tissues. We next asked whether this RMcFadden value varies across different types of human cells. We thus applied the same modelling approach in each individual cell type and tissue ()). We observed some differences of model performance, ranging from a low RMcFadden value of 0.43 (in foetal intestine small cells) to a high of 0.70 (in HUES64 stem cells). Strikingly, we also found a clear pattern: datasets from undifferentiated cell lines (e.g., stem cells, pluripotent cells) tend to lead to models that have more predictive power compared with datasets from tissues (e.g., Lung, pancreas), although there were several exceptions (e.g., Thymus, Brain Hippocampus middle and Brain germinal matrix). One possible explanation for this observation is that tissues are more heterogeneous than cultured cell lines, which may obfuscate the relationship between histone marks and DNA methylation. Thus, our analysis revealed that there is a general quantitative relationship between these two major epigenetic marks, although the strength of this relationship may be confounded by cellular heterogeneity.
Characteristics of the mis-predicted CpG loci
We have shown that our model was able to accurately model a significant fraction of the methylome, but there are also some mis-predicted CpG sites. We therefore sought to examine the characteristics of these loci. ) shows the distribution of residual values between predicted and observed DNA methylation for the integrated dataset, which generally followed a normal distribution. However, we noted a longer tail towards 1, which occurs when predicted values tend to be hypermethylated compared with actual values. This suggests that there might be additional de-methylation mechanisms that could not be explained by the core histone modifications we examined.
In addition, we found that less than 5 percent of CpG sites have residual methylation values larger than 0.5 ()). This suggests that our model would perform especially well if the task were to classify the CpG sites into binary categories, either hypermethylated (methylation value ≥ 0.7) or hypomethylated (methylation value ≤ 0.3). To quantitatively evaluate this hypothesis, we computed a receiver operation curve (ROC) ()) (see Methods). The area under the curve (AUC) represents the power of the model for classification of CpG methylation. We observed an AUC of 0.89 for hypomethylation and 0.77 for hypermethylation classification, indicating that the core histone modifications accurately classify CpG sites into a binary class.
To further characterize the residual DNA methylation, we investigated the distribution of residual values in each chromatin state ()). In most cases, the residual distribution followed a similar distribution to that shown in ). However, residual values in chromatin states of bivalent enhancer (with H34me1 and H3K27me3) and repressed polycomb (with H3K27me3) had a distinct pattern compared with others. Specifically, predictions in both bivalent enhancers and repressed polycomb states tend to be incorrectly hypermethylated, indicating there might be other de-methylation mechanisms associated with these two H3K27me3 containing chromatin states. Therefore, it appears that H3K27me3 might contribute to de-methylation, even though the mechanism underlying this interaction has not yet been fully elucidated.
Finally, we performed gene ontology (GO) enrichment analysis and motif enrichment analysis for both the CpG sites with either overpredicted or underpredicted methylation in the two H3K27me3 associated chromatin states (see Methods). We found that only the underpredicted CpG sites within repressed polycomb regions were highly enriched for GO terms, and these were related to development and differentiation ()). From the motif analysis, overpredicted CpG sites in both bivalent enhancers and repressed polycomb showed significantly enriched DNA binding motifs ()), suggesting the associated transcription factors might be responsible for the de-methylation observed that was not predicted by our model.
Discussion
During the past decade, a great deal of progress has been achieved in the field of epigenetics due to the development and application of high-throughput sequencing technologies. Large consortiums, such as ENCODE and RoadMap Epigenomics projects, have generated massive epigenomics datasets. Previous studies have revealed that there is a crosstalk between the two main epigenetic mechanisms: histone modification and DNA methylation. However, it is still unclear to what extent DNA methylation patterning can be explained by interactions between DNA methyltransferases and specific histone modifications. Here, we perform a comprehensive and quantitative analysis to address this important question. By integrating datasets from 35 human cells and tissues, we are able to show that there is a universal quantitative relationship between histone modifications and DNA methylation in human cells and tissues. Our model of interactions between five core histone marks and DNA methyltransferases can explain more than half of the variance observed across methylomes. Our work thus demonstrates the degree to which DNA methylation patterning results from interactions between DNA methyltransferases and histone modification marks.
Our model also showed a high accuracy in classifying CpG sites into binary categories, i.e., hypomethylation or hypermethylation. This result can be widely applied in circumstances where such a binary description of methylomes is sufficient. Our work thus provides an approach to use a cost-efficient assay, i.e., ChIP-Seq of histone modifications, to predict WGBS, which is generally more resource intensive, as it requires deep sequencing of the bisulphite converted genome. In addition, we observed that our model had a range of accuracies across diverse cell and tissue types, but that in general the model performed better in cell lines than tissues. We speculate that this might be caused by the high heterogeneity of tissues compared to cell lines.
The model we generated supports the notion that interactions between H3K4 and ADD domains are the main driver of DNA methylation patterning, and that positive interactions between H3K36me3 and the PWWP domain promotes methylation over transcribed regions. By contrast, two H3K27me3-associated genomic regions show distinct patterns of residual methylation distribution, indicating that the core histone marks do not model DNA methylation effectively in the associated chromatin states. This suggests there might be other de-methylation mechanisms that cannot be explained solely by histone modifications. It might be that these regions contain bound polycomb repressor complexes that inhibit DNA methylation, or that other factors specifically bound to these regions inhibit DNA methylation. Future studies will need to be carried out to determine what are the specific mechanisms that are primarily responsible for the hypomethylation found in these H3K27me3 positive regions.
Materials and methods
Methylation calls for whole-genome bisulphite sequencing (WGBS) datasets
The PASH software (version 3.0) was used to perform the WGBS read alignment (genome version: hg19)[Citation26]. The fractional methylation was estimated by calculating the ratio between converted and all (converted plus unconverted) reads at each CpG sites. CpG sites with more than four reads were kept, and the others were treated as missing values. Moreover, to avoid potential artefacts, we further filtered CpG sites falling into curated blacklist regions. These regions were found to show artificially high read mapping coverage. This pipeline was applied uniformly to process all 35 WGBS datasets used in this study.
Calculation of histone modification fold change values
The histone modification ChIP-Seq datasets were also mapped to hg19 using PASH. Only uniquely mapped reads were kept for further analysis. MACS (version 2.0.10) was used to calculate ChIP-Seq signal normalizations between each histone and its corresponding whole cell extract sequenced control[Citation27]. This calculation was based on a dynamic Poisson background model where the background (control) read counts were estimated by the equation of max(BG, 1K, 5K, 10K): BG represents the expected counts per base assuming a uniform distribution of background reads in the genome, and 1K, 5K, 10K represents expected counts estimated from 1 kb, 5 kb and 10 kb region centred at that base. The resulting fold change values were a direct measure of the enrichment for any given genomic coordinate.
Genome-wide correlations between histone modifications and DNA methylation
For each CpG site, we calculated its average histone modification fold change values (within a 200 bp window, centred on the CpG site). The cor function in R was then used to calculate the Pearson correlation coefficient among the five histone modification values and the DNA methylation value. The resulting correlation matrix thus represents a genome-wide correlation between histone modifications and DNA methylation, as shown in ).
Multiple logistic regression model
Logistic regression can be used in two types of dependent variables: 1) a categorical variable that has two (binary classification) or several categories (multi-class classification); or 2) a continuous dependent variable in the range between 0 and 1 representing probabilities values or proportions. To model the quantitative relationship between DNA methylation and core histone marks, the second type of multiple logistic regression was used, and its function is as followings:
Or
where Pi are the DNA methylation values for each CpG i, x1 to x5 are the five histone marks, and are the learnt parameters. This equation is fit using the glm function (family = ‘binonmial’) in R. Glm generates generalized linear models that are extensions of linear regression models. The glm function allows modelling of non-normal dependent variables. The parameter
was calculated using maximum likelihood given the observed data and the estimates of parameters are in logits. As a result, a one-unit change in a predictive variable produces 1*
unit change in log odds or
in odds ratios of the logistic regression model.
ROC curve analysis for classifying CpG sites into a binary model
CpG loci were classified into two groups based on their observed methylation values, i.e., a hypermethylated group (methylation value ≥ 0.7) and a hypomethylated group (methylation value ≤ 0.3). Other DNA methylation loci with medium methylation values were not considered for this analysis. The two groups of CpG sites were ranked based on their predicted methylation values. False positive rates and true positive rates for classifying the CpGs into hyper- or hypo- groups under each cut-off (based on predicted methylation values) were then calculated using the plotROC package in R.
GO and motif analysis of mis-predicted methylation loci
Mis-predicted CpG sites with a residual methylation values larger than 0.5 or smaller than −0.5 were used for both gene ontology enrichment and motif enrichment analysis. For the GO analysis, the CpG sites with their corresponding genomic coordinates were analysed using the GREAT software to assess the enriched GO terms (biological process) associated with these loci [Citation28]. For the motif analysis, the CpG sites and their nearby 200 bp regions (centred on the CpG site) were analysed using the HOMER software to identify the enriched DNA motif sequences [Citation29]. Only factors with a FDR value smaller than 10−20 were reported.
Author contribution
Conception and design by MP and KF, Collection and assembly of data by KF, Data analysis and interpretation by KF, GB and MP, Manuscript writing by KF and MP
Supplemental Material
Download PDF (890.8 KB)Acknowledgments
We would like to thank the Roadmap Epigenomics Consortium for sharing datasets we used in this study. We would also like to thank Kathrin Plath and Jason Ernst for their insightful suggestions.
Disclosure statement
No potential conflict of interest was reported by the authors.
Supplementary material
Supplemental data for this article can be accessed here.
Additional information
Funding
Related Research Data
References
- Iyer LM, Abhiman S, Aravind L. Chapter 2 natural history of eukaryotic DNA methylation systems. Prog Mol Biol Transl. 2011;101:25–104.
- Law JA, Jacobsen SE. Establishing, maintaining and modifying DNA methylation patterns in plants and animals. Nat Rev Genet. 2010;11:204.
- Lyko F. The DNA methyltransferase family: a versatile toolkit for epigenetic regulation. Nat Rev Genet. 2017;19:81.
- Ooi SK, Qiu C, Bernstein E, et al. DNMT3L connects unmethylated lysine 4 of histone H3 to de novo methylation of DNA. Nature. 2007;448:714.
- Zhang Y, Jurkowska R, Soeroes S, et al. Chromatin methylation activity of Dnmt3a and Dnmt3a/3L is guided by interaction of the ADD domain with the histone H3 tail. Nucleic Acids Res. 2010;38:4246–4253.
- Guo X, Wang L, Li J, et al. Structural insight into autoinhibition and histone H3-induced activation of DNMT3A. Nature. 2015;517:640.
- Singh P, Li AX, Tran DA, et al. de Novo DNA methylation in the male germ line occurs by default but is excluded at sites of H3K4 methylation. Cell Rep. 2013;4:205–219.
- Dhayalan A, Rajavelu A, Rathert P, et al. The Dnmt3a PWWP domain reads histone 3 lysine 36 trimethylation and guides DNA methylation. J Biol Chem. 2010;285:26114–26120.
- Vermeulen M, Eberl CH, Matarese F, et al. Quantitative interaction proteomics and genome-wide profiling of epigenetic histone marks and their readers. Cell. 2010;142:967–980.
- Rose NR, Klose RJ. Understanding the relationship between DNA methylation and histone lysine methylation. Biochimica Et Biophysica Acta Bba - Gene Regul Mech. 2014;1839:1362–1372.
- Lehnertz B, Ueda Y, Derijck A, et al. Suv39h-mediated histone H3 lysine 9 methylation directs DNA methylation to major satellite repeats at pericentric heterochromatin. Curr Biol. 2003;13:1192–1200.
- Fuks F, Hurd PJ, Deplus R, et al. The DNA methyltransferases associate with HP1 and the SUV39H1 histone methyltransferase. Nucleic Acids Res. 2003;31:2305–2312.
- Morselli M, Pastor WA, Montanini B, et al. In vivo targeting of de novo DNA methylation by histone modifications in yeast and mouse. Elife. 2015;4:e06205.
- Lu L, Lin K, Qian Z, et al. Predicting DNA methylation status using word composition. J Biomed Sci Eng. 2010;13:672–676.
- Kim S, Li M, Paik H, et al. Predicting DNA methylation susceptibility using CpG flanking sequences. Pac Symposium Biocomput Pac Symposium Biocomput. 2008;315–326.
- Zhou X, Li Z, Dai Z, et al. Prediction of methylation CpGs and their methylation degrees in human DNA sequences. Comput Biol Med. 2012;42:408–413.
- Bhasin M, Zhang H, Reinherz EL, et al. Prediction of methylated CpGs in DNA sequences using a support vector machine. Febs Lett. 2005;579:4302–4308.
- Bock C, Paulsen M, Tierling S, et al. CpG island methylation in human lymphocytes is highly correlated with DNA sequence, repeats, and predicted DNA structure. Plos Genet. 2006;2:e26.
- Zhang W, Spector TD, Deloukas P, et al. Predicting genome-wide DNA methylation using methylation marks, genomic position, and DNA regulatory elements. Genome Biol. 2015;16:14.
- Ernst J, Kellis M. Large-scale imputation of epigenomic datasets for systematic annotation of diverse human tissues. Nat Biotechnol. 2015;33:364.
- Das R, Dimitrova N, Xuan Z, et al. Computational prediction of methylation status in human genomic sequences. Proc Natl Acad Sci. 2006;103:10713–10716.
- Zheng H, Wu H, Li J, et al. CpGIMethPred: computational model for predicting methylation status of CpG islands in human genome. Bmc Med Genomics. 2013;6:S13.
- Fan S, Zhang MQ, Zhang X. Histone methylation marks play important roles in predicting the methylation status of CpG islands. Biochem Biophys Res Commun. 2008;374:559–564.
- Consortium R, Kundaje A, Meuleman W, et al. Integrative analysis of 111 reference human epigenomes. Nature. 2015;518:317.
- Ernst J, Kellis M. ChromHMM: automating chromatin-state discovery and characterization. Nat Methods. 2012;9:215.
- Coarfa C, Yu F, Miller CA, et al. Pash 3.0: a versatile software package for read mapping and integrative analysis of genomic and epigenomic variation using massively parallel DNA sequencing. Bmc Bioinformatics. 2010;11:572.
- Feng J, Liu T, Qin B, et al. Identifying ChIP-seq enrichment using MACS. Nat Protoc. 2012;7:1728.
- McLean CY, Bristor D, Hiller M, et al. GREAT improves functional interpretation of cis-regulatory regions. Nat Biotechnol. 2010;28:495.
- Heinz S, Benner C, Spann N, et al. Simple combinations of lineage-determining transcription factors prime cis-regulatory elements required for macrophage and B cell identities. Mol Cell. 2010;38:576–589.