
ABSTRACT
Anniston, Alabama was home to a major polychlorinated biphenyl (PCB) production facility from 1929 until 1971. The Anniston Community Health Survey I and II (ACHS-I 2005–2007, ACHS-II 2013–2014) were conducted to explore the effects of PCB exposures. In this report we examined associations between PCB exposure and DNA methylation in whole blood using EPIC arrays (ACHS-I, n = 518; ACHS-II, n = 299). For both cohorts, 35 PCBs were measured in serum. We modelled methylation versus PCB wet-weight concentrations for: the sum of 35 PCBs, mono-ortho substituted PCBs, di-ortho substituted PCBs, tri/tetra-ortho substituted PCBs, oestrogenic PCBs, and antiestrogenic PCBs. Using robust multivariable linear regression, we adjusted for age, race, sex, smoking, total lipids, and six blood cell-type percentages. We carried out a two-stage analysis; discovery in ACHS-I followed by replication in ACHS-II. In ACHS-I, we identified 28 associations (17 unique CpGs) at p ≤ 6.70E-08 and 369 associations (286 unique CpGs) at FDR p ≤ 5.00E-02. A large proportion of the genes have been observed to interact with PCBs or dioxins in model studies. Among the 28 genome-wide significant CpG/PCB associations, 14 displayed replicated directional effects in ACHS-II; however, only one in ACHS-II was statistically significant at p ≤ 1.70E-04. While we identified many novel CpGs significantly associated with PCB exposures in ACHS-I, the differential methylation was modest and the effect was attenuated seven years later in ACHS-II, suggesting a lack of persistence of the associations between PCB exposures and altered DNA methylation in blood cells.
Introduction
From 1929 until 1971, Anniston, Alabama was home to the major polychlorinated biphenyl (PCB) manufacturing facility in the United States. Releases of PCBs from the Anniston production facility resulted in substantial environmental contamination. Since PCBs are relatively resistant to biological and chemical decomposition and are highly lipophilic, they easily bioaccumulate in the food chain. In 2005, the Anniston Community Health Survey was established to assess the health effects of general population PCB exposure (ACHS-I) with a follow-up study conducted in 2014 (ACHS-II) [1,2]. Previous ACHS-I studies reported associations between PCB exposure and race [1], hypertension [3], blood pressure [4], leukocyte telomere length [5], liver disease [6], metabolic syndrome [7], serum lipid levels [8], and diabetes [9]. Several previous population studies have found associations between PCB or dioxin exposures and altered blood DNA methylation levels in Dutch men [10], Greenlandic Inuits [11], Koreans [12], Faroe Islanders [13] and Japanese [14].
Some PCBs are ligands for the aryl hydrocarbon receptor (AHR), and it is hypothesized that most, but not all, of the PCB-associated adverse health outcomes are related to persistent activation of AHR [15]. In some tissues, the aryl hydrocarbon receptor repressor (AHRR) is upregulated following AHR activation, and AHRR protein acts as an AHR negative regulator [16]. Numerous recent epigenome-wide association studies (EWAS) of tobacco smoke exposure have demonstrated that in smokers the AHRR CpG cg05575921 is strongly hypomethylated. Also, among smokers, AHRR gene expression is upregulated, particularly in CD14+ monocytes [17–19]. We and others have hypothesized that this altered state could be caused by the presence of polyaromatic hydrocarbons (PAH) in tobacco smoke that activate AHR and lead to AHRR hypomethylation and persistent upregulation of AHRR mRNA. PCB exposures, as AHR ligands, could result in similar effects. So, in addition to examining epigenome-wide associations with PCB exposures, we also assessed whether PCBs were associated with the methylation of the AHRR smoking biomarker.
Here we carry out an EWAS examining the associations between DNA methylation levels using the Illumina EPIC array and the sum of 35 measured PCBs (Σ35PCBs), as well as various exposure groupings: mono-ortho substituted PCBs, di-ortho substituted PCBs, tri/tetra-ortho substituted PCBs, and PCBs with putative oestrogenic or antiestrogenic activity [9,20–22].
Methods
Study population
ACHS-I was conducted between 2005 and 2007, and details of the study design have been reported [1,23]. In ACHS-I, we recruited 765 participants using random-stratified sampling, and residents in the area closest to the PCB manufacturing facility (west Anniston) were over-sampled (two-thirds of eligible participants). The residents were interviewed and had blood samples taken for serum level measurement of 35 PCB congeners, serum lipids, and DNA isolation. We measured DNA methylation in a subset (n = 518) of the ACHS-I cohort members using DNA from stored frozen blood clot samples [5].
ACHS-II was conducted between in 2014 as a follow-up study [2]. For ACHS-II, surviving participants from ACHS-I were contacted and 359 eligible individuals were enrolled. The same 35 PCBs measured in ACHS-I were determined again in ACHS-II. DNA methylation was measured in a subset (n = 299) of the ACHS-II cohort. Both studies were approved by the Institutional Review Boards at the Center of Disease Control and the University of Alabama at Birmingham. See for study demographics.
Table 1. Characteristics of the Anniston Community Health Survey, phases I and II.
Serum PCBs and lipid measurements
The CDC’s National Center for Environmental Health laboratory analysed PCBs in serum [1]. In both ACHS-I and ACHS-II, 35 PCBs congeners were measured: 28, 44, 49, 52, 66, 74, 87, 99, 101, 105, 110, 118, 128, 138–158, 146, 149, 151, 153, 156, 157, 167, 170, 172, 177, 178, 180, 183, 187, 189, 194, 195, 196–203, 199, 206, and 209. Wet-weight substituted measurements were grouped into seven categories: Σ35PCBs (the sum of all 35 PCBs), mono-ortho substituted PCBs (28, 66, 74, 105, 118, 156, 157, 167, and 189); di-ortho substituted PCBs (99, 138–158, 146, 153, 170, 172, 180, and 194); and tri/tetra-ortho substituted PCBs (177, 178, 183, 187, 195, 196–203, 199, 206, and 209), oestrogenic PCBs, E1 (PCBs 66, 74 and 99) [9,20] and E2 (PCBs 99 and 153) [24], and PCBs with antiestrogenic activity, AE (PCBs 66, 74, 105, 118, 156, and 167) [21] (). PCB values below the limit of detection were imputed using the limit of detection divided by square root of 2. All PCBs were used in calculating the Σ35PCBs. For the ortho-substituted and oestrogenic/antiestrogenic groups, we excluded any PCB for which ≥ 60% individuals had measures below the limit of detection (PCBs 44, 49, 52, 87, 101, 110, 128, 149, and 151).
Table 2. PCBs measured in ACHS-I and ACHS-II.
The Clinical Chemistry Laboratory at the Jacksonville Medical Center (Jacksonville, AL) measured serum lipid levels for total cholesterol, HDL cholesterol, LDL cholesterol, and triglycerides [1]. Total lipids were calculated using the method as described by Bernet et al. [25]
DNA methylation measurement
For ACHS-I, DNA was extracted from stored blood clot samples using the PureGene (QIAGEN, 158,389) protocol and Clotspin Baskets (QIAGEN, 158,932). For ACHS-II, whole blood samples (300 µL per extraction) were aliquoted into deep well 96-well plates and genomic DNA was isolated using the Agencourt Genfind v2 Solid Phase Reversible Immobilization (SPRI) paramagnetic bead-based technology (Beckman Coulter, A41497). Prior to bisulphite-conversion, we measured DNA concentrations using a QUBIT dsDNA BR assay kit (Invitrogen, Q32850). The National Cancer Institute’s Cancer Genomics Research Laboratory performed DNA bisulphite conversion using the EZ-96 DNA Methylation MagPrep kit (Zymo Research, D5040) and then ran the bisulphite-converted DNA on Illumina EPIC methylation arrays (Illumina, WG-317-1001).
Statistical analysis
Bioconductor’s ChAMP package v2.12.0 [26–28] was used to normalize and batch correct methylation data. We excluded any samples which failed array QC standards. We excluded from analysis all CpG probes on the X and Y chromosomes, probes containing a SNP with a minor allele frequency ≥ 1% in the CpG site, and probes failing QC standards. We also removed an additional 43,254 probes reported to hybridize to one or more non-target sites in the genome [29]. There were 706,625 CpG probes remaining after exclusions.
outlines our analysis strategy. In brief, associations between PCB exposures and methylation in ACHS-I were analysed using robust multivariable linear regression (M-estimation) with the rlm function in Modern Applied Statistics with S (MASS v.7.3–51.1) [30]. We log10-transformed PCB measurements, consistent with previous ACHS-I analyses. All models were adjusted for age, race, sex, smoking status (yes/no), log10-transformed total lipids, bisulphite-conversion batch, and white blood cell percentages. Other covariates e.g., body mass index and alcohol use, were tested in our models, but did not contribute to model fit. The six white blood cell types (CD4 and CD8 T-cells, B-cells, monocytes, natural killer cells, and granulocytes) were estimated using the Houseman et al. method [31] based on the Reinius reference panel [32]. For CpGs significant at Bonferroni threshold p ≤ 6.70E-08, differential methylation (ΔM) was calculated between the highest and lowest PCB exposure quartiles for CpG sites in ACHS-I. Benjamini-Hochberg false discovery rate (FDR) significant CpGs at p ≤ 5.00E-02 (n = 283) in ACHS-I were then analysed in ACHS-II.
Figure 1. Overview of data analyses strategy. Robust linear regression models were adjusted for age, race, sex, smoking status, total serum lipids, and percentages for six different white blood cell types. Seven different PCBs groupings were used in regression: 1) Σ35PCBs, 2) mono-ortho substituted PCBs, 3) di-ortho substituted PCBs, 4) tri/tetra-ortho substituted PCBs, 5) oestrogenic PCBs group 1, 6) oestrogenic PCBs group 2, 7) antiestrogenic PCBs. Stratified and DMR analyses were not conducted in ACHS-II.
Potential effect measure modification by race and sex for ACHS-I CpGs with an absolute ΔM ≥ 1.00% was evaluated in ACHS-I. We identified effect modification by including an interaction term in our regression models. For CpGs with nominally significant interaction terms (p ≤ 5.00E-02), we generated stratified ΔM results. We conducted interaction analyses using SAS v9.4 PROC ROBUSTREG (SAS Institute Inc.). The ACHS-II had a smaller sample size, which resulted in our having lower statistical power to detect true effect measure modification. As a result, we did not conduct stratification analyses for ACHS-II CpGs.
Differential methylated regions (DMRs) in ACHS-I were identified using Bioconductor’s DMRcate v.1.18.0 [33], comparing the highest versus lowest tertiles for each exposure. For each DMR we calculated FDR p-values. The model was adjusted for age, race, sex, smoking status (yes/no), log10-transformed total lipids, bisulphite-conversion batch, and white blood cell percentages. Again, because of the smaller sample size in ACHS-II, we did not perform DMR analysis in ACHS-II.
CpG/DMR functional annotations and associations in the comparative toxicogenomics database
To find functional annotations of FDR CpGs and DMRs, we used The Genomic Regions Enrichment of Annotations Tool (GREAT) method [34]. We also retrieved curated chemical–gene association data from the 2019 Comparative Toxicogenomics Database (CTD) [35], MDI Biological Laboratory, Salisbury Cove, Maine, and NC State University, Raleigh, North Carolina. World Wide Web (URL: http://ctdbase.org). [May 2019].
Results for demographics comparisons used a two-sided Welch’s t-test. For testing involving PCB distributions by demographics and PCB exposure quartiles, we used Kruskal-Wallis tests and Wilcoxon rank-sum pair-wise tests, respectively. Statistical analyses were conducted in R [36], SAS v9.4 and JMP 13.0.0 (SAS Institute Inc.).
Results
Demographics
Demographics for individuals available for DNA methylation analysis in ACHS-I and ACHS-II are found in . Participants were mostly female (ACHS-I female, 71.2% and ACHS-II female, 74.9%) and were heavier (ACHS-I BMI, 31.1 ± 0.3; ACHS-II BMI, 31.6 ± 0.5) than the U.S. general population as measured in the National Health and Nutrition Examination Survey 2015–2016 [37]. African-American participants were significantly more likely to live closer to the PCB production facility (ACHS-I African-Americans’ residential distance from plant, 2.5 km ± 0.1 and whites’, 4.3 km ± 0.1; t-test p = 2.51E-27).
Serum PCB levels by age and race
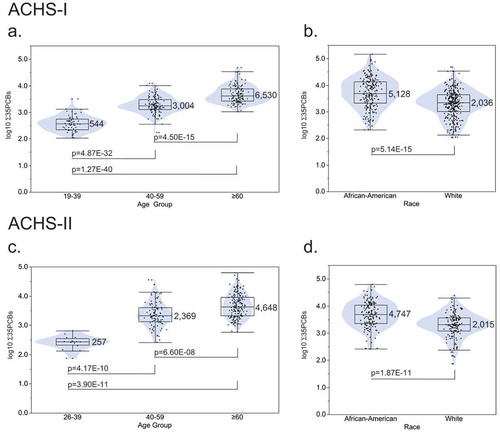
Serum PCB levels in the ACHS-I were previously reported to be 1.5- to 3.0-fold higher than the general population [1]. shows the distribution of the Σ35PCBs by age group and race in both ACHS-I and ACHS-II. In ACHS-I, mean PCB levels were significantly different among the three age groups: 19–39 v. 40–59, p = 4.87E-32; 19–39 v. ≥ 60, p = 1.27E-40; 40–59 v. ≥ 60, p = 4.50E-15 () and between African-Americans and whites, p = 5.14E-15 (). These distributions were also similar in ACHS-II: age groups; 19–39 v. 40–59, p = 4.17E-10; 19–39 v. ≥ 60, p = 3.90E-11; 40–59 v. ≥ 60, p = 6.60E-08 and race, p = 1.87E-11 (, respectively). We also compared the correlation of Σ35PCBs between ACHS-I and ACHS-II for the 245 subjects with exposure data in both cohorts (Figure S1, r2 = 0.86, p = 1.30E-107). The average measured Σ35PCBs in ACHS-II was reduced approximately 10%, but differences by age and race varied considerably as they did in ACHS-I.
Figure 2. Sum of 35 PCB levels by age group and race for ACHS-I (n = 518) and ACHS-II (n = 299) participants. PCB values are graphed on a log10 scale. Box/violin plot labels are non-transformed mean PCB level (ng/g wet-weight). (a) ACHS-I age group distribution. (b) ACHS-I race distribution. (c) ACHS-II age group distribution. (d) ACHS-I race distribution. Wilcoxon rank-sum test p-values are presented.
Cell type analysis in ACHS-I
As described in the Method section, DNA methylation profiles were used to estimate distributions of six blood cell types, and the percentages were used as covariates in the linear regression models. Because PCB exposures have been associated with cell type shifts and other immune system effects [38], we hypothesized that exposure might alter methylation-based estimated cell type composition. We tested if any PCB exposures were associated with shifts in estimated immune cell composition in ACHS-I and observed no significant results.
Smoking and methylation in ACHS-I
We examined if tobacco smoke exposure in the ACHS-I population was associated with altered DNA methylation at the AHRR CpG cg05575921, a site which has been confirmed to be a biomarker of tobacco smoke exposure in numerous studies [17–19,39-42]. The multivariable robust linear regression model that tested smoking versus methylation at AHRR cg05575921 was highly significant (smoking regression coefficient p = 7.27E-269, r2 = 0.58; adjusted for age, sex, race, lipids, cell types and batch). The differential methylation of AHRR cg05575921 between non-smokers and smokers was −18.3% (Wilcoxon rank-sum pair-wise test, p = 1.62E-64). There was no association between the smoking biomarker AHRR cg05575921 and PCB levels in non-smokers (p = 9.44E-01).
PCBs and DNA methylation in ACHS-I and ACHS-II
In ACHS-I, we found 28 significant genome-wide associations, representing 17 unique genes, (Bonferroni threshold p ≤ 6.70E-08) between CpG methylation and PCB exposure, across the seven PCB exposure groups: Σ35PCBs, mono-ortho substituted PCBs, di-ortho substituted PCBs, tri/tetra-ortho substituted PCBs, two groups of PCBs with oestrogenic activity, and PCBs with antiestrogenic activity () and 369 associations (286 unique CpGs) at the FDR p ≤ 5.00E-02 threshold (Table S1). For the 28 Bonferroni significant associations in ACHS-I, absolute ΔM ranged from 0.06% to 5.02%, with 15 (54%) of the associations being hypomethylation and ten associations having an absolute ΔM ≥ 1.00%. Ten of the 28 (36%) associations were most significant in the tri/tetra-ortho-substituted PCB exposure group (PCBs 177, 178, 183, 187, 195, 196–203, 199, 206, and 209). The Venn diagram in illustrates the distribution of FDR significant CpGs (n = 280) in ACHS-I across the four ortho-substituted exposure groups. The majority of CpGs (n = 229, 82%) were significant exclusively in the tri/tetra-ortho substituted PCB exposure group. Figure S2 shows the Venn diagram of the 15 FDR significant CpGs for the oestrogenic/antiestrogenic groups (E1, E2, AE). There was only one CpG, cg04991747, in polypeptide N-acetylgalactosaminyltransferase 2 (GALNT2), that was FDR significant among all seven PCB exposure groups.
Table 3. Top ACHS-I PCB-associated CpGs, selected by Bonferroni (BF) threshold p ≤ 6.70E-08.
Figure 3. Venn diagram of 280 significantly differentially methylated CpGs (BH FDR p ≤ 5.00E-02) in ACHS-I for four PCB groups: sum of 35 PCBs, mono-ortho substituted PCBs, di-ortho substituted PCBs, and tri/tetra-ortho substituted PCBs. Robust linear regression models were adjusted for age, race, sex, smoking status, total serum lipids, bisulphite-conversion batch, and estimated percentages of CD4+ and CD8 + T-cells, CD19 + B-cells, monocytes, granulocytes, and natural killer cells.
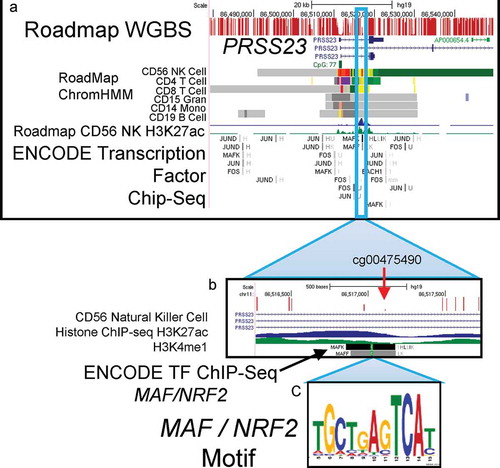
The CpG in ACHS-I with the largest absolute ΔM was in the serine protease 23 gene (PRSS23). The PRSS23 CpG cg00475490 was differentially methylated in the Σ35PCBs (−4.89 ± 0.60%, p = 2.47E-08), di-ortho substituted PCBs (−5.02 ± 0.60%, p = 6.10E-09), and tri/tetra-ortho substituted PCBs (−4.93 ± 0.60%, p = 8.23E-09). shows the region of PRSS23 where cg00475490 is located, which is an actively transcribed enhancer region in natural killer cells, as defined by ENCODE/Roadmap projects [43,44]. PRSS23 cg00475490 is 79-bp downstream of a MAF bZIP transcription factor (MAF)/nuclear factor (erythroid-derived 2)-like 2 (NFE2L2, NRF2) transcription binding site.
Figure 4. PRSS23 genome browser view.
a. Tracks defined from top:Roadmap Epigenome Project Whole Genome Bisulphite Sequencing shows methylation level of each CpG in region.Refseq genes display three mRNA isoforms.CpG island is marked in green.Roadmap Chromatin HMM model for 6 cell types indicates only Natural Killer cells express PRSS23 in blood.ChromHMM code: Red = open chromatin; yellow = active enhancer; Green = active transcription; purple = poised promoter; grey = repressed, closed chromatin.NK Cell H3K27ac ChIP-seqENCODE Transcription Factor ChIP-seqb. Cg004755490 indicated in enhancer region defined by H3K27ac and H3K4me1 histone ChIP-seq in NK cells as determined by Roadmap project. ENCODE transcription factor ChIP-seq for small MAF proteins (binding partners of NRF2).c. Small MAF/NRF2 binding motif located within ChIP-seq peak.
To test the reproducibility of the ACHS-I results, and to see if the observed effects persisted in 2014, we did a replication analysis on the 369 FDR significant (p ≤ 5.00E-02) ACHS-I CpG associations in the ACHS-II. Thirty-three were nominally significant (p ≤ 5.00E-02) in ACHS-II. Of the 28 associations at p ≤ 6.70E-08 in ACHS-I, 14 (50%) were replicated in ACHS-II (based on the directionality of the PCB regression coefficient); however, only one association was statistically significant at Bonferroni p ≤ 1.70E-04 (the Bonferroni threshold for ACHS-II): PRSS23 cg00475490 versus tri/tetra-ortho substituted PCBs, p = 1.33E-04 (). Of the associations with directional replication both the regression coefficient and the significance were reduced. Absolute ΔM in ACHS-II ranged from 0.01% to 3.12%, with four CpG sites with absolute ΔM ≥ 1.00%.
Quartile analysis in ACHS-I
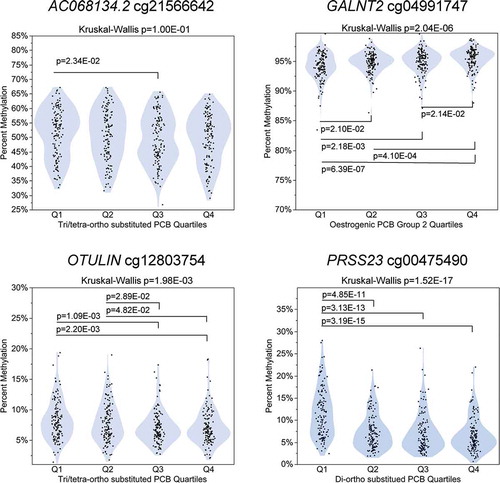
For the four ACHS-I CpGs significant at Bonferroni p ≤ 6.70E-08 and with an absolute ΔM ≥ 1.00%, we explored the methylation trend across quartiles of PCB exposure (). These CpGs were cg21566642 in Homo sapiens BAC clone RP11-762N20 (AC068134.2), cg04991747 in GALNT2, cg12803754 in OTU deubiquitinase with linear linkage specificity (OTULIN), and cg00475490 in PRSS23. For AC068134.2 cg21566642 in the tri/tetra-ortho substituted PCBs, the only significant difference in methylation was between Q1 and Q3, Kruskal-Wallis p = 1.00E-01. For GALNT2 cg04991747, the methylation in the lowest quartile of oestrogenic PCB group 2 was significantly different than the three other quartiles, Kruskal-Wallis p = 2.04E-06. For OTULIN cg00475490, methylation in Q1 of tri/tetra-ortho substituted PCBs differed from Q3 and Q4, but not Q2, Kruskal-Wallis p = 1.98E-03. For PRSS23 cg00475490, Q1 methylation in the di-ortho substituted PCBs was significantly higher than the other three quartiles, Kruskal-Wallis p = 1.52E-17.
Figure 5. PCB quartile distributions for CpGs with ≥ 1.0% absolute differential methylation. Kruskal-Wallis test and Wilcoxon rank-sum test p-values are presented.
Race and sex stratified analysis in ACHS-I
For ACHS-I Bonferroni significant CpGs with an absolute ΔM ≥ 1.00%, we tested for race and sex specific effects by running multivariable robust linear regression models with an interaction term (either sex or race by exposure) for each of the seven PCB exposure groups and the CpG. For the exposure*CpG interaction terms with p ≤ 1.00E-02, we generated stratified ΔM results. We observed potential effect measure modification by sex for AC068134.2 cg21566642 and tri/tetra-ortho substituted PCBs, with a much larger effect in males (ΔM males −6.11 ± 1.97; ΔM females −0.76 ± 1.22, p for interaction = 8.95E-03). GALNT2 cg04991747 and the di-ortho substituted PCBs displayed a modest difference between males and females (ΔM males 0.87 ± 0.50; ΔM females 1.15 ± 0.30, p for interaction = 2.14E-02).
Look up analysis
Leung et al. identified 241 CpG sites that were associated with PCB105 levels in a Faroe Island study [13]. We looked up the significance levels of these CpGs sites within our Σ35PCBs results and observed 23 CpGs in our analysis were nominally significant (p ≤ 5.00E-02) but none of these were significant after FDR correction (Table S2).
DMR analysis in ACHS-I
To determine if there were groups of CpGs (i.e. DMRs) that differed by PCB exposure, we grouped methylation data into PCB exposure tertiles and used the DMRcate analysis method. We identified 185 DMR/PCB exposure associations at FDR p ≤ 5.00E-02 (Table S3). Of the 115 unique FDR DMRs, only one DMR contained an ACHS-I Bonferroni significant individual CpG, GIMAP8 cg14251777. The 56 DMR/PCB associations with absolute ΔM ≥ 1.00% are shown in , representing 37 unique DMRs.
Table 4. ACHS-I DMRs selected by FDR p ≤ 5.00E-02 and absolute differential methylation ≥ 1.00%.
Functional analysis and Comparative Toxicogenomics Database
The GREAT functional analysis tool was used to find possible functional enrichment of molecular signatures of the FDR significant CpGs or DMRs [45]. We observed enrichment of five related immunological molecular signatures (Table S5) in the Molecular Signatures Database [46].
We also searched the 2019 Comparative Toxicogenomics Database (CTD) [47] to determine if CpG ( and S1) and DMR genes ( and S2) had been reported in the literature to interact with either PCB or dioxin exposure in experimental studies. For individual CpGs, 13 of the 17 (76%) unique genome-wide significant genes and 199 (70%) of the 286 FDR significant unique genes were listed as interacting with PCB or dioxin exposures. For ACHS-I 37 unique DMRs in , 19 (51%) of the genes were associated with either PCB or dioxin exposure based on retrieved curated chemical–gene association.
Discussion
The subgroup of participants in ACHS-I and II that were analysed for DNA methylation levels in whole blood DNA had very similar PCB exposure distributions relative to age, race and sex as have been reported [1,48]. Our initial hypothesis for these analyses was that methylation in the AHRR gene, known to be regulated by AHR, might be strongly affected by PCB exposure. Interestingly, while smoking had the expected profound impact on AHRR methylation levels in ACHS-I (cg05575921 p = 7.27E-269), as has been reported many times [17–19,39-42], we detected no association between PCBs (potential AHR ligands) and AHRR methylation in non-smokers (p = 9.40E-01).
Many studies of PCBs and dioxins clearly implicate AHR as mediating the adverse outcomes associated with exposure in model systems and humans [15]. Some PCBs and dioxins interact with AHR in terms of the planar orientation of their two phenyl groups. In dioxin, the two phenyl groups are in a fixed coplanar orientation, which makes it a strong ligand for AHR. The phenyl groups in non-ortho and mono-ortho substituted PCBs can assume a coplanar configuration, allowing these PCBs to have dioxin-like properties including being an AHR ligand. In di-ortho and tri/tetra-ortho substituted PCBs, the chlorines in the ortho positions force the two phenyl groups out of coplanar conformation, leading to non-dioxin-like properties [49]. It should be noted that the most dioxin-like PCBs (non-ortho substituted) were not measured in ACHS-I. Based on our original hypothesis, we expected to observe the most significant changes in methylation among the PCB exposure group that was the most dioxin-like i.e., the mono-ortho substituted PCBs. However, in ACHS-I, exposure to the least dioxin-like PCBs (tri/tetra-ortho substituted) produced the largest number of significant associations (229 CpGs, 82% of all associations). This finding suggests that most of the effects of PCB exposure on whole blood DNA methylation that we observe in this study are not likely to be mediated through the AHR pathway. However, only nine of the 35 PCBs in these analyses were mono-ortho substituted, and these PCBs are weak AHR ligands.
Other studies have reported associations between PCB or dioxin exposures and altered DNA methylation, although most examined global measures of methylation or specific candidate genes. Rusiecki et al. observed that in the Arctic Monitoring and Assessment Program, higher serum levels of 11 PCBs (99, 105, 118, 128, 138, 153, 156, 170, 180, 183, 187) in 71 Greenlandic Inuits were related to global hypomethylation [11]. Two studies found that TCDD [50] and PCB153 [51] exposure were predominantly associated with hypomethylation in sperm DNA. In a study of 368 cancer-free Koreans, researchers found a non-monotonic association between PCB105, PCB138, and PCB153 and MGMT promoter hypomethylation [52]. In a Swedish cross-sectional cohort of 524 elderly men and women, two POPs (PCB126 and OCDD) were connected to global DNA hypermethylation [53]. The research from van den Dungen et al. found in a cohort of Dutch men that serum levels of dioxins and the sum of seven PCBs (28, 52, 101, 118, 138, 180) were significantly associated with primarily hypomethylated DMRs in multiple genes with an average change of 7.4% between the highest and lowest exposed subjects [10].
Some studies have observed possible sex-specific effects. In a subset of a prospective Japanese birth cohort (the Hokkaido Birth Cohort Study on Environment and Children’s Health, n = 169), cord blood methylation levels for H19 and LINE1 were hypermethylated and related to PCB170, PCB 178, PCB180, and PCB183 exposure with the suggestion that this association might be more pronounced in females than males [14]. In the only study utilizing the 450K array, Leung et al. [13] examined a prospective birth cohort of 73 Faroe islanders with high levels of PCB exposure at birth and found sex-specific methylation associations with PCB105 levels. Our look-up analysis of the 195 CpGs reported to be FDR significant in the Leung et al. cord blood study identified 23 CpGs with nominal p-value 5.00E-02, but none reached FDR-corrected significance level. The lack of overlap between a cord blood study with in utero exposures with the present study of older adults is not surprising. Among our most significant CpGs, we tested for sex-specific effects in ACHS-I and observed potential sex-related effect modification for AC068134.2 cg21566642 and GALNT2 cg04991747; however, the size of the ACHS-I cohort (n = 518) limited the statistical power to detect true effect-measure modification.
Among the ACHS-I Bonferroni significant CpGs, the most differentially methylated was PRSS23 cg00475490 (ΔM −5.02 ± 0.60 in di-ortho substituted PCBs), and it showed a strong hypomethylation trend from low to high exposure when examined by quartiles. PRSS23 cg00475490 was the only CpG that displayed persistent and significant alteration in ACHS-II. PRSS23 was first identified as an ovarian protease [54] and has been shown to be upregulated by oestrogen receptor alpha and stimulate growth in the MCF-7 breast cancer cell line [55]. In the Comparative Toxicogenomics Database, it is also associated with dioxin exposures in model systems. Among blood cells, it is expressed only in natural killer cells (). The presence of a functional NRF2/MAF binding site in PRSS23 enhancer may indicate that this gene is regulated by NRF2 (NFE2L2), the master transcription factor regulator of the response to oxidative stress, which also modulates inflammatory and metabolic pathways [56]. GALNT2 has been associated with triglyceride levels [57] and may be associated with Type 2 diabetes [58]. The deubiquitinase, OTULIN, was also highly significant in ACHS-I, is an essential negative regulator of the inflammatory transcript factor nuclear factor κB and plays a role in immune homoeostasis [59]. Using genomic location of the FDR significant CpGs and the GREAT functional annotation program we identified a group of immunological molecular signatures. It is established that PCBs can have effects on the immune system [60–62], and our data suggest that PCB exposures may be perturbing the epigenetic profile of immune system genes.
Our study observed 28 CpG/PCB associations (17 unique genes) at genome-wide significance, 369 associations in 286 CpGs at FDR significance, and 115 genes with significant DMRs. Of these genes a large proportion [14/17 (76%) Bonferroni significant genes; 199/286 (70%) FDR significant genes; and 78/115 (68%) FDR significant DMR genes] had a reported interaction with PCB or dioxin in various model system studies reported in the Comparative Toxicogenomics Database. However, surprisingly none of the canonical AHR pathway genes were affected, e.g. genes in the CYP, GST and UGT families.
Two factors that were limitations of our study were the relatively limited genome-wide coverage of the EPIC array (~3% of all genomic CpGs) and the relatively small sample sizes (ACHS-I n = 518 and ACHS-II n = 299) in terms of multiple comparisons correction. The main strength of our study was the opportunity to examine effects in ACHS-I and then later in ACHS-II. We observed half of the ACHS-I genome-wide associations displayed similar directional effect in ACHS-II and only one CpG (PRSS23 cg00475490) among ACHS-I top hits, displayed a persistent, significant association in ACHS-II. The factors that may have contributed to the limited replication in ACHS-II include the smaller sample size (n = 299), the reduced exposure levels (~10% lower), and potential sampling bias (survival bias). In both ACHS-I and ACHS-II individuals recruited long after the occurrence of very high exposures could be more resilient to adverse health effects. From a public health perspective, our observation of reduced PCB effects on methylation after seven years can be considered a reassuring outcome as opposed to a lack of replication. In future research, we will explore methylation associations with dioxins, furans and non-ortho PCBs that were only measured in ACHS-II. We will also examine the associations among methylation, POPs, and adverse health outcomes, e.g. hypertension, liver disease, diabetes, and metabolic syndrome in both cohorts.
We have conducted the first EWAS exploring the associations between PCB exposure and DNA methylation levels in adults and identified numerous highly significant CpGs and DMRs associated with exposure. Our study design has allowed us to examine effects of PCB exposure on DNA methylation at two points in time, seven years apart. It is unclear how biological important these altered methylation levels are, or if CpGs such as PRSS23 cg00475490 are useful biomarkers of exposure. However, it is encouraging that PCB effects on methylation generally appear to be attenuated in ACHS-II after seven years.
Supplemental Material
Download MS Power Point (289.5 KB)Supplemental Material
Download MS Excel (102.7 KB)Acknowledgments
We recognize Dr. Stephen T. Mennemeyer of University of Alabama Birmingham for his study contributions. We express gratitude to the study participants in the ACHS-I and ACHS-II cohorts. We thank the Cancer Genomics Research Laboratory at the National Cancer Institute (Rockville, MD) for methylation array analysis. We thank Andeas Sjödin and Richard Jones of the Center for Disease Control and Prevention’s Division of Laboratory Sciences within the National Center for Environmental Health for the analyses of polychlorinated biphenyls and dioxins. We acknowledge Kevin E. Gerrish and Joetta Hitchcock-Smith, NIEHS Molecular Genomics Core Laboratory for ACHS-II DNA extractions (RTP, NC). We appreciated the help of Dr. Phillip Grandjean and colleagues, Department of Environmental Health, Harvard T.H. Chan School of Public Health in providing the list of CpGs from the Leung et al. study. We also thank Suzanne N. Martos (NIEHS, RTP, NC) for suggestions and feedback regarding data analysis and presentation, and Leonardo E. Albertini Sanchez (NIEHS, RTP, NC) for assistance with copy editing.
Disclosure statement
J.R. Olson served as an expert witness for the plaintiffs in legal actions regarding the residents of Anniston, Alabama being exposed to PCBs. The other authors declare that they have no competing interests.
Supplementary material
Supplemental data for this article can be accessed here.
Additional information
Funding
Related Research Data
References
- Pavuk M, Olson JR, Sjodin A, et al. Serum concentrations of polychlorinated biphenyls (PCBs) in participants of the Anniston Community Health Survey. Sci Total Environ. 2014 Mar;1(473-474):286–297. PubMed PMID: 24374590; PubMed Central PMCID: PMCPMC4617226.
- Birnbaum LS, Dutton ND, Cusack C, et al. Anniston community health survey: follow-up and dioxin analyses (ACHS-II)–methods. Environ Sci Pollut Res Int. 2016 Feb;23(3):2014–2021. PubMed PMID: 25982988; PubMed Central PMCID: PMCPMC4648703.
- Goncharov A, Bloom M, Pavuk M, et al. Blood pressure and hypertension in relation to levels of serum polychlorinated biphenyls in residents of Anniston, Alabama. J Hypertens. 2010 Oct;28(10):2053–2060. PubMed PMID: 20644494.
- Goncharov A, Pavuk M, Foushee HR, et al. Blood pressure in relation to concentrations of PCB congeners and chlorinated pesticides. Environ Health Perspect. 2011 Mar;119(3):319–325. PubMed PMID: 21362590; PubMed Central PMCID: PMCPMC3059993.
- Callahan CL, Pavuk M, Birnbaum LS, et al. Serum polychlorinated biphenyls and leukocyte telomere length in a highly-exposed population: the Anniston Community Health Survey. Environ Int. 2017 Nov;108:212–220. PubMed PMID: 28886414; PubMed Central PMCID: PMCPMC5623110.
- Clair HB, Pinkston CM, Rai SN, et al. Liver Disease in a Residential Cohort With Elevated Polychlorinated Biphenyl Exposures. Toxicol Sci. 2018 Jul 1;164(1):39–49. PubMed PMID: 29684222; PubMed Central PMCID: PMCPMC6016643.
- Rosenbaum PF, Weinstock RS, Silverstone AE, et al. Metabolic syndrome is associated with exposure to organochlorine pesticides in Anniston, AL, United States. Environ Int. 2017 Nov;108:11–21. PubMed PMID: 28779625; PubMed Central PMCID: PMCPMC5627356.
- Aminov Z, Haase R, Olson JR, et al. Racial differences in levels of serum lipids and effects of exposure to persistent organic pollutants on lipid levels in residents of Anniston, Alabama. Environ Int. 2014 Dec;73:216–223. PubMed PMID: 25160080.
- Silverstone AE, Rosenbaum PF, Weinstock RS, et al. Polychlorinated biphenyl (PCB) exposure and diabetes: results from the Anniston Community Health Survey. Environ Health Perspect. 2012 May;120(5):727–732. PubMed PMID: 22334129; PubMed Central PMCID: PMCPMC3346783.
- van Den Dungen MW, Murk AJ, Kampman E, et al. Association between DNA methylation profiles in leukocytes and serum levels of persistent organic pollutants in Dutch men. Environ Epigenet. 2017 Jan;3(1):dvx001. PubMed PMID: 29492303; PubMed Central PMCID: PMCPMC5804541.
- Rusiecki JA, Baccarelli A, Bollati V, et al. Global DNA Hypomethylation Is Associated with High Serum-Persistent Organic Pollutants in Greenlandic Inuit. Environ Health Perspect. 2008 Nov;116(11):1547–1552. PubMed PMID: WOS:000260521500030; English.
- Kim KY, Kim DS, Lee SK, et al. Association of Low-Dose Exposure to Persistent Organic Pollutants with Global DNA Hypomethylation in Healthy Koreans Healthy Koreans. Environ Health Perspect. 2010 Mar;118(3):370–374. PubMed PMID: WOS:000275449500028; English.
- Leung YK, Ouyang B, Niu L, et al. Identification of sex-specific DNA methylation changes driven by specific chemicals in cord blood in a Faroese birth cohort. Epigenetics. 2018;13(3):290–300. PubMed PMID: 29560787; PubMed Central PMCID: PMCPMC5997167.
- Kobayashi S, Sata F, Miyashita C, et al. Gender-specific association of exposure to non-dioxin-like polychlorinated biphenyls during pregnancy with methylation levels of H19 and long interspersed nuclear element-1 in cord blood in the Hokkaido study. Toxicology. 2017 Sep;1(390):135–145. PubMed PMID: 28865728.
- Brouwer A, Longnecker MP, Birnbaum LS, et al. Characterization of potential endocrine-related health effects at low-dose levels of exposure to PCBs. Environ Health Perspect. 1999 Aug;107:639–649. PubMed PMID: WOS:000082094400008; English.
- Hahn ME, Allan LL, Sherr DH. Regulation of constitutive and inducible AHR signaling: complex interactions involving the AHR repressor. Biochem Pharmacol. 2009 Feb 15;77(4):485–497. PubMed PMID: WOS:000263529100003; English.
- Reynolds LM, Wan M, Ding JZ, et al. DNA methylation of the aryl hydrocarbon receptor repressor associations with cigarette smoking and subclinical atherosclerosis. Circ-Cardiovasc Gene. 2015 Oct;8(5):707–716. PubMed PMID: WOS:000363373800009; English. DOI:10.1161/Circgenetics.115.001097.
- Su D, Wang XT, Campbell MR, et al. Distinct epigenetic effects of tobacco smoking in whole blood and among leukocyte subtypes. Plos One. 2016 Dec 9;11(12). PubMed PMID: WOS:000389587100029; English. DOI:10.1371/journal.pone.0166486.
- Kim Y, Ng CFS, Chung Y, et al. Regulation of constitutive and inducible AHR signaling: complex interactions involving the AHR repressor. Biochem Pharma. 2009 Apr;77(4). PubMed PMID: WOS:000431396900008; English. DOI:10.1016/j.bcp.2008.09.016.
- DeCastro BR, Korrick SA, Spengler JD, et al. Estrogenic activity of polychlorinated biphenyls present in human tissue and the environment. Environ Sci Technol. 2006 Apr 15;40(8):2819–2825. PubMed PMID: 16683629.
- Warner J, Osuch JR, Karmaus W, et al. Common classification schemes for PCB congeners and the gene expression of CYP17, CYP19, ESR1 and ESR2. Sci Total Environ. 2012 Jan 1;414:81–89. PubMed PMID: 22119029.
- Cooke PSSTBD. Disruption of steroid hormone signaling by PCBs. In: RL HL, editor. Advances in Environmental Toxicology and Health Effects. Lexington: University Press of Kentucky; 2001. p. 257–263.
- Sjodin A, Jones RS, Lapeza CR, et al. Semiautomated high-throughput extraction and cleanup method for the measurement of polybrominated diphenyl ethers, polybrominated biphenyls, and polychlorinated biphenyls in human serum. Anal Chem. 2004 Apr 1;76(7):1921–1927. PubMed PMID: 15053652.
- Cooke PSST, Buchanan DL. Disruption of steroid hormone signaling by PCBs. In: Roberston LWHL, editor. CBs Recent Advances in Environmental Toxicology and Health Effects. Lexington: University Press of Kentucky; 2001. p. 257–263.
- Bernert JT, Turner WE, Patterson DG, et al. Calculation of serum “total lipid” concentrations for the adjustment of persistent organohalogen toxicant measurements in human samples. Chemosphere. 2007 Jun;68(5):824–831. PubMed PMID: WOS:000247259600004; English.
- Aryee MJ, Jaffe AE, Corrada-Bravo H, et al. Minfi: a flexible and comprehensive Bioconductor package for the analysis of Infinium DNA methylation microarrays. Bioinformatics. 2014 May 15;30(10):1363–1369. PubMed PMID: 24478339; PubMed Central PMCID: PMCPMC4016708.
- Fortin JP, Triche TJ Jr., Hansen KD. Preprocessing, normalization and integration of the Illumina HumanMethylationEPIC array with minfi. Bioinformatics. 2017 Feb 15;33(4):558–560. PubMed PMID: 28035024; PubMed Central PMCID: PMCPMC5408810.
- Morris TJ, Butcher LM, Feber A, et al. ChAMP: 450k Chip Analysis Methylation Pipeline. Bioinformatics. 2014 Feb 1;30(3):428–430. PubMed PMID: 24336642; PubMed Central PMCID: PMCPMC3904520.
- Pidsley R, Zotenko E, Peters TJ, et al. Critical evaluation of the Illumina MethylationEPIC BeadChip microarray for whole-genome DNA methylation profiling. Genome Biol. 2016 Oct 7;17(1):208. PubMed PMID: 27717381; PubMed Central PMCID: PMCPMC5055731.
- Ripley W. Modern Applied Statistics with S. Fourth ed. Springer. New York; 2002.
- Houseman EA, Kile ML, Christiani DC, et al. Reference-free deconvolution of DNA methylation data and mediation by cell composition effects. BMC Bioinformatics. 2016 Jun;29(17):259. PubMed PMID: 27358049; PubMed Central PMCID: PMCPMC4928286.
- Reinius LE, Acevedo N, Joerink M, et al. Differential DNA methylation in purified human blood cells: implications for cell lineage and studies on disease susceptibility. Plos One. 2012;7(7):e41361. PubMed PMID: 22848472; PubMed Central PMCID: PMCPMC3405143. eng.
- Peters TJ, Buckley MJ, Statham AL, et al. De novo identification of differentially methylated regions in the human genome. Epigenetics Chromatin. 2015;8:6. PubMed PMID: 25972926; PubMed Central PMCID: PMCPMC4429355.
- McLean CY, Bristor D, Hiller M, et al. GREAT improves functional interpretation of cis-regulatory regions. Nat Biotechnol. 2010 May;28(5):495–501. PubMed PMID: 20436461; PubMed Central PMCID: PMCPMC4840234.
- Davis AP, Grondin CJ, Johnson RJ, et al. The Comparative Toxicogenomics Database: update 2019. Nucleic Acids Res. 2019 Jan 8;47(D1):D948–d954. PubMed PMID: 30247620; PubMed Central PMCID: PMCPMC6323936. eng.
- R Development Core Team. R: A Language and Environment for Statistical Computing. R Foundation for Statistical Computing, Vienna, Austria. 2018.
- Yang L, Cao C, Kantor ED, et al. Trends in sedentary behavior among the US population, 2001-2016. JAMA. 2019;321(16):1587–1597.
- Glynn A, Thuvander A, Aune M, et al. Immune cell counts and risks of respiratory infections among infants exposed pre- and postnatally to organochlorine compounds: a prospective study. Environmental Health. 2008 Dec 4;7. PubMed PMID: WOS:000263447400001; English. DOI:10.1186/1476-069x-7-62.
- Joehanes R, Just AC, Marioni RE, et al. Epigenetic signatures of cigarette smoking. Circ-Cardiovasc Gene. 2016 Oct;9(5):436–447. PubMed PMID: WOS:000386593700007; English.
- Joubert BR, Haberg SE, Nilsen RM, et al. 450K epigenome-wide scan identifies differential DNA methylation in newborns related to maternal smoking during pregnancy. Environ Health Perspect. 2012 Oct;120(10):1425–1431. PubMed PMID: WOS:000309692600025; English.
- Monick MM, Beach SRH, Plume J, et al. Coordinated changes in AHRR methylation in lymphoblasts and pulmonary macrophages from smokers. Am J Med Genet B. 2012 Mar;159b(2):141–151. PubMed PMID: WOS:000299032000002; English.
- Zeilinger S, Kuhnel B, Klopp N, et al. Tobacco smoking leads to extensive genome-wide changes in DNA methylation. Plos One. 2013 May 17;8(5). PubMed PMID: WOS:000319107900061; English. DOI:10.1371/journal.pone.0063812.
- Dunham I, Kundaje A, Aldred SF, et al. An integrated encyclopedia of DNA elements in the human genome. Nature. 2012 Sep 6;489(7414):57–74. PubMed PMID: WOS:000308347000039; English.
- Roadmap Epigenomics C, Kundaje A, Meuleman W, et al. Integrative analysis of 111 reference human epigenomes. Nature. 2015 Feb 19;518(7539):317–330. PubMed PMID: 25693563; PubMed Central PMCID: PMCPMC4530010.
- McLean CY, Bristor D, Hiller M, et al. GREAT improves functional interpretation of cis-regulatory regions. Nat Biotechnol. 2010 May;28(5):495–U155. PubMed PMID: WOS:000277452700030; English.
- Subramanian A, Tamayo P, Mootha VK, et al. Gene set enrichment analysis: a knowledge-based approach for interpreting genome-wide expression profiles. Proc Natl Acad Sci U S A. 2005 Oct 25;102(43):15545–15550. PubMed PMID: 16199517; PubMed Central PMCID: PMCPMC1239896.
- Davis AP, Grondin CJ, Johnson RJ, et al. The Comparative Toxicogenomics Database: update 2019. Nucleic Acids Res. 2019 Jan 8;47(D1):D948–D954. PubMed PMID: WOS:000462587400131; English.
- Yang E, Pavuk M, Sjodin A, et al. Exposure of dioxin-like chemicals in participants of the Anniston community health survey follow-up. Sci Total Environ. 2018 May;12(637-638):881–891. PubMed PMID: 29763869.
- Erickson, MD. PCBs : recent Advances in Environmental Toxicology and Health Effects. Lexington, Ky: The University Press of Kentucky; 2001. (Robertson LW, and Hansen, L. G, editor.).
- Pilsner JR, Shershebnev A, Medvedeva YA, et al. Peripubertal serum dioxin concentrations and subsequent sperm methylome profiles of young Russian adults. Reprod Toxicol. 2018 Jun;78:40–49. PubMed PMID: 29550351; PubMed Central PMCID: PMCPMC6130911.
- Consales C, Toft G, Leter G, et al. Exposure to persistent organic pollutants and sperm DNA methylation changes in Arctic and European populations. Environ Mol Mutagen. 2016 Apr;57(3):200–209. PubMed PMID: 26801515.
- Park SY, Kim KS, Lee YM, et al. Persistent organic pollutants and promoter hypermethylation of the O(6)-methylguanine-DNA methyltransferase gene. Biomarkers. 2015 Mar;20(2):136–142. PubMed PMID: 25585924.
- Lind L, Penell J, Luttropp K, et al. Global DNA hypermethylation is associated with high serum levels of persistent organic pollutants in an elderly population. Environ Int. 2013 Sep;59:456–461. PubMed PMID: WOS:000324901000049; English.
- Miyakoshi K, Murphy MJ, Yeoman RR, et al. The identification of novel ovarian proteases through the use of genomic and bioinformatic methodologies. Biol Reprod. 2006 Dec;75(6):823–835. PubMed PMID: WOS:000242308800002; English.
- Chan HS, Chang SJ, Wang TY, et al. Serine Protease PRSS23 Is Upregulated by Estrogen Receptor alpha and Associated with Proliferation of Breast Cancer Cells. Plos One. 2012 Jan 23;7(1). PubMed PMID: WOS:000301570600040; English. DOI:10.1371/journal.pone.0030397.
- Hayes JD, Dinkova-Kostova AT. The Nrf2 regulatory network provides an interface between redox and intermediary metabolism. Trends Biochem Sci. 2014 Apr;39(4):199–218. PubMed PMID: WOS:000335426200008; English.
- Cavalli M, Pan G, Nord H, et al. Looking beyond GWAS: allele-specific transcription factor binding drives the association of GALNT2 to HDL-C plasma levels. Lipids Health Dis. 2016 Jan;27(15):18. PubMed PMID: 26817450; PubMed Central PMCID: PMCPMC4728761.
- Marucci A, Di Mauro L, Menzaghi C, et al. GALNT2 Expression Is Reduced in Patients With Type 2 Diabetes, Possible Role of Hyperglycemia. Diabetes. 2013 Jul;62:A472–A473. PubMed PMID: WOS:000209473602420; English.
- Damgaard RB, Walker JA, Marco-Casanova P, et al. The Deubiquitinase OTULIN Is an Essential Negative Regulator of Inflammation and Autoimmunity. Cell. 2016 Aug 25;166(5):1215-+. PubMed PMID: WOS:000382259500018; English.
- Haase H, Fahlenkamp A, Schettgen T, et al. Immunotoxicity Monitoring in a Population Exposed to Polychlorinated Biphenyls. Int J Environ Res Public Health. 2016 Mar 8;13(3). PubMed PMID: 27005643; PubMed Central PMCID: PMCPMC4808958. DOI:10.3390/ijerph13030295.
- Berntsen HF, Fonnum F, Walaas SI et al., Low-Chlorinated Non-Dioxin-like Polychlorinated Biphenyls Present in Blood and Breast Milk Induce Higher Levels of Reactive Oxygen Species in Neutrophil Granulocytes than High-Chlorinated Congeners. Basic & Clinical Pharmacology & Toxicology. 2016 Dec;119(6):588–597. PubMed PMID: WOS:000387804800009; English.
- Shimada AL, Cruz WS, Loiola RA, et al. Absorption of PCB126 by upper airways impairs G protein-coupled receptor-mediated immune response. Sci Rep. 2015 Oct;9(5):14917. PubMed PMID: 26449762; PubMed Central PMCID: PMCPMC4598834.