
ABSTRACT
Despite recent evidence that 5-hydroxymethylcytosine (5hmC) possesses roles in gene regulation distinct from 5-methylcytosine (5mC), relatively little is known regarding the functions of 5hmC in mammalian tissues. To address this issue, we utilized an approach combining both paired bisulfite (BS) and oxidative bisulfite (oxBS) DNA treatment, to resolve genome-wide patterns of 5hmC and 5mC in normal breast tissue from disease-free women. Although less abundant than 5mC, 5hmC was differentially distributed, and consistently enriched among breast-specific enhancers and transcriptionally active chromatin. In contrast, regulatory regions associated with transcriptional inactivity, such as heterochromatin and repressed Polycomb regions, were relatively depleted of 5hmC. Gene regions containing abundant 5hmC were significantly associated with lactate oxidation, immune cell function, and prolactin signaling pathways. Furthermore, genes containing abundant 5hmC were enriched among those actively transcribed in normal breast tissue. Finally, in independent data sets, normal breast tissue 5hmC was significantly enriched among CpG loci demonstrated to have altered methylation in pre-invasive breast cancer and invasive breast tumors. Primarily, our findings identify genomic loci containing abundant 5hmC in breast tissues and provide a genome-wide map of nucleotide-level 5hmC in normal breast tissue. Additionally, these data suggest 5hmC may participate in gene regulatory programs that are dysregulated during breast-related carcinogenesis.
Background
5-hydroxymethylcytosine (5hmC) is generated by ten- eleven translocase (TET)-dioxygenase-mediated oxidation of 5-methylcytosine (5mC)Citation[1,Citation2]. Production of 5hmC is required for DNA demethylation, however, recent studies indicate 5hmC is abundant and stable under specific biological contexts [Citation3–Citation5]. Such observations suggest a direct involvement for 5hmC in gene regulation and function, independent of its role in DNA demethylation [Citation3,Citation6–Citation8]. However, standard technologies used-to-date cannot effectively disambiguate 5mC and 5hmC, therefore the utility of existing genome-wide methylation resources is limited. Application of approaches that quantify 5hmC abundance at a genome-wide level are required to improve our understanding of 5hmC and its role in the regulation of tissue-specific gene expression. Furthermore, comprehensive reference datasets of 5hmC in normal tissues are required to effectively study its contribution to disease.
5hmC is the most abundant form of oxidized 5mC in human tissues [Citation4]. It is now appreciated that a large proportion of cellular 5hmC is chemically stable and not simply present as an intermediate in the regeneration of naiive cytosine [Citation5]. An increasing body of evidence suggests this stable contingent of 5hmC directly participates in the regulation of gene expression. Indeed, enrichment for 5hmC has been observed among genomic regions positively-associated with transcription, such as enhancers, DNase hypersensitivity sites, transcription factor binding sites, and sense-strand DNA [Citation8–Citation12]. Proteins capable of binding 5hmC have been identified, including transcription factors and chromatin regulators [Citation13–Citation15], providing insight into the mechanism by which 5hmC regulates gene expression. For example, epigenetic readers MDB3 and MeCP2 show preferential specificity for 5hmC, and both have important roles in transcriptional regulation [Citation16]. Co-localization of 5hmC at sites of DNA damage has also promoted discussion of its potential functions in the facilitation and coordination of DNA repair [Citation17,Citation18]. Contrasting with that of 5mC, distribution and abundance of 5hmC varies greatly across human tissues. Brain and breast tissue possess the most abundant 5hmC among human tissues [Citation19]. Approximately four times greater levels of 5hmC has been observed in brain relative to breast tissue [Citation19], and brain has therefore been the focus of early studies characterizing the distribution of 5hmC in human tissues [Citation20–Citation25]. However, little is known regarding the genomic distribution and function of 5hmC in breast tissue.
Emerging evidence also suggests dysregulation of 5hmC abundance may actively contribute to human cancer2 [Citation6,Citation26]. Global reduction of 5hmC is observed among cancers of diverse tissues [Citation27,Citation28], including breast cancer, and maintenance of 5hmC protects against characteristic cancer-associated CpG island hypermethylation [Citation29,Citation30]. Accordingly, mechanisms that abrogate TET expression and function, ultimately reducing 5hmC production, appear to be ubiquitous across human cancer [Citation31–Citation35]. While methylation changes between normal and invasive-breast tissue are well documented [Citation36,Citation37], previous studies have not accounted for changes in 5hmC abundance. Indeed, decreased levels of 5hmC have been reported as a poor prognostic factor in breast cancer [Citation38]. Collectively, these observations suggest dysregulation of 5hmC may contribute to breast cancer: however, the detailed reference maps of 5hmC in normal breast tissues required to test this hypothesis are not yet available.
Quantification of DNA methylation through sodium bisulfite (BS) treatment followed by hybridization to methylation arrays has been used extensively in biomedical research however, this approach cannot disambiguate 5mC from 5hmC. Oxidative treatment of DNA using potassium perruthenate converts 5hmC to 5-formylcytosine (5fC), which can be further converted to uracil and finally thymine using standard BS treatment. Consequently, cytosine and 5hmC are converted to thymine by the oxidative sodium BS (oxBS) procedure, while 5mC remains unconverted [Citation39,Citation40]. Tandem profiling of BS and oxBS-treated DNA from the same samples followed by hybridization to Infinium DNA methylation arrays allows accurate and reliable quantification of 5hmC and 5mC [Citation41,Citation42]. In recent years, the oxBS procedure has facilitated studies of the genomic distribution and function of 5hmC in human tissues [Citation41,Citation43,Citation44].
Here, we utilize paired bisulfite (BS) and oxidative-bisulfite (oxBS) DNA modification followed by assessment using Infinium HumanMethylation450 arrays (450 K) to produce a genome-wide map of 5mC and 5hmC distribution in normal breast tissue. While 5hmC levels throughout much of the breast genome are low, we identify and describe genomic loci containing elevated 5hmC. Furthermore, we demonstrate that the distribution of high 5hmC is dependent on genomic-context and is highly enriched among breast-specific gene regulatory regions associated with open chromatin and active transcription. Finally, we demonstrate 5hmC enrichment among regulatory regions in transformed and malignant breast cancer cell lines and observe 5hmC enrichment among CpG loci differentially methylated between normal and invasive breast tissues. These findings give insight into the potential functions of 5hmC in breast tissue and provide a tissue-specific reference as a resource for the scientific community.
Results
5hmC abundance and distribution in normal breast tissue
To assess the genomic distribution of 5hmC in normal breast tissue, we measured genome-wide 5hmC and 5mC in 18 normal breast tissue samples from 17 distinct deceased female donors with no histological evidence of disease. All tissue donors were female and spanned a wide range of ages and BMI values (). Study donors were aged between 15 and 80 years (median = 58 years), weighed between 41 and 204 kg (median = 68 kg) and had BMI values between 15 and 63 (median = 25). To obtain total and single-nucleotide resolution estimates for 5hmC and 5mC we applied the OxyBS algorithm[Citation45] to data from paired BS and oxBS-treated DNA measured with 450K arrays. Altered expression of enzymes that process cytosine modifications on DNA (such as TET1, TET2, DNMT3A, and DNMT3B) could potentially explain the observed variation in total 5hmC across samples therefore, we tested for correlation between total 5hmC and expression of enzymes that process cytosine modification. Generally, there was no correlative evidence between total 5hmC and gene expression of cytosine modifying enzymes however, we did observe a modest correlation between total 5hmC and DNMT3A expression (r2 = 0.52, P= 0.03, Supplementary Table 1). Supporting the hypothesis that 5hmC may have functions independent of its role in regeneration of naïve cytosine, we tested the association between total 5hmC (that is, the sum of 5hmC β-values across all CpGs in a sample divided by the total number of CpGs profiled) and 5mC content across all samples and no evidence of a significant relationship was observed (linear regression P= 0.11, Supplementary Figure 1). Variation in cell-type composition of heterogeneous tissues is known to be a potential confounder in epigenomic studies [Citation46] and could impact 5hmC levels. To address this issue, we estimated putative cell types and their proportions using a reference-free cell-type deconvolution-based approach (RefFreeEWAS) [Citation47], which suggested two major cell populations with varying proportions across donors in these samples (Supplementary Figure 2). However, no relationship was observed between total 5hmC content and cellular proportions (Supplementary Figure 2).
Table 1. Donor characteristics.
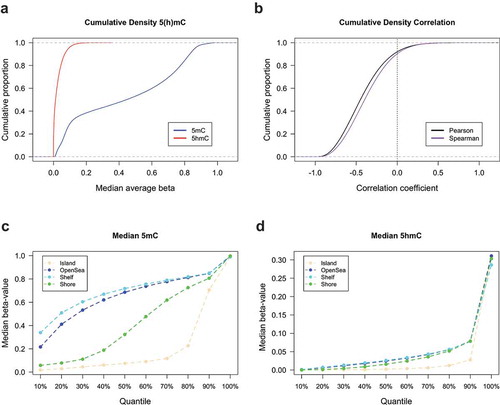
We next sought to evaluate the genome-wide distribution of 5hmC at the nucleotide level. Cumulative density plots of mean 5hmC and 5mC at each measured CpG across all samples revealed that the majority of CpGs had low levels of 5hmC and that mean 5mC levels across all CpGs had the expected bimodal distribution (). Most CpGs also showed a negative correlation between 5hmC and 5mC levels, with only approximately 10% of all CpGs demonstrating a positive correlation (). We observed the well-documented characteristic dependency of CpG island context on 5mC abundance, with relatively lower proportions of 5mC situated within CpG island and CpG island shore regions compared to open sea and shelf regions (). Despite the substantially lower abundance of 5hmC, a similar pattern of abundance was observed across the CpG island context strata to that of 5mC, with the lowest levels of 5hmC present within CpG island and CpG island shores (). Functions of DNA methylation are known to vary by genomic region therefore, we posited that 5hmC may be differentially distributed among CpG islands, shores, shelves, and open sea regions in breast tissue. Based on the percentile distribution of median beta values across all donors, the highest levels of both 5hmC and 5mC were observed within CpG island shelf regions ()). Similar levels of 5hmC was seen across CpG open sea, shores and shelve regions, while shores exhibited greater levels of 5mC relative to open seas and shelves ().
Figure 1. Abundance and genomic distribution of 5hmC in breast tissue. (a) Cumulative density distributions of median 5hmC and 5mC methylation beta-values breast tissue (n= 18). (b) Cumulative density distributions of Pearson and Spearman correlation coefficients as calculated for the relationship between 5hmC and 5mC beta-values at each CpG loci across all breast tissues (n= 18). Percentiles of median 5mC (c) and 5hmC (d) beta-values as calculated across all breast tissues and stratified by CpG island context (islands, shores, shelves, and open sea regions).
Genomic enrichment of 5hmC in normal breast tissue
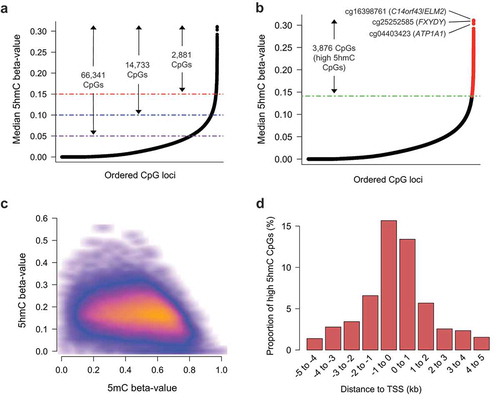
To provide insight into the potential functional relevance of 5hmC in breast tissue, we sought to identify CpG loci with the highest consistent abundance across samples. Large numbers of CpGs had median 5hmC beta-values near 0, though 66,341 CpG sites had median 5hmC levels above 5%, 14,733 CpG sites had median 5hmC levels above 10%, and 2,881 CpG sites had median 5hmC levels above 15% (). Aiming to distinguish functional 5hmC signal from background noise due to the generally sparse nature of 5hmC, we selected 3876 CpGs with the highest 1% median 5hmC values, as calculated across all samples (). These CpGs had a range of median 5hmC beta-values from 14% to 31% and were defined as the ‘high 5hmC CpGs’ utilized in subsequent analyses. We utilized the quantile distribution of 5hmC beta-values to measure the consistency of each high 5hmC CpG across all tested breast tissues. 84.6% of the high 5hmC CpGs (3281/3876) presented with a 5hmC beta value of >0.15 (25th percentile of 5hmC beta-value distribution) in at least half of the 18 tissue samples, demonstrating these CpG loci were consistently elevated across samples. In contrast, 12.9% (500/3876) of the high 5hmC CpGs were among the top 1% most variable, based on standard deviation, suggesting more inter-subject variability. Basic genomic annotation data, as well as CpG-specific median and standard deviation, are provided for the complete high 5hmC CpG set in Supplementary Data 1. To assess the relationship between 5hmC and 5mC abundance at a CpG-specific level, we compared 5hmC and 5mC beta-values at all high 5hmC CpG sites across all donors. Generally, the greatest levels of 5hmC were observed for CpGs with intermediate to low levels of 5mC (), suggesting 5hmC may function in a manner distinct from 5mC. The majority of high 5hmC CpGs (3342/3876, 86.2%) were located within promoters, exons or introns) with the remaining CpGs located in intergenic regions (Supplementary Data 2). cg16398761 (C14orf43/ELM2), cg25252585 (FXYDY), and cg04403423 (ATP1A1) represented the three individual CpG loci with the most abundant 5hmC (median beta-values 0.310, 0.296, and 0.294 ()), respectively. SEPT9, a member of the septin family of cytoskeletal polymers [Citation48], was associated with the greatest number of high 5hmC CpGs (a total of nine CpGs) of any gene covered on the 450K array (Supplementary Data 2). In addition, there were 44 genes with at least five high 5hmC CpG located within or proximal to them. An overwhelming proportion of these high 5hmC CpGs associated with these genes was located within intronic regions (Supplementary Data 2). In addition, many of the genes containing at least five high 5hmC CpGs were located within transcriptional (co)activators or chromatin-modifying genes, including NCOR2, ARID1B, DNMT3A, FOXO3, and FOXP1, among others (Supplementary Data 2). Furthermore, several tumor suppressor genes (TSGs; MBNL1, ARID1B, DNMT3A, and FOXO3) as well as oncogenes (AFF1, FOXP1, GNAS, LPP, MAML2, PBX1, ZBTB16) were present among the 44 genes associated with at least five high 5hmC CpGs, suggesting dysregulation of 5hmC abundance at specific loci could contribute to breast-related carcinogenesis. Unsupervised clustering analyses using the high 5hmC loci did not clearly distinguish donors by age, BMI or cell type proportion (Supplementary Figure 3).
Figure 2. 5hmC is uniquely distributed in breast tissue. (a) Rank ordered distribution of CpG-specific median 5hmC as calculated across 18 breast tissues. Purple, blue, and red lines, in conjunction with arrows and labels, indicate the number of CpG loci with at least a minimum beta-value of 0.05, 0.10, and 0.15, respectively. (b) Rank ordered distribution of CpG-specific median 5hmC as calculated across 18 breast tissues, with the highest 1% mean 5hmC values (the ‘high 5hmC CpG sites’) across all samples denoted in red. Green line denotes mean 5hmC value of the 3876th rank ordered high 5hmC CpG. (c) Scatter density plot of 5hmC beta-value vs 5mC beta-value for all high 5hmC CpGs. Each high 5hmC CpG is plotted once for each sample. Regions of orange and red indicate a higher density of CpGs, whereas darker (black) regions indicate sparsity. (d) High 5hmC CpG site distribution relative to nearest canonical transcriptional start site (TSS). Vertical axis indicates the percentage of high 5hmC within each distance grouping denoted on the horizontal axis. Distance groupings provided for regions upstream and downstream on canonical TSSs. kb; kilo bases.
Previous studies in both non-diseased and diseased tissue have suggested an enrichment for 5hmC amongst regions involved in transcriptional regulation and gene bodies [Citation8,Citation9,Citation49]. Amongst the high 5hmC CpGs, similar proportions were observed up- and downstream (51.7% and 48.3%, respectively) of the nearest canonical transcriptional start site (TSS) (Supplementary Figure 4), with the majority situated within at most 1kb of the TSS (). Significant enrichment for the high 5hmC CpG loci was observed among CpG island shore regions, with relatively lower levels of enrichment among shelf and open sea regions (). In contrast, CpG island regions were strongly depleted of high 5hmC CpGs (). To control for the varying proportion of 5hmC by CpG island context, we applied the Cochran-Mantel-Haenzel test for enrichment analyses of 5hmC among other genomic features, allowing us to test the enrichment of 5hmC among specific genomic features while adjusting for CpG island context. We observed a substantial enrichment for intronic 5hmC, yet a dearth of exonic and intergenic 5hmC (). Among repetitive DNA elements, 5hmC demonstrated a significant enrichment at SINE and LINE elements, as well as a depletion among low complexity and simple repeats (Supplementary Figure 5). No overlapping genomic loci were identified between high 5hmC CpGs and satellite or ncRNA repeats (Supplementary Figure 5), suggesting a strong depletion of 5hmC among such regions. 5hmC did not show a significant relationship among regions containing long-terminal repeat (LTR) elements (Supplementary Figure 5).
Figure 3. 5hmC is enriched among genomic regions associated with transcriptional regulation. Forest plots show enrichment of high 5hmC CpGs, as determined across 18 normal breast tissue samples, among (a) CpG island regions (CpG islands, shores, shelves, and open sea regions), (b) transcriptional features (promoters, introns, exons, or intergenic regions), (c) ChromHMM states in breast myoepithelial cells (E027), and (d) ChromHMM states in human mammary epithelial cells (HMECs, E119). Enrichment was determined using Fisher’s exact tests (in a) or Cochran-Mantel-Haenszel tests (in b–d) to calculate odds ratios (ORs) and 95% confidence intervals (95% CIs), with the 450K background set of CpGs used as the background, while controlling for CpG island context (islands, shores, shelves, open seas). Numerical values for odds ratios and P-values are provided in tables adjacent to each forest plot.
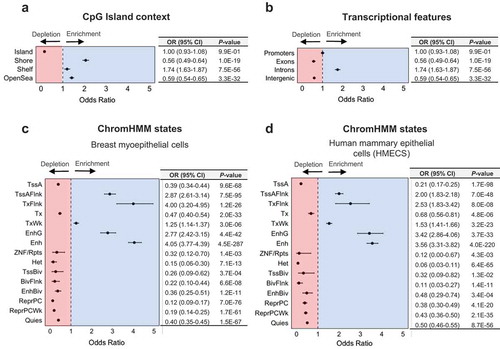
To test the enrichment of 5hmC among breast-specific regulatory regions, we leveraged learned chromatin states for normal breast myoepithelial cells and human mammary epithelial cells (HMECs). These chromatin states are derived from the core 15-state model, learned through the application of ChromHMM, a multivariate hidden markov model, to consolidated epigenomes generated in the NIH Roadmap Epigenomics Project [Citation50,Citation51]. ChromHMM states in the core 15-state model represent active chromatin states associated with transcriptional activity and seven associated with transcriptional repression. In breast myoepithelial cells, we observed enrichment among several ChromHMM states associated with active transcription, enhancer regions (both genic and non-genic enhancers) as well as regions annotated as having weak transcription, flanking an active TSS, or regions flanking an actively transcribed state (). In contrast, all seven regions associated with transcriptional inactivity were strongly depleted for 5hmC (). The strongest depletions were observed for repressed PolyComb regions (OR, 95% CI; 0.15, 0.06–0.30), and heterochromatin (OR, 95% CI; 0.12, 0.09–0.17; ). Three states associated with transcriptional activity (active TSSs, regions with active transcription, and ZNF genes/repeats) also demonstrated a depletion for 5hmC. An almost identical trend was observed for enrichment of 5hmC among ChromHMM states in HMECs, with the exception of larger enrichment among genic enhancers in HMECs (OR, 95% CI; 3.42, 2.86–4.06; ) compared with breast myoepithelial cells (OR, 95% CI; 2.77, 2.42–3.15; ), and smaller enrichment at regions flanking active transcription in HMECs (OR, 95% CI; 2.53, 1.83–3.42; ) compared to breast myoepithelial cells (OR, 95% CI; 4.00, 3.20–4.95; ). These results were consistent with enrichment profiles observed for individual histone modifications in breast myoepithelial cells and HMECs (Supplementary Figure 6). Together, these data highlight individual genes with increased 5hmC abundance in normal breast tissue and demonstrate 5hmC is associated with transcriptional activity throughout the breast genome.
Relation of 5hmC to breast-specific gene expression programs
Given the observed enrichment of 5hmC among breast-specific regulatory regions, it is plausible that a higher-order structure exists for its distribution such that 5hmC is involved in the regulation of critical gene sets. To investigate potential enrichment of 5hmC among specific gene regulatory programs, genomic coordinates of the high 5hmC CpGs were tested for gene set enrichment using the Genomic Regions Enrichment of Annotations Tool (GREAT). GREAT uses the genomic coordinates of each loci included in the input to associate these coordinates with individual genes [Citation52]. In total, 3949 unique genes were associated with the genomic coordinates covered by the high 5hmC CpG loci (Supplementary Data 3). CpG loci measured on the 450K array were used as the background test set in these analyses. The ten most enriched gene sets with FDR Q-values <0.05 from each of the; i) biological process, ii) molecular function, and iii) cellular process gene ontology analyses are presented in . Results for all gene sets significant at FDR < 0.05 are provided in Supplementary Data 4. The most enriched gene set in the biological process analysis was for lactate oxidation (fold enrichment; 28.3, hypergeometric FDR Q-value; 0.03, ). Among the most enriched gene sets were also those relating to production of interleukins, function and activity of various immune cell types, and several biosynthetic processes including D-serine synthesis (). Interestingly, enrichment of the prolactin signaling pathway gene sets suggests potential involvement of 5hmC in regulating breast milk production (). Enrichment of molecular function gene sets relating to interleukin binding and D-serine biosynthesis activity further supported the results observed in the analyses of biological process gene sets. Enrichment was also observed for several molecular function gene sets related to binding and activity of TGF-beta (Supplementary Data 5), supporting the observation that five of the high 5hmC CpGs were located within the gene body of TGFBR2 (Supplementary Data 5). Consistent with recent findings that 5hmC may be involved in the regulation genome stability, the most strongly enriched gene set in the cellular process ontology analysis was related to the replication fork protection complex (fold enrichment; 28.3, hypergeometric FDR Q-value; 0.02, ). In addition, several of the enriched cellular process gene sets related to cell tip and membrane regulation (Table, Supplementary Data 6).
Table 2. Genomic regions enrichment of annotations tool (GREAT) analysis of genomic regions containing high breast 5hmC CpGs.
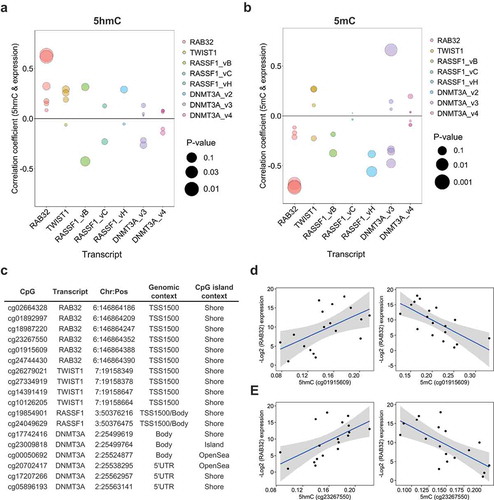
Concordant with the hypothesis that 5hmC may participate in tissue-specific regulation of critical gene sets, several studies have observed a positive relationship between 5hmC abundance and tissue-specific gene expression. To explore the relation of 5hmC and gene expression in normal breast tissue, we utilized transcriptomic data from 292 normal breast tissue samples collected through the GTEx (Genotype-Tissue Expression) project. Median expression values across all 292 samples were used to assign individual transcripts to ‘high’ (median expression ≥50th percentile) or ‘low’ (median expression <50th percentile) expression groups: and these groups were then tested for enrichment of genes associated with high 5hmC CpGs. We observed a significant positive enrichment for genes associated with high 5hmC loci among transcripts assigned to the ‘high’ expression group (OR, 2.1; 95% CI, 1.95–2.27; P-value, 2.1E-11; Supplementary Table 2). These results suggest that 5hmC localizes to actively expressed genes in normal breast tissue. To further interrogate the relationship between 5hmC abundance and gene expression in normal breast tissue, we measured transcript levels of four genes with known functions in breast tissue and multiple high 5hmC CpG loci. Generally, 5hmC was positively correlated with expression across the measured transcripts (), Supplementary Data 8), while 5mC showed mostly negative correlations with gene expression (, Supplementary Data 8). Among the most statistically significant correlations were those of cg23267550 and cg01915609 with RAB32 expression for both 5hmC and 5mC (). The remaining four high 5hmC CpGs associated with RAB32 demonstrated positive correlations between 5hmC and gene expression, while exhibiting negative correlations between 5mC and gene abundance, but did not reach statistical significance (). All six of the high 5hmC CpGs associated with RAB32 were located in the within 1500 bp of the TSS (TSS1500), at CpG island shore regions (). Across the transcripts measured for breast cancer tumor suppressor RASSF1A, there was evidence for positive correlations between 5hmC and expression for three CpG-expression relationships, while almost all of the tested CpGs showed negative correlations between expression and 5mC (Supplementary Data 8). Although several studies have suggested roles for 5hmC in the regulation of alternative splicing, we did not observe dramatic modification of 5hmC-gene expression correlations by transcript-specific expression of RASSF1 and DNMT3A (Supplementary Data 9).
Figure 4. 5hmC is positively associated with gene expression. Spearman correlation coefficients of the relationship between 5hmC (a) and 5mC (b) abundance and gene expression at high 5hmC CpGs associated with candidate genes of interest. Colors denote the methylation-expression relationship of CpGs associated with the genes denoted on the x-axis. Bubble size corresponds to statistical significance (-Log10 P-value) associated with the correlation coefficient. (c) Genomic annotation for the 18 high 5hmC CpGs tested for correlations between methylation and gene expression. (d and e) Scatter plots of subject-specific 5hmC or 5mC beta-values for cg01915609 (d) and cg23267550 (e) against Log2 expression values for RAB32. Regression line indicated in blue with 95% confidence bands in gray.
Finally, to explore the potential relationship between 5hmC and breast-specific gene expression programs, we utilized Locus Overlap Analysis (LOLA) to test genomic coordinates of high 5hmC CpGs for enrichment among known transcription factor-binding sites (TFBS) and regulatory regions in breast cell line data from ENCODE and the cistrome collection. Across three breast cancer cell lines from the cistrome collection enrichment of 5hmC was observed for 15 TFBS including estrogen receptor 1, ESR1 (FDR <0.05, Supplementary Figure 7, Supplementary Data 10). Binding sites for other transcription factors involved in the regulation of breast-specific regulatory programs were also observed, including PGR (progesterone receptor), FOXA1, and GATA3 (Supplementary Figure 7). Enrichment of 5hmC was observed among TFBS from the ENCODE project collection revealed enrichment among c-Fos binding sites in normal-like MCF10A cells stably transformed through forced expression of the Src oncoprotein, and maintain a transformed epigenetic landscape [Citation53]. Further enrichment of 5hmC was observed among GATA3 binding sites in ER+ breast cancer cell line MCF-7 cells (Supplementary Data 10) and H3K4me1-marked regions in T47D cells from the cistrome-epigenome collection, suggesting enrichment among active and poised enhancers (Supplementary Data 10). Collectively, these data demonstrate a positive relationship between 5hmC abundance and gene expression in breast tissues, and suggest 5hmC may coordinate expression of breast-specific gene regulatory programs in normal and potentially malignant breast tissues.
Normal breast tissue 5hmC is enriched among genomic regions related to breast carcinogenesis
Epigenetic deregulation is an early event in carcinogenesis. Substantial deviation from DNA methylation patterns in normal breast tissue has been observed in premalignant lesions as well as in advanced disease [Citation36,Citation37]. Although 5hmC tends to be depleted in proliferating cells [Citation27,Citation28], recent studies have suggested 5hmC may be involved in the regulation of cancer-related phenotypes [Citation30,Citation43,Citation54,Citation55]. To assess the potential contribution of 5hmC to breast carcinogenesis, we utilized available data describing regulatory regions present in variant human mammary epithelial cells (vHMECs), proliferative clones of HMECs that invariably result during cell culture, and share several phenotypes with premalignant breast cancers. Specifically, we identified chromatin states (defined using the core 15-state ChromHMM model) that were non-overlapping between parental HMECs and variant HMECs (that is, chromatin states lost or gained during the progression from HMEC to vHMEC). We observed a substantial enrichment of CpG loci with high normal breast tissue 5hmC among several states associated with active chromatin regions (). In particular, enhancer regions (both genic and non-genic enhancers) as well as regions annotated as having weak transcription, flanking an active TSS, and regions flanking an actively transcribed state, demonstrated enrichment for 5hmC (). Active TSSs, strongly transcribed regions and ZNF gene/repeats regions represented exceptions to this trend, demonstrating depletion for 5hmC (). Among the chromatin states associated with transcriptional inactivity, all seven were depleted for 5hmC, with the strongest depletion observed for regions of heterochromatin (OR, 95% CI, 0.11 (0.05–0.21); ). Similar patterns of enrichment for normal breast tissue 5hmC were observed for chromatin states either lost or gained during the progression from HMEC to vHMEC (Supplementary Figure 8). These data suggest sites with high 5hmC in normal breast tissue are enriched among regions of transcriptionally active chromatin that may become altered during transformation, indicating dysregulation of 5hmC abundance at these loci may contribute to this process.
Figure 5. Normal breast tissue 5hmC is enriched among regions relevant to breast carcinogenesis. (a) Forest plot of high 5hmC CpG enrichment among non-overlapping ChromHMM states between parental HMECs (E027) and variant HMECs (vHMECs, E028). Cochran-Mantel-Haenszel tests to calculate odds ratios (ORs) of 5hmC enrichment, and 95% confidence intervals (95% CIs), with the 450K background set of CpGs used as the background, while controlling for CpG island context (islands, shores, shelves, open seas). Numerical values for odds ratios and P-values are provided in the adjacent table. No lower bound is presented for the enrichment of 5hmC among ZNF/Rpts as no high 5hmC CpG sites were identified that overlapped regions annotated as ZNF/Rpts. (b) Volcano plot shows results from 3572 age-adjusted multivariable linear (limma) models of differential methylation across normal (n = 95) and tumor tissue (n = 753) for each of the high 5hmC CpGs. Red points demonstrated statistically significant differential methylation status across normal and tumor tissues after correction for multiple testing. Dashed red line indicates the Bonferroni significance threshold for 3572 tests (P = 1.3E-05).
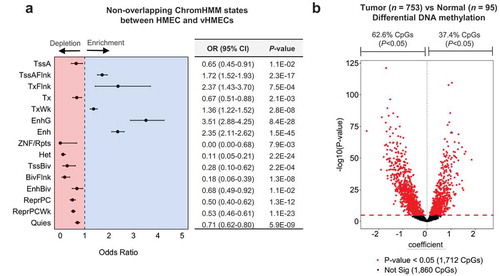
In addition to differences in chromatin organization, extensive alterations between histologically normal and premalignant or invasive lesions have been observed at the level of DNA methylation [Citation36,Citation37]. However, due to technical constraints, prior work comparing DNA methylation profiles between such tissues has been unable to distinguish 5hmC from 5mC. We sought to investigate whether high 5hmC loci identified in normal breast tissue were more likely to be altered in breast tumors than other CpG loci. First, at the same 3876 high 5hmC CpG loci we identified in normal breast tissue, we compared DNA methylation between normal (n= 95) and invasive-breast tissue (n= 753) from donors in the TCGA project. Of the 3572 CpG loci available for testing, 1712 (47.9%) were differentially methylated between normal and invasive tissue in limma models adjusted for subject age and adjusted for multiple testing using Bonferroni correction (). 1072 (62.6%) of the significantly differentially methylated loci had negative regression coefficients, suggesting 5hmC is more commonly lost from high 5hmC loci during breast cancer development, consistent with the observation that 5hmC is depleted in cancer tissues [Citation27,Citation28]. Next, using randomly selected CpGs in the normal versus tumor comparison we created a null P-value distribution (see methods and Supplementary Figure 8) and observed that the P-values for high 5hmC CpGs as a distribution were significantly lower (Kolmogorov–Smirnov test, P < 0.05, , Supplementary Figure 10A). In analyses stratified by intrinsic breast cancer subtype (luminal A, luminal B, HER2, basal, and normal-like) we observed significantly lower P-values for differential methylation of high 5hmC CpGs between normal and tumor tissues from luminal A, luminal B, HER2, and basal-like breast cancers (, Supplementary Figure 10(b–f)). This effect appeared strongest in analyses of luminal A and basal-like breast cancers (, Supplementary Figure 10(b–f)). P-values obtained from an identical analysis using only tumor samples classified in the normal-like subtype showed no significant difference from that of randomly selected CpGs. As extensive changes in DNA methylation have been observed to occur in ductal carcinoma in situ (DCIS) [Citation36], we repeated the procedure above using DNA methylation data from adjacent normal (n= 11) and DCIS tissue samples (n= 28) obtained from the New Hampshire Mammography Network (NHMN). In the comparison of DCIS to normal DNA methylation analysis, high 5hmC CpG sites identified in normal breast again had a distribution of P-values significantly lower than randomly selected CpGs (P= 0.017, , Supplementary Figure 11). Together these results suggest 5hmC dysregulation may contribute to breast cancer development, and an appreciable fraction of the changes may occur early in the carcinogenic process.
Table 3. Statistical comparison of P-value distributions obtained in differential methylation analyses between tumor/DCIS and adjacent normal tissues.
Discussion
While the distribution and functions of 5mC in various cellular contexts have been studied at depth, much less is known about the importance of other cytosine modifications. Traditional approaches utilizing DNA BS treatment to distinguish between cytosine and 5mC have been limited, as they are unable to disambiguate 5mC from its oxidized forms, limiting the utility of existing datasets for investigations of epigenetic regulation. Here, we performed tandem BS and oxBS treatment of DNA from normal breast tissue coupled with 450 K arrays for DNA methylation to estimate relative 5mC and 5hmC proportions and construct a genome-wide map of 5hmC in breast tissue. 5hmC was generally depleted compared with 5mC as expected, but specific loci with recurrent 5hmC across individual samples were identified. Regions containing abundant 5hmC were enriched among enhancers and transcriptionally active chromatin regions and depleted in transcriptionally repressed areas of the genome. Furthermore, we provide evidence suggesting deregulation of 5hmC at these loci may contribute to breast carcinogenesis. Together, our findings provide insight into the distribution and potential functions of 5hmC in mammary tissues, while providing the research community with a rich foundational resource upon which to further study the importance of 5hmC in a tissue-specific context.
Previous studies have observed a lack of obvious correlation between levels of 5mC and forms of oxidized cytosine in individual tissues [Citation4,Citation56]. Such findings suggest the abundance of oxidized cytosine may be subject to a higher-order regulation in a tissue-specific context. Indeed, active DNA demethylation controls various cellular processes such as somatic cell reprogramming [Citation57,Citation58], chromatin accessibility [Citation13,Citation15,Citation59], and numerous processes involved in cell fate specification [Citation60–Citation62]. Enrichment of 5hmC among enhancers [Citation8,Citation9,Citation49], open chromatin[Citation8], and gene bodies [Citation8,Citation43,Citation49,Citation63] observed in multiple cell types supports the proposal that 5hmC is a functional epigenetic mark involved in positive regulation of gene expression. Consistent with these findings, we found 5hmC enrichment among introns, enhancers, and regions with transcriptionally active chromatin. Furthermore, we observe a depletion of high 5hmC loci among CpG island regions, while an enrichment at CpG island shore regions, consistent with previous findings [Citation8,Citation24], as well as models suggesting the presence of 5hmC at CpG island shore regions prevents methylation encroachment of promoter CpG islands in cancer[Citation30]. Consistent with prior studies, We also observe significant enrichment of high 5hmC CpGs among CpG island shelf and open sea regions [Citation8,Citation24]. While these findings suggest 5hmC may serve a regulatory role in shelf and open sea regions, the mechanistic properties of its functions in these regions are likely distinct from that observed at CpG island shore regions. Among repetitive DNA elements, we observed an enrichment of breast tissue 5hmC among SINE and LINE repeats, while relatively depleted at satellite, low complexity, and simple repeats. Similarly, embryonic stem cells (ESCs) have been reported to show an enrichment of 5hmC among SINE and LINE repeats, while additionally demonstrating enrichment at LTR and satellite repeats[Citation11]. In brain tissues, 5hmC is enriched among both SINE and LTR elements, while depleted at LINE and satellite repeats[Citation25]. Despite growing appreciation for transposable elements as direct contributors to gene regulatory networks [Citation64], the tissue-specific functions of these elements are poorly understood. 5hmC-facilitated mobilization of transposable elements that serve productive functions in tissue-specific regulatory networks presents a plausible explanation for the enrichment of 5hmC among specific repeat elements, therefore, future studies leveraging the genomic distribution of 5hmC may contribute to elucidating roles of specific regulatory elements in gene regulation. Furthermore, future work should also aim to address how repeat element-mediated regulation of gene function is impacted by the global decrease in total 5hmC content observed in cancer [Citation9,Citation55,Citation65]. Mobilization of repetitive DNA elements due to loss of 5mC is known to contribute to carcinogenic processes [Citation66,Citation67], therefore understanding the function of 5hmC during these processes is required to more completely understand the roles of repetitive elements in cancer.
Representation of multiple transcriptional co(activators) and chromatin regulators, some of which hold established functions in breast tissue, among the genes with greatest 5hmC abundance suggests involvement of 5hmC in breast tissue-specific gene expression control. Gene set enrichment analyses of those genes containing the most abundant 5hmC suggested a potential function for 5hmC in regulation of immune cell activity, TGF-beta regulation, and cell motility. Additionally, we provide preliminary data suggesting 5hmC is associated with the expression implicating actively transcribed genes in normal breast tissues. While we did not observe evidence implicating 5hmC in the regulation of alternative splicing, studies that more comprehensively profile transcript levels in breast tissue will be required effectively explore this relationship. Collectively, these findings reveal a unique distribution of 5hmC in normal breast tissue that warrants further study.
Although decrease of total 5hmC content has been observed invariably over a wide range of cancers [Citation28,Citation55,Citation65], the contribution of locus-specific changes in 5hmC levels to cancer pathogenesis is not well understood. Emerging evidence suggests changes in 5hmC abundance regulates oncogenic processes in cancer, as has been observed in pancreatic ductal adenocarcinoma, glioblastoma, and breast tumor initiating cells [Citation43,Citation68–Citation70]. The identification of several oncogenes and tumor suppressor genes associated with several CpG loci with abundant 5hmC in normal breast tissues supports the hypothesis that deregulation of 5hmC could contribute to oncogenic processes. Of particular note, the gene associated with the greatest number of high 5hmC CpGs, SEPT9, a member of the septin family of cytoskeletal polymers, has been suggested to function as both a tumor suppressor and oncogene across several cancer types [Citation71], including breast cancer [Citation72–Citation74]. Production of several SEPT9 isoforms with distinct functions may provide an explanation as to why opposing roles in oncogenic processes have been described [Citation48,Citation75]. Promoter methylation status of isoform Sept9_i2 currently forms the basis for a blood-based screening test for colorectal cancer[Citation76]. Recently, downregulation of Sept9_i2 via promoter hypermethylation was observed in breast cancer cell lines [Citation75], suggesting potential tumor suppressive functions. Concordantly, Sept9_i2 promoter hypermethylation is also detectable in circulating tumor DNA of breast cancer patients [Citation77]. Given our observation that SEPT9 contains several high 5hmC CpG loci, further studies to resolve the relative distributions of 5mC and 5hmC among promoter regions of SETP9 isoforms in breast cancer are warranted. Furthermore, our findings that normal breast tissue 5hmC is enriched among enhancer regions in vHMEC cells, suggests maintenance of enhancer-specific 5hmC may be required for maintenance of their premalignant characteristics. While these results are encouraging, it should be noted the vHMECs likely do not holistically represent the epigenetic landscape of premalignant breast cancer, and future work should attempt to validate these findings in other models of early breast cancer. Additional evidence that 5hmC contributes to disease-relevant processes was obtained from our observation that normal breast 5hmC is enriched among estrogen receptor alpha (ESR1) binding sites in multiple breast cancer cell lines. In addition to ESR1, itself a critical determinant of estrogen therapy treatment response in ER+ breast cancer [Citation78], our findings that 5hmC is enriched among binding sites for FOXA1, GATA3, and the RAR family transcription factors, all known to function cooperatively with ESR1 in normal and malignant breast tissue [Citation79–Citation81], further supports the notion that locus-specific maintenance of 5hmC contributes to breast cancer pathogenesis. Whether CpG loci within these regulatory regions are subject to locus-specific increases in 5hmC or are protected from 5hmC loss during carcinogenesis will require more detailed interrogation of 5hmC at these loci across normal and malignant tissues. Furthermore, our observation that the high 5hmC CpGs identified in this cohort are enriched among differentially methylated loci between normal and malignant tissue from several intrinsic breast cancer subtypes, as well as differentially methylated loci between normal and pre-invasive tissues (ductal carcinoma in-situ), supports the hypothesis that alterations in 5hmC contribute to breast cancer pathogenesis, and that a portion of these alterations may occur in early stages of carcinogenesis. Given the findings that TET1 is commonly downregulated in hormone receptor-positive breast cancers [Citation82,Citation83], yet overexpressed in triple-negative breast cancers (TNBCs) [Citation84], it will be important for future work to examine the directionality of this phenomenon at the level of individual genes to assess the contribution of 5hmC dysregulation to cancer-related processes. More generally, total genomic 5hmC in breast tumors has also been observed as a poor prognostic indicator [Citation38], suggesting that 5hmC abundance may also contribute to tumors progression. Studies profiling 5hmC at base-resolution in tumors with available follow up and outcome data are required to further explore this relationship, and the resource detailed in this manuscript provides a healthy reference population that should be leveraged in such studies.
While we are encouraged by the consistency of our findings with previously published work, our measurements of 5hmC are aggregates across breast tissue cell types, which could introduce noise into our data. Though we addressed this issue using a reference-free cell type deconvolution method, we recognize that larger studies will provide more precise estimates of cell type proportions and their potential variation across donors. Furthermore, while we did not observe significant clustering of individuals in this cohort-based on 5hmC levels, larger studies will be required to explore population-level variability in the abundance and distribution of 5hmC in a tissue-specific manner. Finally, while not providing the level of coverage achieved by next-generation sequencing-based (NGS) technologies, the array-based approach used here provides a versatile balance between sample throughput, coverage, and cost, enabling effective population-scale profiling. Importantly, the 450 K array provides diverse coverage over unique genomic features, including CpG islands and their associated regions (shores, shelves, and open seas), promoters, enhancers, gene bodies, untranslated regions, MHC regions, and repetitive sequences [Citation85,Citation86]. For future research, both array- and NGS-based approaches will be valuable for improving our understanding of the tissue-specific distribution and function of 5hmC in human tissues.
Conclusions
In this work, we analysed data from tandem processed BS and oxBS-treated methylation arrays to produce a genome-wide map of 5hmC and 5mC in normal breast tissue. Identification of multiple transcriptional (co)-activators and chromatin-modifying genes containing elevated levels of 5hmC, including several breast-specific TSGs, suggests 5hmC may be involved in the regulation of key transcriptional programs in normal breast tissue. Consistent with previous findings, 5hmC was highly enriched among regulatory regions associated with transcriptionally active chromatin, while depleted among regions associated with gene repression. Additionally, we provide evidence that dysregulation of 5hmC in breast tissue may contribute to carcinogenesis. These findings extend our understanding of epigenetic regulation in normal breast tissue and provide a reference that can be used in future studies investigating the roles of 5hmC in normal and diseased breast tissue.
Methods
Study population
Fresh-frozen disease-free breast tissue samples (n = 18) were obtained at autopsy from 17 distinct deceased female donors with no histological evidence of disease, sourced from the National Disease Research Interchange (NDRI). Cause of death varied between donors, however, was generally unrelated to the presence of any chronic conditions, which were generally absent among donors with the exception of two individuals diagnosed with diabetes, one individual diagnosed with bladder cancer, and one individual diagnosed with pancreatic cancer, neither of whom received chemotherapy or radiation treatment. Median time from death to an autopsy was approximately 5.3 h, with a range of 0–11 h among donors. No relationship was observed between time to autopsy and total 5hmC content. Samples from pre-invasive lesions (ductal carcinoma in-situ, DCIS, n=40) and adjacent-normal were obtained through the New Hampshire Mammography Network (NHMN) and has been described previously [Citation37], while data from tumor (n=753) and adjacent-normal tissue (n = 95) samples was sourced from The Cancer Genome Atlas (TCGA) project. Intrinsic breast cancer subtype status (luminal A, luminal B, basal, HER2, and normal-like, described previously [Citation87]) of TCGA subjects were obtained using the PanCancerAtlas_subtypes function, available from R package TCGAbiolinks [Citation88]. All study donors from the NHMN and TCGA projects provided written informed consent at the time of surgery.
DNA extraction, conversion, and methylation profiling
DNA extraction was performed with the QIAmp DNeasy tissue kit (Qiagen) according to the manufacturer’s instructions. DNA conversion and methylation profiling have been described previously. Briefly, the quantity and quality of breast tissue DNA were determined with the Qubit 3.0 fluorometer (Life Technologies). Tandem bisulfite and oxidative bisulfite conversion were performed using the TrueMethyl® kit v.1.1 (Cambridge Epigenetix) protocol optimized for Infinium HumanMethylation450 arrays (450 K, Illumina, Inc., San Diego, CA), with an input of 4ug per sample. Genomic DNA was then sheared to ~10 kb fragments using g-TUBE (Covaris) and purified with the Gene-JET PCR Purification kit (Thermo Scientific). oxBS conversion was then performed with 1.4ug of sheared DNA according to the TrueMethyl protocol, and 1.05ug for bisulfite conversion using manufacturer recommended mass and volume. ssDNA was recovered and quantified with Qubit and processed on Illumina 450 Kmethylation arrays at the UCSF genomics core facility.
RNA extraction and nanostring gene expression
RNA extraction was performed using the RNeasy Mini tissue kit (Qiagen) according to the manufacturer’s instructions. Qubit 3.0 was used to determine RNA quality and quantity prior to expression profiling. Absolute expression quantification was performed using the nCounter Analysis System (NanoString Technologies). Transcripts selection was performed in conjunction with previously published work [Citation43], and limited to genes with known functions in breast tissue and an appreciable abundance of 5hmC, as well as being amenable to probe design for the nCounter assay. Epigenetic enzymes TET1, TET2, TET3, DNMT3A (transcript variants 2, 3, 4), DNMT3B, and DNMT1 were also selected for gene expression profiling. Platform-associated variation was normalized using the nSolver Analysis software (NanoString, V2.6). Expression of candidate transcripts of interest was normalized to that of housekeeping genes PUM1, BUSB, TBP, ACTB, and SDHA. Normalized gene expression data from this experiment are available in Supplementary Data 7.
Data processing and statistical analysis
5-(hydroxy)methylcytosine estimation and quality control
All data analysis was conducted in R version 3.3.1. Data processing of raw signals from BS and oxBS-treated samples has been previously described. Briefly, normalization and background correction were performed using the FunNorm procedure available in the R/Bioconductor package minfi (version 1.10.2). CpG sites located on sex chromosomes, identified as cross-reactive in previous studies, or associated with SNP sites were removed prior to analysis to prevent confounding. After quality control, 387,617 CpGs were left for analysis. To perform estimation of 5mC and 5hmC proportions in each sample, we applied the recently developed OxyBS algorithm, which uses a maximum likelihood-based method and more appropriate statistical constraints than previous methods to accurately predict methylated and unmethylated proportions. Code used to perform the estimation is available in R-package ‘OxyBS’ [Citation45]. To identify CpG sites with the greatest potential to be functionally relevant, we selected the 3876 CpGs among the top 1% median 5hmC value across all samples. These CpGs are referred to as the ‘high 5hmC CpGs’ in the results section.
Enrichment analyses of high 5hmC CpG loci
To test for 5hmC enrichment among transcriptional features, the UCSC_hg19_refGene file (downloaded from the UCSC Genome Browser) was used to define genomic regions as promoters, introns, exons, or intergenic. Promoters were defined as the ±2kb regions surrounding transcription start sites (TSS). CpG loci present on the 450 K array were then annotated to one of these regions using the annotateWithGeneParts() function from the R-package Genomation. Where CpG loci were associated with more than one genomic regions, the following precedence was applied: promoter>exon>intron. The GenomicRanges R/Bioconductor package was used to construct contingency tables describing the overlap between genomic coordinates of high 5hmC CpGs and the described transcriptional features, stratified by CpG island context. CpG island shore, shelf and open sea regions were defined according to published criteria [Citation85,Citation89,Citation90]. Briefly, CpG island shores define loci located within 2 kb of a CpG island, while CpG shelves define loci located 2–4 kb from a CpG island. CpG loci not located in island, shore, or shelf regions are classified as occurring in open seas. This approach resulted in four contingency tables per enrichment test, each denoting the overlap between high 5hmC CpGs and the genomic feature within that specific CpG island context. We then applied Cochran-Mantel-Haenszel tests to obtain odds ratios (ORs) and P-values. For all enrichment tests, CpG sites assayed on the Infinium 450 K array were used as background. Genomic coordinates (hg19) of human repetitive DNA elements from the RepeatMasker database [Citation91] were obtained using the UCSC table browser. Repeats located in non-coding RNA species were collapsed into one group for enrichment analyses. To test enrichment among specific chromatin states, genomic coordinates of ChromHMM states from the core 15-state model applied to breast myoepithelial cells (E027), human mammary epithelial cells (HMECs, E119), and variant human mammary epithelial cells (vHMECs, E028) were downloaded in BED file format from the NIH Roadmap Epigenomics Project [Citation50] website (https://www.ncbi.nlm.nih.gov/geo/roadmap/epigenomics/). The core 15-state ChromHMM model has been previously described [Citation51]. Briefly, ChromHMM, a multivariate hidden markov model, was trained on virtually concatenated data representing the core five chromatin marks (H3K4me3, H3K4me1, H3K36me3, H3K27me3, H3K9me3) from 60 high-quality epigenomes, to learn a 15-state model applicable to all 127 consolidated epigenomes profiled as part of the Roadmap Epigenomic Project. The resulting 15-state model consists of eight-active states associated with gene expression (active TSS, TssA; flanking active TSS, TssAFlnk; transcription at 5ʹ and 3ʹ ends of genes, TxFlnk; strong transcription, Tx; weak transcription, TxWk; genic enhancers, EnhG; enhancers, Enh; Zinc finger genes/repeats, ZNF/Rpts) and seven repressed states (heterochromatin, Het; bivalent/poised TSS, TssBiv; flaning bivalent TSS/Enhancer, BivFlnk; bivalent enhancer, EnhBiv; repressed PolyComb region, ReprPC; repressed PolyComb region ReprPCWk; quiescent, Quies). Similarly, genomic coordinates for available histone modifications obtained through chromatin immunoprecipitation sequencing (ChIP-seq) experiments for breast myoepithelial cells, HMECs, and vHMECs were downloaded Roadmap Epigenomics Project website. Enrichment of high 5hmC CpG loci among specific chromatin states and histone modifications were tested using the same approach described above for transcriptional features. R/Bioconductor packages IlluminaHumanMethylation450kmanifest, version 0.4.0, and IlluminaHumanMethylation450kanno.ilmn12.hg19, version 0.2.1 to obtain relevant array annotation data, including CpG island context.
GTEX gene expression analysis
RNA-seq generated TPM (transcripts per million) normalized read counts were downloaded from the Genotype-Tissue Expression (GTEx) dataset portal (https://gtexportal.org/home/datasets) and indexed to samples obtained from normal breast tissues. Read counts were log-transformed before median expression levels for each transcript were calculated, and used to calculate expression percentiles among all available transcripts. Transcripts were assigned to ‘high’ or ‘low’ expression groups based on expression quartiles. To map transcripts to individual 450K CpG loci, UCSC Refseq gene accessions for each CpG, obtained from the IlluminaHumanMethylation450kanno.ilmn12.hg19 package, were mapped to hg19 Ensembl transcript identifiers using the getBM() function from the biomaRt R/Bioconductor package [Citation92]. Expression data was restricted to transcripts associated with CpG loci present on the 450 K array, to provide an appropriate background set for statistical analyses. Enrichment for transcripts associated with high 5hmC CpG loci, among highly expressed genes, was tested using a Fisher’s exact test.
Preprocessing and quality control of TCGA and GSE66313 datasets
DNA methylation data from the TCGA project and NHMN (GSE66313) were subjected to the preprocessing and quality control pipeline described in Salas et al. [Citation93]. Briefly, raw intensity data files (IDATs) obtained using the 450 K microarray platform were imported and processed using the RnBeads R package [Citation94]. Methylation β-values for individual CpG loci were calculated as the ratio of methylated probe intensity divided by the total signal from the methylated and unmethylated signal intensities, plus an offset of 100 [Citation95]. Background correction was performed using methylumi-noob [Citation96] and normalized using a functional normalization procedure [Citation97]. Probes designed against CpG loci on sex chromosomes, non-CpG loci, or previously documented as polymorphic or cross-reactive were excluded from subsequent analyses [Citation98]. Finally, the Greedycut hierarchical algorithm [Citation94] was applied to the remaining data to identify and remove unreliable samples/probes. Briefly, Greedycut iteratively produces a matrix of retained and removed measurements each time the algorithm is applied to data where probes/samples are iteratively added/removed. Probes/samples with the highest fraction of unreliable measurements are removed from further analysis.
Analysis of CpG-specific associations
Differential methylation status between normal-adjacent and tumor/DCIS tissue at individual CpG-loci in the TCGA and NHMN data sets was determined by using multivariable linear models for microarray data (limma) [Citation99] to model logit-transformed methylation β-values (M-values). Models were adjusted for subject age, and Bonferroni correction was used to adjust for multiple testing. To determine if the proportion of high 5hmC CpG loci demonstrating significant differential methylation between normal and invasive breast tissue was greater than would be expected due to chance, we first took 1000 samples of randomly selected CpG loci of identical size (n = 3572) and CpG island context to the high 5hmC CpG loci. After ordering each randomly selected CpG set according to P-value magnitude, a single P-value distribution representative of a ‘null’ distribution was generated by averaging P-values across the 1000 sets. P-value distributions for the high-5hmC loci and the set representative of the ‘null’ distribution were then compared using the Kolmogorov–Smirnov test (Supplementary Figure 8).
Cell-mixture deconvolution
Fluctuations in cell-type proportions between samples are a well-documented potential confounder in studies of DNA methylation [Citation100,Citation101]. Reference-free cell mixture deconvolution methods have been recently developed and widely used [Citation102], to infer putative cell type proportions in studies of heterogeneous tissues where tissue-specific reference DNA methylomes do not exist. We used the RefFreeEWAS algorithm, implemented using R-package RefFreeEWAS [Citation47] to estimate putative cell-types and their cellular proportions in each sample. A variant of non-negative matrix factorization, the RefFreeEWAS algorithm attempts to identify the major axes of cellular variation in DNA methylation data and deconvolute these to methylomes of the individual cell types. Using methylation proportions from BS-treated DNA, we selected the 10,000 most variable CpG loci to determine the optimal number of cell-types (K) that explain the methylation data across all 18 samples. K = 2 was identified as the optimal number of putative cell-types. Finally, the full set of 387,617 passing the quality control procedures described above were used to obtain sample-specific estimates of the proportions for each of the two putative cell-types.
Data availability
The datasets supporting the conclusions of this article are available both at the repositories listed below, as well as within the article as additional files. Raw (IDAT files) and normalized DNA methylation data (450 K platform) used to estimate 5hmC and 5mC proportions from the 18 normal breast tissue samples are available under accession GSE100653 in the Gene Expression Omnibus (GEO) (http://www.ncbi.nlm.nih.gov/geo/). Raw DNA methylation data for DCIS and adjacent-normal tissue samples from the NHMN is also available in GEO (GSE66313). Level 1 TCGA breast (BRCA) intensity files derived from the 450 K platform were downloaded from the TCGA data portal and are currently available through the National Cancer Institute (NCI) Genomic Data Commons (GDC) data portal (https://portal.gdc.cancer.gov/). Coordinates of DNase hypersensitivity sites, histone modifications (derived from ChIP-seq experiments), and ChromHMM states in breast myoepithelial cells (E028), HMECs (E119), and vHMECs (E027) were downloaded from the NIH Roadmap Epigenomics Project [Citation50] and are also available in GEO. Specific GEO accession numbers from each Roadmap Epigenomics experiment can be found at https://www.ncbi.nlm.nih.gov/geo/roadmap/epigenomics/. All other data are available within the article or Supporting Information. R code used for all analyses is available in the ‘Normal-Breast-5hmC’ repository on GitHub (https://github.com/Christensen-Lab-Dartmouth).
Ethics approval and consent to participate
Informed consent for use of tissue samples in biomedical research from donors or next-of-kin has been obtained for all breast tissue samples sourced from the NDRI. For study donors from the NHMN and TCGA projects, written informed consent was provided at the time of surgery for use of their tissue specimens in research. All work was performed with Institutional Review Board (IRB) approval and is in accordance with the ethical principles outlined in the Declaration of Helsinki.
Authors’ Contributions
OMW conceived and designed the approach, performed statistical analyses, interpreted the results, wrote and revised the manuscript. KCJ conceived and designed the approach, performed statistical analyses, interpreted the results, wrote and revised the manuscript. EAH conceived and designed the approach, generated statistical models, performed statistical analyses, interpreted the results, and revised the manuscript. JEK carried out laboratory experiments and revised the manuscript. CJM conceived and designed the approach and revised the manuscript. BCC conceived and designed the approach, interpreted the results, wrote and revised the manuscript. All authors have read and approved the final manuscript.
Supplemental Material
Download MS Word (2.8 MB)Supplemental Material
Download MS Excel (634.7 KB)Disclosure statement
No potential conflict of interest was reported by the authors.
Supplementary material
Supplemental data for this article can be accessed here.
Additional information
Funding
Related Research Data
References
- Tahiliani M, Koh KP, Shen Y, et al. Conversion of 5-methylcytosine to 5-hydroxymethylcytosine in mammalian DNA by MLL partner TET1. Science. 2009;324:930–935.
- Yi C, Yang C-G, He C. A non-heme iron-mediated chemical demethylation in DNA and RNA. Acc Chem Res. 2009;42:519–529.
- Wu X, Zhang Y. TET-mediated active DNA demethylation: mechanism, function and beyond. Nat Rev Genet. 2017;18:517–534.
- Ito S, Shen L, Dai Q, et al. Tet proteins can convert 5-methylcytosine to 5-formylcytosine and 5-carboxylcytosine. Science. 2011;333:1300–1303.
- Bachman M, Uribe-Lewis S, Yang X, et al. 5-Hydroxymethylcytosine is a predominantly stable DNA modification. Nat Chem. 2014;6:1049–1055.
- Branco MR, Ficz G, Reik W. Uncovering the role of 5-hydroxymethylcytosine in the epigenome. Nat Rev Genet. 2011;13:7–13.
- Stroud H, Feng S, Morey Kinney S, et al. 5-Hydroxymethylcytosine is associated with enhancers and gene bodies in human embryonic stem cells. Genome Biol. 2011;12:R54.
- Yu M, Hon GC, Szulwach KE, et al. Base-resolution analysis of 5-hydroxymethylcytosine in the mammalian genome. Cell. 2012;149:1368–1380.
- Sun Z, Dai N, Borgaro JG, et al. A sensitive approach to map genome-wide 5-hydroxymethylcytosine and 5-formylcytosine at single-base resolution. Mol Cell. 2015;57:750–761.
- Pastor WA, Pape UJ, Huang Y, et al. Genome-wide mapping of 5-hydroxymethylcytosine in embryonic stem cells. Nature. 2011;473:394–397.
- Ficz G, Branco MR, Seisenberger S, et al. Dynamic regulation of 5-hydroxymethylcytosine in mouse ES cells and during differentiation. Nature. 2011;473:398–402.
- Wen L, Li X, Yan L, et al. Whole-genome analysis of 5-hydroxymethylcytosine and 5-methylcytosine at base resolution in the human brain. Genome Biol. 2014;15:R49.
- Iurlaro M, Ficz G, Oxley D, et al. A screen for hydroxymethylcytosine and formylcytosine binding proteins suggests functions in transcription and chromatin regulation. Genome Biol. 2013;14:R119.
- Spruijt CG, Gnerlich F, Smits AH, et al. Dynamic readers for 5-(hydroxy)methylcytosine and its oxidized derivatives. Cell. 2013;152:1146–1159.
- Mellen M, Ayata P, Dewell S, et al. MeCP2 binds to 5hmC enriched within active genes and accessible chromatin in the nervous system. Cell. 2012;151:1417–1430.
- Yildirim O, Li R, Hung J-H, et al. Mbd3/NURD complex regulates expression of 5-hydroxymethylcytosine marked genes in embryonic stem cells. Cell. 2011;147:1498–1510.
- Zhong J, Li X, Cai W, et al. TET1 modulates H4K16 acetylation by controlling auto-acetylation of hMOF to affect gene regulation and DNA repair function. Nucleic Acids Res. 2017;45:672–684.
- Kafer GR, Li X, Horii T, et al. 5-Hydroxymethylcytosine marks sites of DNA damage and promotes genome stability. Cell Rep. 2016;14:1283–1292.
- Nestor CE, Ottaviano R, Reddington J, et al. Tissue type is a major modifier of the 5-hydroxymethylcytosine content of human genes. Genome Res. 2012;22:467–477.
- Kriaucionis S, Heintz N. The nuclear DNA base 5-hydroxymethylcytosine is present in Purkinje neurons and the brain. Science. 2009;324:929–930.
- Jin S-G, Wu X, Li AX, et al. Genomic mapping of 5-hydroxymethylcytosine in the human brain. Nucleic Acids Res. 2011;39:5015–5024.
- Guo JU, Su Y, Zhong C, et al. Hydroxylation of 5-methylcytosine by TET1 promotes active DNA demethylation in the adult brain. Cell. 2011;145:423–434.
- Song C-X, Szulwach KE, Fu Y, et al. Selective chemical labeling reveals the genome-wide distribution of 5-hydroxymethylcytosine. Nat Biotechnol. 2011;29:68–72.
- Lunnon K, Hannon E, Smith RG, et al. Variation in 5-hydroxymethylcytosine across human cortex and cerebellum. Genome Biol. 2016;17:27.
- Szulwach KE, Li X, Li Y, et al. 5-hmC-mediated epigenetic dynamics during postnatal neurodevelopment and aging. Nat Neurosci. 2011;14:1607–1616.
- Vasanthakumar A, Godley LA. 5-hydroxymethylcytosine in cancer: significance in diagnosis and therapy. Cancer Genet. 2015;208:167–177.
- Jin S-G, Jiang Y, Qiu R, et al. 5-Hydroxymethylcytosine is strongly depleted in human cancers but its levels do not correlate with IDH1 mutations. Cancer Res. 2011;71:7360–7365.
- Kudo Y, Tateishi K, Yamamoto K, et al. Loss of 5-hydroxymethylcytosine is accompanied with malignant cellular transformation. Cancer Sci. 2012;103:670–676.
- Jin C, Lu Y, Jelinek J, et al. TET1 is a maintenance DNA demethylase that prevents methylation spreading in differentiated cells. Nucleic Acids Res. 2014;42:6956–6971.
- Skvortsova K, Masle-Farquhar E, Luu P-L, et al. DNA hypermethylation encroachment at CpG island borders in cancer is predisposed by H3K4 monomethylation patterns. Cancer Cell. 2019;35:297–314.e8.
- Song SJ, Poliseno L, Song MS, et al. MicroRNA-antagonism regulates breast cancer stemness and metastasis via TET-family-dependent chromatin remodeling. Cell. 2013;154:311–324.
- Thienpont B, Steinbacher J, Zhao H, et al. Tumour hypoxia causes DNA hypermethylation by reducing TET activity. Nature. 2016;537:63–68.
- Li L, Li C, Mao H, et al. Epigenetic inactivation of the CpG demethylase TET1 as a DNA methylation feedback loop in human cancers. Sci Rep. 2016;6:26591.
- Yamazaki J, Jelinek J, Lu Y, et al. TET2 Mutations Affect Non-CpG Island DNA Methylation at Enhancers and Transcription Factor-Binding Sites in Chronic Myelomonocytic Leukemia. Cancer Res. 2015;75:2833–2843.
- Rampal R, Alkalin A, Madzo J, et al. DNA hydroxymethylation profiling reveals that WT1 mutations result in loss of TET2 function in acute myeloid leukemia. Cell Rep. 2014;9:1841–1855.
- Fleischer T, Frigessi A, Johnson KC, et al. Genome-wide DNA methylation profiles in progression to in situ and invasive carcinoma of the breast with impact on gene transcription and prognosis. Genome Biol. 2014;15:435.
- Johnson KC, Koestler DC, Fleischer T, et al. DNA methylation in ductal carcinoma in situ related with future development of invasive breast cancer. Clin Epigenetics. 2015;7:75.
- Tsai K-W, Li G-C, Chen C-H, et al. Reduction of global 5-hydroxymethylcytosine is a poor prognostic factor in breast cancer patients, especially for an ER/PR-negative subtype. Breast Cancer Res Treat. 2015;153:219–234.
- Booth MJ, Branco MR, Ficz G, et al. Quantitative sequencing of 5-methylcytosine and 5-hydroxymethylcytosine at single-base resolution. Science. 2012;336:934–937.
- Booth MJ, Ost TWB, Beraldi D, et al. Oxidative bisulfite sequencing of 5-methylcytosine and 5-hydroxymethylcytosine. Nat Protoc. 2013;8:1841–1851.
- Field SF, Beraldi D, Bachman M, et al. Accurate measurement of 5-methylcytosine and 5-hydroxymethylcytosine in human cerebellum DNA by oxidative bisulfite on an array (OxBS-array). PLoS One. 2015;10:e0118202.
- Stewart SK, Morris TJ, Guilhamon P, et al. oxBS-450K: a method for analysing hydroxymethylation using 450K bead chips. Methods. 2015;72:9–15.
- Johnson KC, Houseman EA, King JE, et al. 5-Hydroxymethylcytosine localizes to enhancer elements and is associated with survival in glioblastoma patients. Nat Commun. 2016;7:13177.
- Green BB, Houseman EA, Johnson KC, et al. Hydroxymethylation is uniquely distributed within term placenta, and is associated with gene expression. Faseb J. 2016;30:2874–2884.
- Houseman EA, Johnson KC, Christensen BC. OxyBS: estimation of 5-methylcytosine and 5-hydroxymethylcytosine from tandem-treated oxidative bisulfite and bisulfite DNA. Bioinformatics. 2016;32:2505–2507.
- Jaffe AE, Irizarry RA. Accounting for cellular heterogeneity is critical in epigenome-wide association studies. Genome Biol. 2014;15:R31.
- Houseman EA, Molitor J, Marsit CJ. Reference-free cell mixture adjustments in analysis of DNA methylation data. Bioinformatics. 2014;30:1431–1439.
- Mostowy S, Cossart P. Septins: the fourth component of the cytoskeleton. Nat Rev Mol Cell Biol. 2012;13:183–194.
- Wu H, D’Alessio AC, Ito S, et al. Genome-wide analysis of 5-hydroxymethylcytosine distribution reveals its dual function in transcriptional regulation in mouse embryonic stem cells. Genes Dev. 2011;25:679–684.
- Bernstein BE, Stamatoyannopoulos JA, Costello JF, et al. The NIH roadmap epigenomics mapping consortium. Nat Biotechnol. 2010;28:1045–1048.
- Roadmap Epigenomics C, Kundaje A, Meuleman W, et al. Integrative analysis of 111 reference human epigenomes. Nature. 2015;518:317–330.
- McLean CY, Bristor D, Hiller M, et al. GREAT improves functional interpretation of cis-regulatory regions. Nat Biotechnol. 2010;28:495–501.
- Iliopoulos D, Hirsch HA, Struhl K. An epigenetic switch involving NF-kappaB, Lin28, Let-7 MicroRNA, and IL6 links inflammation to cell transformation. Cell. 2009;139:693–706.
- Kroeze LI, van der Reijden BA, Jansen JH. 5-Hydroxymethylcytosine: an epigenetic mark frequently deregulated in cancer. Biochim Biophys Acta. 2015;1855:144–154.
- Lian CG, Xu Y, Ceol C, et al. Loss of 5-hydroxymethylcytosine is an epigenetic hallmark of melanoma. Cell. 2012;150:1135–1146.
- Bachman M, Uribe-Lewis S, Yang X, et al. 5-Formylcytosine can be a stable DNA modification in mammals. Nat Chem Biol. 2015;11:555–557.
- Doege CA, Inoue K, Yamashita T, et al. Early-stage epigenetic modification during somatic cell reprogramming by Parp1 and Tet2. Nature. 2012;488:652–655.
- Hu X, Zhang L, Mao S-Q, et al. Tet and TDG mediate DNA demethylation essential for mesenchymal-to-epithelial transition in somatic cell reprogramming. Cell Stem Cell. 2014;14:512–522.
- Lio C-W, Zhang J, Gonzalez-Avalos E, et al. Tet2 and Tet3 cooperate with B-lineage transcription factors to regulate DNA modification and chromatin accessibility. Elife. 2016;5:e18290.
- Wheldon LM, Abakir A, Ferjentsik Z, et al. Transient accumulation of 5-carboxylcytosine indicates involvement of active demethylation in lineage specification of neural stem cells. Cell Rep. 2014;7:1353–1361.
- Yue X, Trifari S, Aijo T, et al. Control of Foxp3 stability through modulation of TET activity. J Exp Med. 2016;213:377–397.
- Orlanski S, Labi V, Reizel Y, et al. Tissue-specific DNA demethylation is required for proper B-cell differentiation and function. Proc Natl Acad Sci U S A. 2016;113:5018–5023.
- Xu Y, Wu F, Tan L, et al. Genome-wide regulation of 5hmC, 5mC, and gene expression by Tet1 hydroxylase in mouse embryonic stem cells. Mol Cell. 2011;42:451–464.
- Chuong EB, Elde NC, Feschotte C. Regulatory activities of transposable elements: from conflicts to benefits. Nat Rev Genet. 2017;18:71–86.
- Haffner MC, Chaux A, Meeker AK, et al. Global 5-hydroxymethylcytosine content is significantly reduced in tissue stem/progenitor cell compartments and in human cancers. Oncotarget. 2011;2:627–637.
- Robertson KD. DNA methylation, methyltransferases, and cancer. Oncogene. 2001;20:3139–3155.
- Ehrlich M. DNA hypomethylation in cancer cells. Epigenomics. 2009;1:239–259.
- Bhattacharyya S, Pradhan K, Campbell N, et al. Altered hydroxymethylation is seen at regulatory regions in pancreatic cancer and regulates oncogenic pathways. Genome Res. 2017;27:1830–1842.
- Takai H, Masuda K, Sato T, et al. 5-Hydroxymethylcytosine plays a critical role in glioblastomagenesis by recruiting the CHTOP-methylosome complex. Cell Rep. 2014;9:48–60.
- Wu M-Z, Chen S-F, Nieh S, et al. Hypoxia Drives Breast Tumor Malignancy through a TET-TNFalpha-p38-MAPK Signaling Axis. Cancer Res. 2015;75:3912–3924.
- Connolly D, Abdesselam I, Verdier-Pinard P, et al. Septin roles in tumorigenesis. Biol Chem. 2011;392:725–738.
- Montagna C, Lyu MS, Hunter K, et al. The Septin 9 (MSF) gene is amplified and overexpressed in mouse mammary gland adenocarcinomas and human breast cancer cell lines. Cancer Res. 2003;63:2179–2187.
- Connolly D, Yang Z, Castaldi M, et al. Septin 9 isoform expression, localization and epigenetic changes during human and mouse breast cancer progression. Breast Cancer Res. 2011;13:R76.
- Connolly D, Hoang HG, Adler E, et al. Septin 9 amplification and isoform-specific expression in peritumoral and tumor breast tissue. Biol Chem. 2014;395:157–167.
- Verdier-Pinard P, Salaun D, Bouguenina H, et al. Septin 9_i2 is downregulated in tumors, impairs cancer cell migration and alters subnuclear actin filaments. Sci Rep. 2017;7:44976.
- Potter NT, Hurban P, White MN, et al. Validation of a real-time PCR-based qualitative assay for the detection of methylated SEPT9 DNA in human plasma. Clin Chem. 2014;60:1183–1191.
- Matsui S, Kagara N, Mishima C, et al. Methylation of the SEPT9_v2 promoter as a novel marker for the detection of circulating tumor DNA in breast cancer patients. Oncol Rep. 2016;36:2225–2235.
- Ross-Innes CS, Stark R, Teschendorff AE, et al. Differential oestrogen receptor binding is associated with clinical outcome in breast cancer. Nature. 2012;481:389–393.
- Hurtado A, Holmes KA, Ross-Innes CS, et al. FOXA1 is a key determinant of estrogen receptor function and endocrine response. Nat Genet. 2011;43:27–33.
- Theodorou V, Stark R, Menon S, et al. GATA3 acts upstream of FOXA1 in mediating ESR1 binding by shaping enhancer accessibility. Genome Res. 2013;23:12–22.
- Hua S, Kittler R, White KP. Genomic antagonism between retinoic acid and estrogen signaling in breast cancer. Cell. 2009;137:1259–1271.
- Yang H, Liu Y, Bai F, et al. Tumor development is associated with decrease of TET gene expression and 5-methylcytosine hydroxylation. Oncogene. 2013;32:663–669.
- Hsu C-H, Peng K-L, Kang M-L, et al. TET1 suppresses cancer invasion by activating the tissue inhibitors of metalloproteinases. Cell Rep. 2012;2:568–579.
- Good CR, Panjarian S, Kelly AD, et al. TET1-mediated hypomethylation activates oncogenic signaling in triple-negative breast cancer. Cancer Res. 2018;78:4126–4137.
- Bibikova M, Barnes B, Tsan C, et al. High density DNA methylation array with single CpG site resolution. Genomics. 2011;98:288–295.
- Zheng Y, Joyce BT, Liu L, et al. Prediction of genome-wide DNA methylation in repetitive elements. Nucleic Acids Res. 2017;45:8697–8711.
- Cancer Genome Atlas N. Comprehensive molecular portraits of human breast tumours. Nature. 2012;490:61–70.
- Colaprico A, Silva TC, Olsen C, et al. TCGAbiolinks: an R/Bioconductor package for integrative analysis of TCGA data. Nucleic Acids Res. 2016;44:e71.
- Irizarry RA, Ladd-Acosta C, Wen B, et al. The human colon cancer methylome shows similar hypo- and hypermethylation at conserved tissue-specific CpG island shores. Nat Genet. 2009;41:178–186.
- Sandoval J, Heyn H, Moran S, et al. Validation of a DNA methylation microarray for 450,000 CpG sites in the human genome. Epigenetics. 2011;6:692–702.
- Smit A, Hubley R, Green P. RepeatMasker open-4.0. 2013–2015. Available from: http://wwwrepeatmaskerorg
- Durinck S, Spellman PT, Birney E, et al. Mapping identifiers for the integration of genomic datasets with the R/Bioconductor package biomaRt. Nat Protoc. 2009;4:1184–1191.
- Salas LA, Johnson KC, Koestler DC, et al. Integrative epigenetic and genetic pan-cancer somatic alteration portraits. Epigenetics. 2017;12:561–574.
- Assenov Y, Muller F, Lutsik P, et al. Comprehensive analysis of DNA methylation data with RnBeads. Nat Methods. 2014;11:1138–1140.
- Du P, Zhang X, Huang CC, et al. Comparison of Beta-value and M-value methods for quantifying methylation levels by microarray analysis. BMC Bioinformatics. 2010;11:587.
- Triche TJ Jr., Weisenberger DJ, Van Den Berg D, et al. Low-level processing of illumina infinium DNA methylation bead arrays. Nucleic Acids Res. 2013;41:e90.
- Fortin JP, Labbe A, Lemire M, et al. Functional normalization of 450k methylation array data improves replication in large cancer studies. Genome Biol. 2014;15:503.
- Chen YA, Lemire M, Choufani S, et al. Discovery of cross-reactive probes and polymorphic CpGs in the illumina infinium human Methylation450 microarray. Epigenetics. 2013;8:203–209.
- Ritchie ME, Phipson B, Wu D, et al. limma powers differential expression analyses for RNA-sequencing and microarray studies. Nucleic Acids Res. 2015;43:e47.
- Houseman EA, Accomando WP, Koestler DC, et al. DNA methylation arrays as surrogate measures of cell mixture distribution. BMC Bioinformatics. 2012;13:86.
- Houseman EA, Kelsey KT, Wiencke JK, et al. Cell-composition effects in the analysis of DNA methylation array data: a mathematical perspective. BMC Bioinformatics. 2015;16:95.
- Titus AJ, Gallimore RM, Salas LA, et al. Cell-type deconvolution from DNA methylation: a review of recent applications. Hum Mol Genet. 2017;26:R216–R24.