
ABSTRACT
Identification of cancer-specific methylation of DNA released by tumours can be used for non-invasive diagnostics and monitoring. We previously reported in silico identification of DNA methylation loci specifically hypermethylated in common human cancers that could be used as epigenetic biomarkers. Using DNA methylation specific qPCR we now clinically tested a group of these cancer-specific loci on cell-free DNA (cfDNA) extracted from the plasma fraction of blood samples from healthy controls and non-small cell lung cancer (NSCLC) patients. These DNA methylation biomarkers distinguish lung cancer cases from controls with high sensitivity and specificity (AUC = 0.956), and furthermore, the signal from the markers correlates with tumour size and decreases after surgical resection of lung tumours. Presented observations suggest the clinical value of these DNA methylation biomarkers for NSCLC diagnostics and monitoring. Since we successfully validated the biomarkers using independent DNA methylation data from multiple additional common carcinoma cohorts (bladder, breast, colorectal, oesophageal, head and neck, pancreatic or prostate cancer) we predict that these DNA methylation biomarkers will detect additional carcinoma types from plasma samples as well.
Introduction
Cancer is one of the most common causes of death worldwide and lung cancer is responsible for the highest percentage of mortality among all cancers [Citation1]. Earlier diagnosis of cancer or its recurrence [Citation2] may allow earlier intervention and could improve management of the disease [Citation3]. Frequent screening for cancer or monitoring of cancer patients can be improved using minimally invasive and cost-effective diagnostic techniques based on tumour specific biomarkers from blood samples or other liquid biopsies [Citation4,Citation5]. Blood contains a small amount of cell-free DNA (cfDNA) that can be recovered from plasma or serum samples and is mostly fragmented to a single nucleosome size. In cancer patients, cfDNA contains circulating tumour DNA (ctDNA) derived from tumours [Citation6–Citation8]; the ctDNA fraction varies based on tumour type and disease progression [Citation9–Citation11]. The ctDNA fraction may be substantial, resulting in the overall increase of cfDNA amount in cancer cases [Citation6]. Specific identification of ctDNA within cfDNA samples can be used for sensitive cancer detection, including the early stages of the disease; it can also allow for sensitive monitoring of the residual disease after intervention. Tumour DNA differs from normal cell DNA in several aspects that allow specific detection of ctDNA [Citation4,Citation5]; these include tumour specific mutations, altered DNA copy numbers and DNA methylation. Diagnostic techniques based on the next-generation sequencing or quantitative PCR (qPCR) can identify these tumour specific alterations in cfDNA samples from cancer patients [Citation10,Citation12–Citation14]. Overall, specific identification of tumour derived ctDNA in cfDNA samples from blood or other liquid biopsies can be used for minimally invasive diagnosis and monitoring of cancer.
The fundamental differences between DNA from normal and tumour cells could be found in the epigenome represented by tumour specific changes in DNA methylation [Citation15–Citation17]. DNA methylation is an optional covalent epigenetic modification of cytosine residues in the CpG sequence context [Citation18,Citation19]. Cell-type-specific DNA methylation patterns help to determine and keep cellular identity of normal cells while tumour cells have profoundly altered epigenome [Citation8,Citation20–Citation26] with two kinds of differences in DNA methylation. First, the cancer cells improperly co-opt some of the DNA methylation specific for normal cells of different types [Citation27]; e.g. the presence of mesenchymal cell-type-specific DNA methylation in carcinomas may be indicative of epithelial-to-mesenchymal transition (EMT) [Citation21,Citation28]; however, this is not suitable as a cancer-specific biomarker since it is released into cfDNA also from normal mesenchymal cells and would result in a false-positive diagnosis. Second, the cancer cells contain many loci with aberrant DNA methylation changes that do not occur in any normal cells and such loci are suitable for specific detection of ctDNA in cfDNA samples from plasma or other liquid biopsies. DNA methylation specific qPCR [Citation29] is sensitive enough to detect the presence of even few methylated copies of ctDNA in a typical cfDNA sample [Citation12,Citation13]. In addition, qPCR is relatively quick and inexpensive. Since tumours have aberrantly methylated many DNA regions [Citation24–Citation26], the detection of tumour specific DNA methylation could be performed in multiple genomic loci; this increases the sensitivity of the technique. In summary, the detection of tumour specific DNA methylation in cfDNA from liquid biopsies could be used for diagnosis and monitoring of cancer; the technique would be sensitive, relatively quick and cost effective while minimally invasive.
Several studies regarding the discovery or testing of cancer-specific DNA methylation biomarkers to detect cancer from various body fluids have been published in recent years. These include markers or marker sets to detect e.g. lung [Citation30–Citation35], breast [Citation12,Citation13], colorectal [Citation36,Citation37] or pancreatic [Citation38] cancers. A few DNA methylation cancer biomarkers are already in clinical use, e.g. SEPT9 [Citation39] to identify colorectal cancer from plasma samples or GSTP1 [Citation40] to detect prostate cancer from urine or blood samples. Most of these studies use qPCR or digital droplet PCR (ddPCR) analysis of a single marker locus or several marker loci. Some other recent studies are based on the analysis of whole cfDNA methylomes [Citation8,Citation14,Citation41]; although these studies generate large amounts of data valuable for basic research, whole cfDNA methylome approaches are less suitable for clinical testing since the procedures are relatively costly and time consuming. Overall, multiple studies about the detection of cancer using analysis of DNA methylation of cfDNA samples have been published, most of them are based on qPCR testing of a single marker or set of several markers; this indicates general functionality of the above-outlined principle.
We previously published a study that identified a large suite of cancer-specific DNA methylation biomarker loci that can detect the most common human cancer types [Citation42]. Our study utilized Illumina HumanMethylation450 data from over 10,000 tumour and normal samples from The Cancer Genome Atlas (TCGA) and Gene Expression Omnibus (GEO) databases. We reported 1,250 marker CpG loci specifically hypermethylated in at least one of 33 TCGA tumour types. We also described optimal sets of marker loci for each TCGA cancer type that could identify most tumours of the particular type and a universal set of 12 markers that can detect tumours of most TCGA cancer types [Citation42]. Testing of selected marker sets on independent GEO data, including data from a different analytical platform, confirmed their ability to distinguish tumours from normal tissues with high sensitivity and specificity.
The purpose of the current study was to clinically test a set of these DNA methylation biomarkers on blood samples from cancer patients and healthy controls. We selected an optimal set of 10 markers that identify tumours of 10 common carcinomas. This marker set performs well (AUC 0.97–1.0) on all independent GEO data cohorts of tumour and normal samples tested during in silico validation. We then used methylation-specific qPCR to analyse DNA methylation of these marker loci in cfDNA samples from non-small cell lung cancer (NSCLC) patients (cases) and healthy volunteers (controls). The DNA methylation signal from the markers was able to distinguish between lung cancer cases and controls with high sensitivity and specificity (AUC = 0.956). Furthermore, the signal from the markers depends on the tumour size and decreases after surgical resection of lung tumours. The entire analytical procedure is inexpensive and could be accomplished within 2 days after blood is collected. We demonstrate here that the marker set can detect the presence of cancer in the plasma of NSCLC patients; based on our validation results from other cancers we predict that these markers will perform well on additional cancer types as well.
Results
A set of 10 DNA methylation biomarkers that detect common carcinomas including NSCLC (, ) with high sensitivity and specificity was selected from our previously published suite of 1,250 DNA methylation biomarkers [Citation42]. This optimized set of 10 marker loci (, ) was first tested using independent epigenomic data from the GEO database. Eight GEO tumour sample cohorts (total n = 1,471) representing the 10 TCGA carcinoma types () were tested against normal blood GEO samples (n = 310) as well as respective normal tissue (NT) GEO samples (total n = 571) (Table S1, ). The results confirm that this 10 marker set can identify, with high sensitivity and specificity (blood reference: AUC 0.987–1.0; respective normal tissue reference: AUC 0.972–1.0), all carcinoma types it was designed for (). In summary, we have chosen the optimal marker set to detect tumour specific DNA methylation in NSCLC and additional common carcinomas and verified that these markers can distinguish tumour derived DNA from DNA originating from normal cells.
Figure 1. (a) A flowchart of the study, (b) A human ideogram showing chromosomal locations of DNA methylation biomarkers.
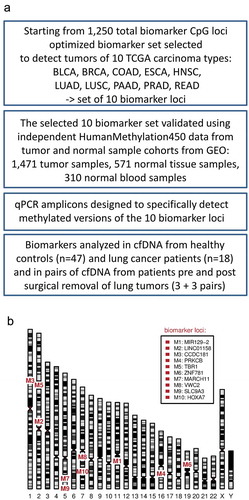
Figure 2. Validation of the DNA methylation biomarker set on independent cancer sample cohorts from the GEO. Normal whole blood cohort (GSE72773) and respective normal tissues (NT) were used as controls. The plots show DNA methylation of the marker set in individual tumour samples in comparison to normal blood samples and respective NT samples. The samples were classified as tumours or normal based on the metadata from GEO. The x-axis indicates individual samples. The y-axis shows cumulative beta values for the entire marker set and the individual markers in the set are distinguished by colours. The DNA methylation data from the normal blood cohort are shown only in the first panel and are represented in the additional panels by the horizontal dashed lines showing the 95th percentile of the cumulative DNA methylation of the normal blood cohort. The horizontal dotted lines indicate the 95th percentiles of the cumulative DNA methylation of the respective NT cohorts. The AUCs were calculated using the cumulative beta values for the entire marker set for each sample from the respective tumour cohort and the normal blood cohort or respective NT as a normal reference for each cancer type.
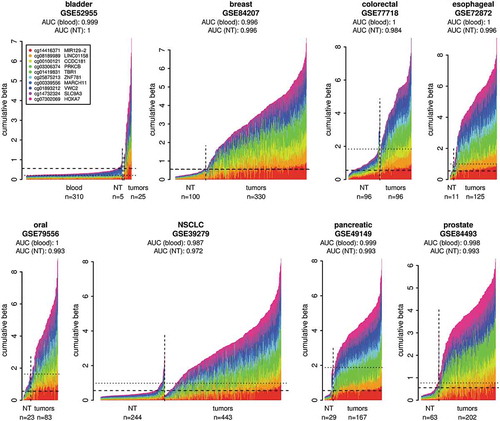
Table 1. The list of 10 TCGA cancer types for which the marker set was designed including GEO cancer cohort names that were used for validation.
Table 2. The list of 10 DNA methylation biomarkers. CpG.ID is a specific identification of CpG from Illumina HumanMethylation450 microarray platform, CpG position indicates the physical address of CpG in human genome assembly hg19, and the annotation indicates an overlapping or nearby located gene.
Quantitative PCR specific to methylated marker regions was chosen in order to detect very small amounts of methylated ctDNA found in cfDNA samples. Ten qPCR primers and probe sets were designed to specifically amplify bisulphite converted DNA and to detect the marker region only when it is methylated as is the case of tumour specific ctDNA (, Table S2). The size of the amplicons was selected to be as short as possible (Table S2) to perform well on the fragmented templates like cfDNA. To reduce stochastic effects of low numbers linked to low amounts of methylated ctDNA templates in cfDNA samples a two-step qPCR reaction was adopted as the analytical strategy. In the first step, the methylated DNA template is pre-amplified in a multiplex reaction using cocktail of all primer pairs. The product from the first step is then diluted and used in individual standard qPCR reactions to quantify individual markers (Fig S1). In this approach, even the ctDNA templates present only in a few copies can be detected since all the templates are pre-amplified before the samples are divided into individual amplicon-specific reactions for quantification. In summary, we have chosen a rapid, inexpensive, and well-established analytical strategy to detect DNA methylation of marker loci in plasma cfDNA samples.
Using the above-described approach, we analysed cfDNA from healthy donors and NSCLC patients. The cfDNA was extracted from plasma samples of 47 healthy volunteers and 18 NSCLC patients (). While cfDNA from healthy donors shows relatively low background DNA methylation across the marker set, the NSCLC patient samples show a higher overall level of the DNA methylation signal and a substantial fraction of the patients show high-level DNA methylation across a majority of the markers (, Fig S2A). Fifteen of 18 patients (83%) have DNA methylation signal higher than the 95th percentile of the control group (Fig S2A); this indicates sensitivity 83% at 95% specificity. The distribution of the mean DNA methylation signal from all markers in the group of NSCLC patients (cases) is highly significantly different (p-value = 1.6x10⁻⁸) from the signal in the group of healthy individuals (controls) (). The median methylation per marker is about 29-fold higher in the cases than in the controls (), which is about 6 methylated marker copies per ml of plasma in cases vs 0.2 copies in controls (Fig S2B). The ROC analysis using the 47 controls and 18 cases revealed quite large area under the curve (AUC = 0.956) with 95% confidence interval 0.906–1.0 (). These findings illustrate that the marker set and the adopted detection technique are able to distinguish between the plasma from healthy individuals and the plasma from lung cancer cases with high sensitivity and specificity.
Figure 3. The DNA methylation biomarker set differentiates between NSCLC cases and healthy controls with high sensitivity and specificity. (a) Mean DNA methylation signal per marker of the full 10 marker set for the control group of 47 healthy volunteers and for the group of 18 NSCLC cases. P-value shown is for Wilcoxon rank sum test. (b) The receiver operating characteristic (ROC) analysis of the marker set signal from 47 controls and 18 NSCLC cases. AUC – area under the curve, CI – confidence interval.
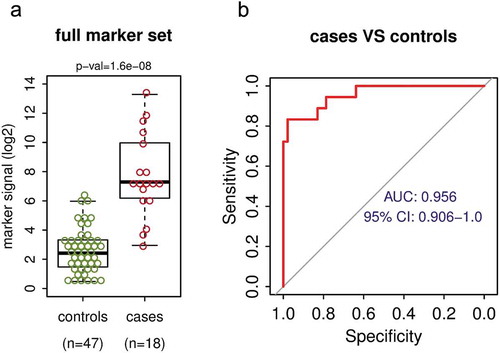
Table 3. The basic clinical characteristics of NSCLC patients (cases) and healthy volunteers (controls) whose plasma was used in the study.
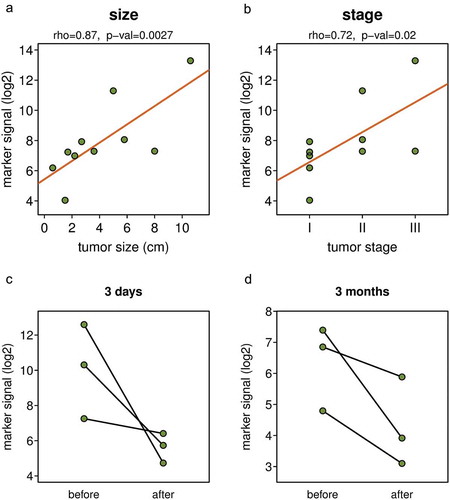
Since the DNA methylation signal detected by the marker set varied among individual NSCLC patients (), we tested if there is a correlation between the tumour size or disease stage and the signal of the biomarkers. We found a strong positive correlation between the tumour size and the marker signal () and also between the disease stage and the marker signal (). The observed strongest correlation of the marker signal (rho = 0.87) with the size of the tumour is consistent with the quantitative nature of the assay; the larger the tumour, the more ctDNA is shed into bloodstream. To further test if the DNA methylation signal detected by the marker set depends on the presence of a tumour in the body, we analysed pairs of plasma samples from patients where samples taken before the surgical resection of lung tumours and those collected either 3 days or 3 months after surgery were available. Despite the limited number of sample pairs, there was a clear trend towards substantially lower DNA methylation signal obtained from post-surgery samples; the level of decrease varied greatly from about twofold to several hundred folds (). The larger decreases in the level of marker signal were observed in cases where the initial DNA methylation signal was higher because the removed tumours were larger. This is again consistent with the quantitative nature of the assay. In summary, these observations indicate that the DNA methylation signal detected by the biomarkers depends on the presence of a tumour in the body and its size and that this non-invasive procedure could potentially be used for monitoring cancer patients for persistent disease and recurrence after surgical resection of the lung cancer.
Figure 4. The DNA methylation biomarker signal depends on tumour size and disease stage and decreased after tumour removal. Correlation between the DNA methylation marker signal and tumour size (a) and disease stage (b). DNA marker methylation in pairs of blood samples collected before surgical resection of tumour, and three days (c) or three months (d) after the tumour resection. Y axis shows mean DNA methylation signal per marker of the full ten marker set.
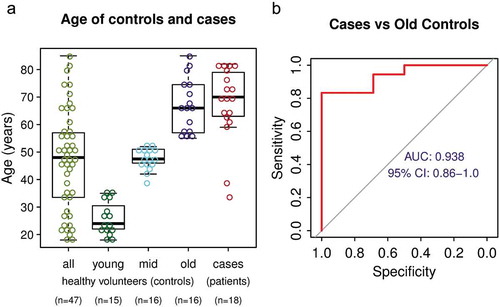
We analysed the performance of the individual DNA methylation biomarkers and effects of age on biomarker signal. We first evaluated each marker separately using the same sample cohorts of 47 controls and 18 NSCLC cases. The AUC for the individual markers ranged from 0.694 to 0.929 (Fig S3), this is less than the full marker set and it indicates benefit of combining multiple markers. We found no sex-related differences in DNA methylation status of any individual markers in healthy control participants (Fig S4). Since DNA methylation changes with age [Citation43,Citation44], we analysed the relation between the biomarker DNA methylation levels and the age of 47 healthy subjects. As expected, some of the markers have increased in methylation with age (Fig S5). On average the background DNA methylation signal per marker increased about 2.5 fold between healthy subject of ages 25 years and 75 years (Fig S5), this is much lower difference than the 29 fold increase in cancer patients compared to healthy controls (). Nonetheless, this observation has to be taken into account when using DNA methylation markers in general for diagnostic purposes. Therefore, we tested the performance of the biomarker set using only the oldest third of the control cohort (n = 16, 55–85 YO) that has age distribution similar to the case cohort (), and even in this case, the marker signal separated well NSCLC patients from controls (AUC = 0.938, , Fig S6). Overall, although the background methylation of the markers increases with age, the markers are able to differentiate between NSCLC cases and older healthy control subjects with high sensitivity and specificity.
Figure 5. The effect of age on DNA methylation biomarker performance (a) Age distribution of the entire control cohort, control cohort split into three sub-cohorts by age and NSCLC patient cohort. (b) ROC analysis of the performance of the marker set using only the oldest third of healthy volunteers as control.
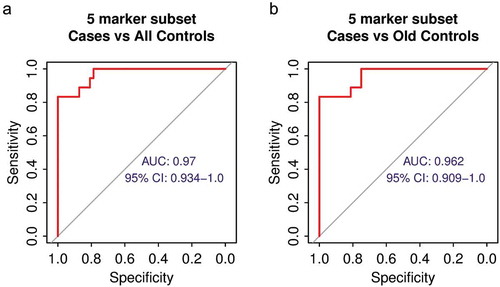
Elimination of some biomarkers will further improve the performance of the biomarker set. Since the full biomarker set was designed to detect 10 different carcinoma types, we predicted that there would be subsets of markers within the full 10 marker set that will provide superior performance in individual carcinoma types. Therefore, we performed ROC analysis on all possible combinations of subsets of all 10 markers using 18 NSCLC cases and either the whole control cohort (n = 47) or the oldest control sub-cohort (n = 16) as healthy references. We found a five marker subset that can separate cases from controls with AUC = 0.97 (0.934–1.0) using the whole control cohort and AUC = 0.962 (0.909–1.0) using the oldest control sub-cohort as healthy references (), respectively. In both cases, this is a better performance than the full 10 marker set (AUC = 0.956, , AUC = 0.938, , respectively). Although the current NSCLC cases cohort is too small to select the final marker subset to be used for diagnostic purposes, this finding indicates that the performance of the biomarkers could be further improved by using data from only a specific marker subset.
Figure 6. The improved performance of a five biomarker subset. (a) ROC analysis of the performance of the five marker subset using all healthy volunteers as control. (b) ROC analysis of the performance of the five marker subset using only the oldest third of healthy volunteers as control.
Discussion
This study demonstrated that DNA methylation markers discovered through mining public databases were able to identify cancer from plasma of NSCLC patients. The data show highly significant differences in the level of DNA methylation of the marker loci between plasma cfDNA from NSCLC patients and control subjects. Furthermore, the signal from the markers depends on tumour size and decreases over time after definitive surgical resection of NSCLC, adding validity to the diagnostic value of the markers.
The marker set can distinguish between plasma from NSCLC cases and controls with high sensitivity and specificity. The marker performance on clinical cfDNA samples (, AUC 0.956) is not much lower than the performance on GEO data (, AUC 0.972–0.987). This is a solid result considering that the GEO data (GSE39279) [Citation45] were independent cohorts of tumour and normal tissue or blood samples analysed by the same microarray platform that was used in the marker discovery [Citation42], while our qPCR technique has to detect the small fraction of ctDNA in the clinical plasma samples in a background of normal DNA. Since the entire DNA methylation marker set was designed for multiple cancer types, we tested if there are any individual markers or marker subsets with better performance in the setting of NSCLC. Although each individual marker did not reach the performance level of the full marker set, there was a subset of five markers with even better performance than the full set of 10 markers (, AUC 0.97). There are likely two reasons for this; first, not every marker is fully methylated in every tumour and, second, the combination of multiple markers increases the probability of detection of the small ctDNA fraction in cfDNA samples. On the other hand, some of the markers in the full set are less frequently methylated in NSCLC than in other cancers and therefore the elimination of those markers may increase the performance of the marker set. It is likely that different subsets of the markers will be optimal for other cancer types. Overall, the performance of our minimally invasive analytical technique on cfDNA samples is comparable to the performance of Illumina microarray platform on pure tumour and normal tissues.
We found moderate increase in DNA methylation of the marker loci with age of the control subjects. The DNA methylation changes in both directions with age [Citation43,Citation44]. Since our marker set was designed to be unmethylated in healthy tissues and hypermethylated in tumours, the only possible direction of change in older healthy subjects was an increase in DNA methylation. This increase is small, more than an order of magnitude lower than the levels measured in cancer subjects, and therefore does not diminish the diagnostic value of the markers; nonetheless, this has to be taken into account when determining marker signal thresholds for diagnostic purposes.
The entire analytical procedure is relatively simple and could be performed using standard instrumentation. The required 2 ml of plasma for analysis can be obtained from a routine whole blood sample and therefore the technique is minimally invasive. After cfDNA extraction and sodium bisulphite conversion using commercially available kits, the technique involves two rounds of PCR; these can be performed on conventional PCR and qPCR instruments, respectively. The whole procedure could be accomplished by a single person within 2 days after the blood collection using conventional laboratory equipment and qPCR reagents. In summary, the technique is minimally invasive, simple, sensitive, fast and cost effective.
Although we demonstrated the performance of the marker set on NSCLC samples, the markers were designed to detect 10 TCGA cancer types (). We have shown here that the markers perform well on plasma samples from NSCLC patients (), a cancer type responsible for the highest mortality among malignancies[Citation1] and for which a companion diagnostic biomarker may meaningfully improve the sensitivity and specificity of CT screening for early detection of NSCLC. Since the validation of the marker set using GEO microarray data was successful for all cancer types (AUC 0.972–1.0, ) we predict that the marker set will be able to detect those additional cancers, as long as respective tumours shed ctDNA into plasma cfDNA. Our preliminary data on a limited amount of cfDNA samples from some other cancer types indicate that the markers will be able to detect e.g. pancreatic adenocarcinoma, a cancer with the highest mortality rate among malignancies[Citation1]. The samples from additional subjects are currently analysed and as the data from more cases and controls will be available it will allow diagnostic thresholds to be determined. In conclusion, we present DNA methylation biomarker set and analytical technique that will improve minimally invasive diagnosis and monitoring of NSCLC and may be tested in the same manner across multiple cancer types.
Materials and methods
The marker set selection
The marker set that identifies most tumours of 10 TCGA cancer types was selected from a suite of the 1,250 hypermethylated marker CpGs we published before [Citation42]. Only the 10 TCGA cancer types most relevant for our studies were used in the selection algorithm instead of all possible TCGA cancer types used before. The selection process was run until the marker set contained for each of 10 cancer types at least four markers that passed all the filters [Citation42] (Fig S7) resulting in a set of 10 markers (). The marker loci were annotated by the RefSeq gene symbol of the overlapping gene or by the gene within 5 kbp of the marker locus regardless the direction.
The validation of the marker set using GEO data
The Illumina HumanMethylation450 DNA methylation data for 8 cancer types, representing 10 TCGA cancer types, and respective normal tissues as well as a large normal blood cohort (Table S1) were downloaded from the GEO database (https://www.ncbi.nlm.nih.gov/geo/). None of these data were used in the previous study for marker discovery, filtering or validation. All data were analysed in the R programming environment [Citation46] using custom scripts. DNA methylation data from the Illumina HumanMethylation450 platform are presented as beta values – numeric values in interval 0.0–1.0. For unmethylated CpGs the beta value approaches zero, for fully methylated CpGs beta approaches 1 and for CpGs methylated in a fraction of the sample 0< beta<1, e.g. a CpG methylated in 50% of the sample will have a beta value of approximately 0.5. The beta values were first normalized as described [Citation42]. The performance of the marker set was then evaluated using ROC analysis on cumulative beta values for all 10 markers and the large blood sample cohort (n = 310, GSE72773) or respective normal tissue cohort (Table S1) as cancer-free references. The ROC analysis and AUC calculations were performed using the R library pROC [Citation47].
qPCR amplicon design
Ten qPCR amplicons specific for the marker loci and three control amplicons were designed. The marker amplicons were selected to overlap or be as close as possible to the marker CpGs determined by the Illumina HumanMethylation450 microarray (). In addition to 10 marker amplicons, 3 qPCR amplicons specific for universally methylated loci that serve as cfDNA load controls were designed (Table S2). The pairs of primers and the probes for all qPCR amplicons were designed to be specific for the methylated sodium bisulphite treated DNA. The size of the amplicons was designed to be as short as possible (60–90 bp) to perform well on the fragmented cfDNA template (Table S2). Primers and probes were designed to overlap at least 7 CpGs combined (at least two CpGs each, closer to the 3’ end for primers) to be specific only for the methylated template. Where possible, probes from the Human Universal Probe Library Set (Roche Diagnostics, Indianapolis, IN, USA) were utilized, otherwise custom probes with 5’ 6-FAM – 6-carboxyfluorescein and 3’ Iowa Black® FQ labels were designed. The primers and the custom probes were manufactured by Integrated DNA Technologies (Coralville, IA, USA).
Clinical blood samples
The studied population () consisted of 18 NSCLC patients and 47 healthy volunteers recruited between 2018 and 2019 at the University of Arizona, Tucson, Arizona, USA. Institutional Review Board Approval No 1,803,355,376 was obtained prior to the study initiation and all patients and healthy volunteers signed the informed consent. The cancer cohort consisted of stage I-III NSCLC patients (), here the blood draws were performed before surgical resection of tumours and some of these patients had follow up draws either 3 days or 3 months after the surgery. In addition, cancer cohort contained several stage IV (metastatic) NSCLC patients () that were undergoing various forms of treatment at the time of blood draw. All cases had pathologically confirmed non-small cell lung cancer at the time of blood draw.
Blood sample processing and cfDNA extraction
Whole blood was collected in Streck cell-free DNA BCT tubes (La Vista, NE), and stored for no longer than 3 days at room temperature until processing. Collection of plasma was done by spinning the BCT tubes at 1,600 g for 10 min at room temperature, the plasma fraction was then transferred to 2 ml microfuge tubes. The plasma was then spun at 16,000 g for 10 min at room temperature to remove residual cellular debris. The plasma was then carefully transferred to a new 2 ml microfuge tube and stored at −80°C. cfDNA was extracted from 2 ml of plasma using Qiagen QIAamp Circulating Nucleic Acid Kit according to the manufacturer’s instructions, eluted in 50 µl into low bind tubes (1.7 ml Microtube (Maximum Recovery) Cat#22-281LR, Olympus Plastics, Genesee Scientific, El Cajon, CA) and stored at −80°C.
Two-step qPCR
The whole amount of cfDNA from 2 ml of plasma was sodium bisulphite (BS) treated using EZ DNA Methylation-Gold Kit (Zymo Research, Irvine, CA, USA) according to the manufacturer’s instructions and eluted in 20 µl of water into low bind tubes. First-round PCR amplification was performed in a 50 µl reaction volume using 25 µl of PerfeCta qPCR SuperMix Low ROX (Quanta Biosciences, Gaithersburg, MD, USA), 5 µl of 10x mix of all amplicon primers (final concentration 385 nM each primer) and 20 µl of BS converted cfDNA. The reaction conditions were denaturation at 95°C for 3 min, and then 15 cycles of 95°C for 15 s, 57°C for 30 s, and 72°C for 30 s. The reaction product was then diluted 200-fold and used in the second-step qPCR. The qPCR mixture consisted of 10 µl of PerfeCta qPCR SuperMix Low ROX,500 nM each amplicon-specific primer, 200 nM amplicon-specific probe and 5 µl of the 200-fold diluted product from the first step in a 20 µl total reaction volume. The qPCR was conducted on ABI Prism 7500 Sequence Detection System (Applied Biosystems, Foster City, CA, USA), the reaction conditions were 95°C denaturation for 3 min followed by 50 cycles of 95°C for 15 s and 60°C for 45 s.
qPCR data analysis
The threshold cycles (Cts) for individual markers were determined using fixed marker-specific thresholds to keep consistency between individual qPCR runs. Although the qPCR was run for 50 cycles the data generated after 40 cycles were not adding additional resolution between the groups and therefore undetermined Cts or Cts higher than 40 were set to 40. The data were then converted by a formula 40 – Ct. This way Ct 40 was set as a background (zero) and the values that are still in log2 transformed scale but are increasing with the level of DNA methylation specific signal were obtained. These values for all markers or the means of these values for all markers or marker subsets were used in the plots and ROC analysis. Since the DNA methylation signal from markers spans several orders of magnitude, nonparametric tests were used to test differences between the groups (Wilcoxon rank sum test) or correlation between variables (Spearman’s rank correlation coefficient). The optimal marker subset was determined by running ROC analysis for all possible 1023 marker combinations and selecting a marker subset with the largest AUC. Due to the overall increase in cfDNA amount in the post-surgery samples, the DNA methylation signal for was normalized for cfDNA load using the mean signal from the three universally methylated control amplicons listed in Table S2. Normal human blood DNA (20 ng, 1:1 mix of male and female, Promega, G147A, G152A) spiked with 1% of DNA from MDA-MB231 cancer cell line, that has all marker loci fully methylated, was used as a positive control. The signal from the positive control was also used to estimate the amount of methylated marker copies per ml of plasma.
Supplemental Material
Download PDF (1.9 MB)Acknowledgments
The results shown here are in part based upon data generated by the TCGA Research Network: http://cancergenome.nih.gov/. We are grateful to Ms. Laura Duckett for assistance with consenting and blood collection. We thank all the anonymous blood sample donors, both lung cancer patients and healthy volunteers, who made this study possible.
Disclosure statement
M. Nelson and B. Futscher are Co-founders of DesertDx, LLC.
Supplementary material
Supplemental data for this article can be accessed here.
Additional information
Funding
Related Research Data
References
- Bray F, Ferlay J, Soerjomataram I, et al. Global cancer statistics 2018: GLOBOCAN estimates of incidence and mortality worldwide for 36 cancers in 185 countries. CA Cancer J Clin. 2018;68:394–424.
- Mahvi DA, Liu R, Grinstaff MW, et al. Local cancer recurrence: the realities, challenges, and opportunities for new therapies. CA Cancer J Clin. 2018;68:488–505.
- Schiffman JD, Fisher PG, Gibbs P. Early detection of cancer: past, present, and future. Am Soc Clin Oncol Educ Book. 2015;3:57–65.
- Schwarzenbach H, Hoon DSB, Pantel K. Cell-free nucleic acids as biomarkers in cancer patients. Nat Rev Cancer. 2011;11:426–437.
- Wan JCM, Massie C, Garcia-Corbacho J, et al. Liquid biopsies come of age: towards implementation of circulating tumour DNA. Nat Rev Cancer. 2017;17:223–238.
- Leon SA, Shapiro B, Sklaroff DM, et al. Free DNA in the serum of cancer patients and the effect of therapy. Cancer Res. 1977;37:646–650.
- Snyder MW, Kircher M, Hill AJ, et al. Cell-free DNA comprises an in vivo nucleosome footprint that informs its tissues-of-origin. Cell. 2016;164:57–68.
- Moss J, Magenheim J, Neiman D, et al. Comprehensive human cell-type methylation atlas reveals origins of circulating cell-free DNA in health and disease. Nat Commun. 2018;9:5068.
- Bettegowda C, Sausen M, Leary RJ, et al. Detection of circulating tumor DNA in early- and late-stage human malignancies. Sci Transl Med. 2014;6:224ra24.
- Diehl F, Li M, Dressman D, et al. Detection and quantification of mutations in the plasma of patients with colorectal tumors. Proc Natl Acad Sci U S A. 2005;102:16368–16373.
- Jahr S, Hentze H, Englisch S, et al. DNA fragments in the blood plasma of cancer patients: quantitations and evidence for their origin from apoptotic and necrotic cells. Cancer Res. 2001;61:1659–1665.
- Fackler MJ, Lopez Bujanda Z, Umbricht C, et al. Novel methylated biomarkers and a robust assay to detect circulating tumor DNA in metastatic breast cancer. Cancer Res. 2014;74:2160–2170.
- Uehiro N, Sato F, Pu F, et al. Circulating cell-free DNA-based epigenetic assay can detect early breast cancer. Breast Cancer Res. 2016;18:129.
- Shen SY, Singhania R, Fehringer G, et al. Sensitive tumour detection and classification using plasma cell-free DNA methylomes. Nature. 2018;563:579–583.
- Kulis M, Esteller M. DNA methylation and cancer. Adv Genet. 2010;70:27–56.
- Feinberg AP, Ohlsson R, Henikoff S. The epigenetic progenitor origin of human cancer. Nat Rev Genet. 2006;7:21–33.
- Sina AA, Carrascosa LG, Liang Z, et al. Epigenetically reprogrammed methylation landscape drives the DNA self-assembly and serves as a universal cancer biomarker. Nat Commun. 2018;9:4915.
- Esteller M, Herman JG. Cancer as an epigenetic disease: DNA methylation and chromatin alterations in human tumours. J Pathol. 2002;196:1–7.
- Bird AP. CpG-rich islands and the function of DNA methylation. Nature. 1986;321:209–213.
- Kim M, Costello J. DNA methylation: an epigenetic mark of cellular memory. Exp Mol Med. 2017;49:e322.
- Futscher BW, Oshiro MM, Wozniak RJ, et al. Role for DNA methylation in the control of cell type specific maspin expression. Nat Genet. 2002;31:175–179.
- Vrba L, Garbe JC, Stampfer MR, et al. Epigenetic regulation of normal human mammary cell type-specific miRNAs. Genome Res. 2011;21:2026–2037.
- Heyn H, Esteller M. DNA methylation profiling in the clinic: applications and challenges. Nat Rev Genet. 2012;13:679–692.
- Novak P, Jensen T, Oshiro MM, et al. Agglomerative epigenetic aberrations are a common event in human breast cancer. Cancer Res. 2008;68:8616–8625.
- Rauch TA, Zhong X, Wu X, et al. High-resolution mapping of DNA hypermethylation and hypomethylation in lung cancer. Proc Natl Acad Sci U S A. 2008;105:252–257.
- Shames DS, Girard L, Gao B, et al. A genome-wide screen for promoter methylation in lung cancer identifies novel methylation markers for multiple malignancies. PLoS Med. 2006;3:e486.
- Irizarry RA, Ladd-Acosta C, Wen B, et al. The human colon cancer methylome shows similar hypo- and hypermethylation at conserved tissue-specific CpG island shores. Nat Genet. 2009;41:178–186.
- Vrba L, Jensen TJ, Garbe JC, et al. Role for DNA methylation in the regulation of miR-200c and miR-141 expression in normal and cancer cells. PLoS One. 2010;5:e8697.
- Eads CA, Danenberg KD, Kawakami K, et al. MethyLight: a high-throughput assay to measure DNA methylation. Nucleic Acids Res. 2000;28:E32.
- Hulbert A, Jusue-Torres I, Stark A, et al. Early detection of lung cancer using DNA promoter hypermethylation in plasma and sputum. Clin Cancer Res. 2017;23:1998–2005.
- Nunes SP, Moreira-Barbosa C, Salta S, et al. Cell-free DNA methylation of selected genes allows for early detection of the major cancers in women. Cancers (Basel). 2018;10:357.
- Ostrow KL, Hoque MO, Loyo M, et al. Molecular analysis of plasma DNA for the early detection of lung cancer by quantitative methylation-specific PCR. Clin Cancer Res. 2010;16:3463–3472.
- Wielscher M, Vierlinger K, Kegler U, et al. Diagnostic performance of plasma DNA methylation profiles in lung cancer, pulmonary fibrosis and COPD. EBioMedicine. 2015;2:929–936.
- Ooki A, Maleki Z, Tsay JJ, et al. A panel of novel detection and prognostic methylated DNA markers in primary non-small cell lung cancer and serum DNA. Clin Cancer Res. 2017;23:7141–7152.
- Weiss G, Schlegel A, Kottwitz D, et al. Validation of the SHOX2/PTGER4 DNA methylation marker panel for plasma-based discrimination between patients with malignant and nonmalignant lung disease. J Thorac Oncol. 2017;12:77–84.
- Lange CP, Campan M, Hinoue T, et al. Genome-scale discovery of DNA-methylation biomarkers for blood-based detection of colorectal cancer. PLoS One. 2012;7:e50266.
- Barault L, Amatu A, Siravegna G, et al. Discovery of methylated circulating DNA biomarkers for comprehensive non-invasive monitoring of treatment response in metastatic colorectal cancer. Gut. 2018;67:1995–2005.
- Kisiel JB, Raimondo M, Taylor WR, et al. New DNA methylation markers for pancreatic cancer: discovery, tissue validation, and pilot testing in pancreatic juice. Clin Cancer Res. 2015;21:4473–4481.
- Grutzmann R, Molnar B, Pilarsky C, et al. Sensitive detection of colorectal cancer in peripheral blood by septin 9 DNA methylation assay. PLoS One. 2008;3:e3759.
- Lee WH, Isaacs WB, Bova GS, et al. CG island methylation changes near the GSTP1 gene in prostatic carcinoma cells detected using the polymerase chain reaction: a new prostate cancer biomarker. Cancer Epidemiol Biomarkers Prev. 1997;6:443–450.
- Kang S, Li Q, Chen Q, et al. CancerLocator: non-invasive cancer diagnosis and tissue-of-origin prediction using methylation profiles of cell-free DNA. Genome Biol. 2017;18:53.
- Vrba L, Futscher BW. A suite of DNA methylation markers that can detect most common human cancers. Epigenetics. 2018;13:61–72.
- Heyn H, Li N, Ferreira HJ, et al. Distinct DNA methylomes of newborns and centenarians. Proc Natl Acad Sci U S A. 2012;109:10522–10527.
- Horvath S, Raj K. DNA methylation-based biomarkers and the epigenetic clock theory of ageing. Nat Rev Genet. 2018;19:371–384.
- Sandoval J, Mendez-Gonzalez J, Nadal E, et al. A prognostic DNA methylation signature for stage I non-small-cell lung cancer. J Clin Oncol. 2013;31:4140–4147.
- Team RC. R: A Language and environment for statistical computing. Vienna, Austria: R Foundation for Statistical Computing; 2018.
- Robin X, Turck N, Hainard A, et al. pROC: an open-source package for R and S+ to analyze and compare ROC curves. BMC Bioinformatics. 2011;12:77.