
ABSTRACT
The majority of methylome-wide association studies (MWAS) have been performed using commercially available array-based technologies such as the Infinium Human Methylation 450K and the Infinium MethylationEPIC arrays (Illumina). While these arrays offer a convenient and relatively robust assessment of the probed sites they only allow interrogation of 2-4% of all CpG sites in the human genome. Methyl-binding domain sequencing (MBD-seq) is an alternative approach for MWAS that provides near-complete coverage of the methylome at similar costs as the array-based technologies. However, despite publication of multiple positive evaluations, the use of MBD-seq for MWAS is often fiercely criticized. Here we discuss key features of the method and debunk misconceptions using empirical data. We conclude that MBD-seq represents an excellent approach for large-scale MWAS and that increased utilization is likely to result in more discoveries, advance biological knowledge, and expedite the clinical translation of methylome-wide research findings.
Introduction
Whole genome bisulfite sequencing (WGB-seq), where following bisulfite conversion, the entire genome is sequenced to assess the methylation status of each methylation site, is often considered the ‘gold standard’ in DNA methylation research. As WGB-seq remains too costly for large scale research projects, the majority of methylome-wide association studies (MWAS) have been performed using commercially available array-based technologies such as the Infinium Human Methylation 450 K and the Infinium MethylationEPIC arrays (Illumina) that assay 450 K and 850 K CpG sites respectively. These array technologies also rely on bisulfite conversion of the DNA, but rather than sequencing the entire genome, they utilize predesigned probes for selected methylation sites. While these arrays offer a convenient and relatively robust assessment of the probed sites they only allow interrogation of 2-4% of all CpG sites in the human genome.
Methyl-binding domain sequencing (MBD-seq) is an alternative approach for MWAS (see for a schematic overview) that provides near-complete coverage of the CpG methylome at similar costs as the array-based technologies [Citation1–Citation3]. However, despite this highly desirable property MBD-seq is often fiercely criticized. As the selection of a good assay is key for a successful MWAS, we here discuss key features, including limitations, of MBD-seq and debunk frequent misconceptions using empirical evidence.
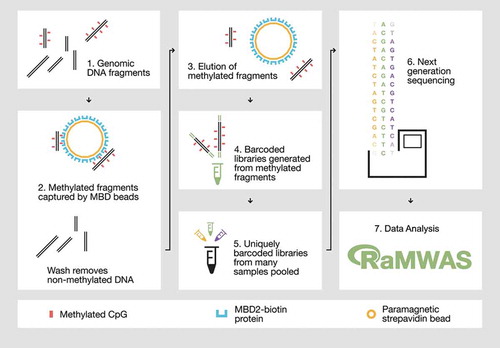
Figure 1. Overview of the MBD-seq workflow.
Step 1) Genomic DNA is randomly fragmented with ultrasonication. Step 2) Methylated fragments are captured by a protein with high affinity for double-stranded DNA harbouring methylated CpGs. Unmethylated DNA fragments are washed away. Step 3) The captured portion of the methylome is eluted. Step 4) The methylation enriched fraction (the elute) is used to generate barcoded sequencing libraries. Step 5) Barcoded libraries are pooled in equal molarities. 6) The library pool is sequenced and aligned to the reference genome. Step 7) The aligned reads are analysed with suitable software such as RaMWAS that was specifically developed for large-scale methyome-wide association studies.
Results and discussion
MBD-seq requires a carefully optimized protocol – TRUE
Part of the negative perception of MBD-seq may have arisen from the use of insufficiently optimized lab-technical protocols likely resulting in inefficient enrichment, which in turn leads to poor CpG coverage. Several commercially available kits for methyl-binding domain enrichment are available that mainly differ in the proteins used for enrichment. Due to its high affinity and specificity for methylated CpGs on double-stranded DNA, the human methyl-binding domain 2 (MBD2) protein [Citation4] has proven efficient for robust methylation capture with minimal background noise [Citation1]. Using components of the MethylMiner™ kit (Invitrogen), which utilizes the MBD2 protein, we have further carefully optimized the lab-technical protocol [Citation2,Citation5] resulting in robust and high-quality methylation data that can be generated with very small amounts of genomic DNA as starting material [Citation5]. With this optimized protocol, decreasing the input of genomic DNA to 15 ng did not significantly lower the quality of the methylation data. With amounts of starting material in the range of 5–10 ng some loss in quality was observed [Citation5]. This can be compared with 250 ng – 1 ug genomic DNA, which typically is the recommended amount of starting material for the commonly used array-based methylation profiling protocols. The optimized MBD-seq protocol can be performed manually or on standard liquid handling robotic platforms, which allows for flexible scalability for MWAS.
The optimized protocol involves several critical adaptions [Citation2,Citation5]. For example, to ensure consistent and efficient enrichment, it is essential to maintain the ratio of DNA to MBD-capture beads at an optimal level (0.02 uL of prepared MBD-seq beads per 1 ng of DNA input, which corresponds to 7 ng protein per ng DNA) for all investigated samples [Citation5]. These precise adjustments paired with high-stringency washes ensure an efficient enrichment of the methylated fraction of the genome that can be used for downstream high-throughput sequencing. The full details of the optimized MBD-seq protocol can be obtained from https://bpm.pharmacy.vcu.edu/resources/.
MBD-seq is equivalent to MeDIP-seq – FALSE
Another likely reason for the negative perception, may be that MBD-seq is frequently confused with methylated DNA immunoprecipitation followed by sequencing (MeDIP-seq) [Citation6]. While there are similarities in the workflow, MBD-seq and MeDIP-seq are distinctly different from one another. MeDIP-seq utilizes antibody-based affinity capture which is not specific for CpG methylation and requires single stranded DNA. Previous reports show MeDIP-seq suffers from lower performance and higher sequence bias than MBD-seq [Citation2,Citation7–Citation10]. This observed bias implicate the intrinsic properties of anti-methylcytosine antibodies used in MeDIP-seq for its deficits.
MBD-seq is comparable in cost to commonly used methylation arrays – TRUE
The methylation enriched fraction can be sequenced with any configuration but short single end reads are preferred for optimal resolution and decreased costs. To correctly estimating the amount of methylation at any specific locus it is critical to know the fragment size distribution for each sample. With single end reads the fragment size distribution is not observed, but can be empirically estimated from reads covering isolated CpGs (i.e., CpGs far away from other CpGs) as described in detail previously [Citation11,Citation12]. In short, for each isolated CpG locus, the empirical estimation utilizes information about the distances between every read start and the positions of isolated CpGs to estimate the fragment size length. By assessing this distance for all reads located in proximity to isolated CpGs the distribution of the fragment lengths can be estimated. Thus, using short single-end reads is the most cost-effective way to sequence the methylation-enriched fraction. With this configuration the reagent cost of MBD-seq (assuming a standard set up of 60 million 75 bp single-end reads) is comparable to the cost of the commonly used methylation arrays and result in a very large cost saving compared to whole-genome bisulfite sequencing (MBD-seq would only need to sequence 5.2% of the bases sequenced with whole-genome bisulfite sequencing at a standard 30X coverage).
The resolution of MBD-seq is poor – FALSE
Whereas bisulfite assays yield methylation estimates (percentage) for each individual site, enrichment methods quantify the total amount of methylation (sum) at a locus. This quantitative methylation measure is referred to as a CpG-score (previously also called CpG coverage) [Citation11,Citation12]. The size of the loci are equal to, or less than, the captured fragment sizes. The more reads that are present in a locus the greater resolution can be obtained. In the worst case scenario where two CpGs are on the opposite end of the fragment, and only one fragment cover the region, the size of the detectable locus would be equal to the fragment size (~150 bp). Indeed, this lack of single base resolution may reduce the resolution of association signals. However, the resolution of MBD-seq is still high on a genomic scale and generally provides sufficient resolution for MWAS.
It should be noted that even though WGB-seq will provide single base resolution in principle, the methylation status of neighbouring CpGs tend to be highly correlated [Citation13]. This is particularly true in regions with multiple CpGs. Using WGB-seq data [Citation2], plots observed correlations between neighbouring CpGs as a function of their distance from one another. The figure shows that correlations between CpGs located within the fragment-sized interval as detected by MBD-seq are often highly correlated. For example, the pairwise correlation between CpGs that are 150 bp apart and have 9 other CpGs in between them (lag 10 in ) is on average 0.92. Therefore, akin to linkage disequilibrium in SNP studies, which creates a biological barrier to fine mapping, it may often be impossible to greatly improve the resolution of MBD-seq even using bisulfite methods. For directly adjacent CpG (lag 1) that are 150 bp from one another the average pairwise correlation is above 0.45. However, in these situations the sparsity of the CpGs, involving only one or a few CpGs per fragment, still allows for specific CpGs to be pinpointed and thus the MBD-seq resolution is not drastically affected.
Figure 2. Correlation between nearby located CpGs.
Using WGB-seq data [Citation2] the estimated correlation (y-axis) is plotted against the distance (bp) between CpGs. The typical resolution range (150 bp) of MBD-seq is indicated by the horizontal bar at the top of the graph. The pairwise correlation between neighbouring CpG with lag 10 (the correlation between CpG 1 and CpG 11; CpG 2 and CpG 12 etc.) and lag 1 (the correlation between CpG 1 and CpG 2; CpG 2 and CpG 3 etc.) is represented by a dashed and a solid line, respectively.
![Figure 2. Correlation between nearby located CpGs.Using WGB-seq data [Citation2] the estimated correlation (y-axis) is plotted against the distance (bp) between CpGs. The typical resolution range (150 bp) of MBD-seq is indicated by the horizontal bar at the top of the graph. The pairwise correlation between neighbouring CpG with lag 10 (the correlation between CpG 1 and CpG 11; CpG 2 and CpG 12 etc.) and lag 1 (the correlation between CpG 1 and CpG 2; CpG 2 and CpG 3 etc.) is represented by a dashed and a solid line, respectively.](/cms/asset/2cd98d71-28c0-409b-8874-98bcad311085/kepi_a_1695339_f0002_oc.jpg)
Nonetheless, if single base resolution is ultimately desired, low-cost targeted bisulfite-based methods can be used for follow-up of top MBD-seq findings. Such a study design, which is recommended, results in screening virtually all CpGs in the methylome where single-base resolution is subsequently obtained for the most interesting loci.
Only CpG methylation can be detected with MBD-seq – TRUE
MBD-seq is specific for CpG methylation (mCG). Thus, it will not identify methylation outside the sequence context of CG (mCH) nor hydroxymethylation (hmC). For most human tissues, where > 99.9% of all methylation is mCG [Citation14], the lack of detection of other methylation types is not a concern. However, the human brain contains substantial levels of both mCH and hmC [Citation15] in addition to mCG. To investigate these methylation types in the context of an association study, MBD-seq can be complemented with enrichment approaches for mCH (MBD-DIP [Citation2]) and hmC (hMe-Seal [Citation16]).
Only a small portion of the CpGs in the genome are investigated – FALSE
Misconceptions suggesting that only a small portion of the CpGs in the genome are assayed with MBD-seq likely arise from studies using sub-optimal enrichment protocols that are indeed typically biased towards the relatively small portion of the genome where individual methylation sites are highly methylated and the density of CpGs is high. However, when using a properly optimized MBD-seq protocol [Citation2,Citation5] nearly all CpGs in the methylome are interrogated, even including a significant proportion of methylated isolated CpGs (CpGs located more than a fragment length away from any other CpG), which constitute 2.4% of the CpGs in the genome and are the most challenging CpGs to detect with enrichment methods. More specifically, following exclusion of sites located in regions that are challenging to align [Citation17] 27,551,768 autosomal CpGs are assessed with the optimized MBD-seq protocol. Using data from duplicates of WGB-seq as a reference, the proportion of methylated sites correctly detected as methylated by MBD-seq (i.e., the relative sensitivity of MBD-seq) was 0.94 with comparable levels of specificity (the proportion of non-methylated sites correctly detected) [Citation2]. In other words, 94% of all sites that showed evidence of being methylated with WGB-seq were also observed to be methylated with MBD-seq.
The number of sites assayed with MBD-seq is in stark contrast to the ~850,000 of sites assayed with the Infinium MethylationEPIC array – the latest version of the Illumina methylation array. Even assuming that every probe on this array detects methylated sites with perfect fidelity, the maximum sensitivity of the array relative to WGB-seq is about 0.03, meaning that only ~3% of methylation sites observed with WGB-seq can possibly be studied with current array-based approaches.
MBD-seq does not provide quantitative information – FALSE
Because the number of reads covering a CpG is proportional to the level of methylation occurring in its locus, CpG scores [Citation11,Citation12] estimated from MBD-seq are quantitative. However, MBD-seq does not yield absolute methylation levels (e.g., we cannot say that a specific locus is 80% methylated). Although methods have been developed to estimate absolute levels of methylation from enrichment data [Citation18,Citation19] we do not recommend attempting such normalization for MWAS. Since MWAS test statistics are based on standardized differences between groups at the same locus, relative measures of methylation status leads to the same results as an analysis of absolute methylation levels. Thus, the normalization is not necessary for association testing.
To illustrate the quantitative property of MBD-seq we correlated it with total amounts of methylation at fragment sized loci estimated from WGB-seq data in human brain [Citation2]. Considering all CpGs in the genome, we estimated that the correlation between MBD-seq and WGB-seq data ranges from 0.73 to 0.86 (average correlation 0.79, SD = 0.045) [Citation2,Citation5]. As mentioned, whereas MBD-seq only assays mCG, WGB-seq estimates are confounded by hmC that is found at > 15% of modified CpGs in human brain [Citation3,Citation15]. Thus, the correlations reported were calculated after subtracting the amount of hmC, as detected by TET-assisted bisulfite sequencing, from WGB-seq [Citation5]. The estimated agreement is therefore a robust but conservative lower bound of the correlation.
Sequence coverage should follow standards for bisulfite sequencing – FALSE
In WGB-seq studies that estimate the percentage of methylation at single CpGs, the number of reads covering each base and the error rate in the base calls are the critical determinants of the precision of the methylation estimates. For example, if a base is sequenced at 10Xcoverage in WGB-seq its methylation level can be estimated in 10% increments since methylation status at a CpG is binary for any given DNA molecule.
However, in enrichment-based sequencing, coverage itself is the methylation measurement, where precision is determined by the total number of sequenced fragments. The higher the methylation level is at a given site (i.e., the percentage of cells in which the site is methylated) the more likely it is to be captured by the MBD-protein pulldown. Thus, after standardizing on the total number of reads, which is an arbitrary factor controlled by the researcher, individuals with higher methylation levels at a specific locus will obtain more reads than an individual with low methylation levels at the same locus. At the other extreme, CpG sites that are unmethylated in all cells are not captured during the pulldown and thus not represented in the sequencing library. The lack of coverage for these unmethylated CpGs is therefore expected and is not a consequence of poor sequencing performance.
For this approach to distinguish between methylated loci versus non-methylated loci it is critical that fragments with methylated sites are pulled down and that fragments without methylated sites are not. Thus, rather than the average number of reads covering CpGs, the critical quality control parameter is the enrichment efficiency [Citation12]. Enrichment efficiency can be measured by the ratio of the average score at locations that cannot be methylated because they do not contain CpGs (so called nonCpGs) and the average coverage at CpGs [Citation11].
For example, in a recent large-scale MWAS of blood samples from 1,132 individuals [Citation20] we obtained an average of 59.4 million (SD = 11.2 million) reads per sample. This resulted in an average nonCpG-to-CpG score ratio [Citation12] of 0.010 (SD = 0.005). The low ratio shows that the average CpG signal is high and the nonCpG background noise level is exceptionally low, allowing for detection of differently methylated regions. Note that because not all CpGs are methylated this ratio is an underestimate of the enrichment efficiency.
MBD-seq and WGB-seq provide comparable information about the methylome – TRUE
MBD-seq and WGB-seq provide highly comparable information about the methylome. To illustrate this we use methylation data from sorted neurons and glia isolated from human brain [Citation2]. visualizes the differences in methylation detected by WGB-seq, MBD-seq and MeDIP-seq between the two cell types along the length of an entire chromosome ()). Results show that profiles are generally similar across platforms. However, robust regions of cell-type specific differential methylation were more faithfully detected by MBD-seq as compared to MeDIP-seq ()). ) also shows the location of probes from the often-used HM450K Illumina methylation array that assays ~450,000 CpGs. The presence of array probes in these regions of critical biological importance is very poor.
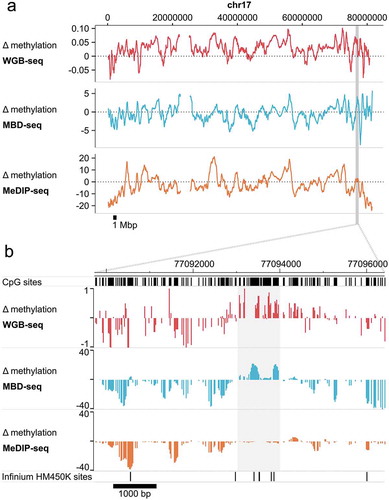
Figure 3. MBD-seq and WGB-seq provide comparable methylome profiles.
Difference (Δ) in methylation between neurons and glia along chromosome 17. Methylation was assayed in sorted neurons and glia from a human brain sample by WGB-seq, MBD-seq, and MeDIP-seq. Positive values indicate higher methylation in neurons. (a) Chromosome-wide trace of neuron-glia differences in methylation along chr17. To facilitate visualization the 10 kb simple moving average of Δ methylation is plotted. Highlighted region indicates the location of the enlarged region displayed in the lower pane. (b) Enlarged region along chr17:77,090,000–77,096,500 (hg19) displaying focal Δ methylation between neurons-glia. Highlighted region indicates the location of cell-type-specific differential methylation that is detected in WGB-seq and MBD-seq, but not MeDIP-seq. Locations of Infinium HumanMethylation 450K sites are also shown for illustration.
For another illustration we used MBD-seq data and WGB-seq data from bulk brain tissue from the same DNA sample [Citation2] and showed that the two data types have very similar methylation profiles across genomic features. After classifying loci as methylated versus non-methylated, we calculated odds ratios to study whether sites located in a variety of genomic features were more likely to be methylated compared to sites not in this feature. The results presented in showed that the methylation profiles were very similar for both methods across a variety of biological features. Overall, these results suggested that both technologies capture comparable information about the methylome.
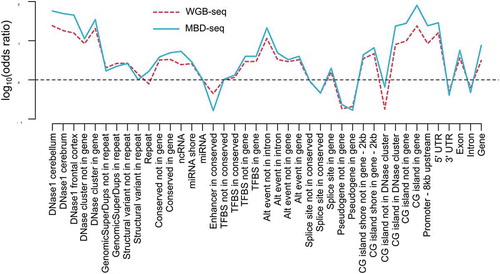
Figure 4. Genomic enrichment profiles across biological features are comparable for MBD-seq and WGB-seq.
Methylation profiles across genomic features. The red line represents WGB-seq and the blue line MBD-seq enrichment profiles. The x-axis show the genomic feature tested and the y-axis the log10 of the odds ratio calculated from the 2 by 2 tables where loci were classified as methylated versus non-methylated and genomic features as present versus absent.
Suitable analysis tool for sequencing-based MWAS data is available – TRUE
A further reason for the lack of enthusiasm surrounding MBD-seq may be the poor understanding for how the intrinsic features of the data affect analysis and interpretation. As for all association analysis, proper analysis of MBD-seq data requires screening and controlling for technical artefacts. This includes potential batch effects embedded in any workflow, the numbers of high quality reads for each sample methylation profile, as well as an estimate of the enrichment efficiency and sensitivity referred to as the ‘peak’ [Citation12]. Without considering this enrichment peak in the analysis, cross-sample comparisons will likely be heavily biased. Controlling for such artefacts is not unique to MBD-seq data. Recent publications suggest that controlling for technical artefacts [Citation21–Citation24] is also critical for array-based studies. For example, both ‘chip’ and ‘row’ location have been shown to introduce effects to array data, which if not controlled for, may introduce spurious association findings to the published literature.
The recent availability of RaMWAS [Citation12], an analysis tool specifically developed to take advantage of the unique features of MBD-seq data, provides an efficient tool for analysis of methylation data. In comparisons with the main alternative software QSEA [Citation19], RaMWAS outperformed the alternative [Citation12] and allows users to effectively process, quality control and analyse the very large amounts of data that is generated for sequencing-based MWAS. Although the RaMWAS tool was specifically designed to handle MBD-seq data it also provides an effective solution for studies of other data types including array-based methylation data.
Conclusion
In conclusion, MBD-seq is a high fidelity sequencing-based approach for MWAS that allows for interrogation of 94% of the methylated CpGs detected by WGB-seq, at comparable costs as the commonly used methylation arrays. The approach has already successfully been used in several methylation investigations [Citation3,Citation20,Citation25–Citation27]. By dispelling common misunderstandings surrounding the method, we hope that more investigators choose to take advantage of key strengths of MBD-seq in their own research. In our opinion, increased utilization is likely to result in more discoveries, advance biological knowledge, and expedite the clinical translation of methylome-wide research findings.
Disclosure statement
No potential conflict of interest was reported by the authors.
Additional information
Funding
References
- Aberg KA, Xie L, Chan RF, et al. Evaluation of methyl-binding domain based enrichment approaches revisited. PLoS One. 2015;10(7):e0132205.
- Chan RF, Shabalin AA, Xie LY, et al. Enrichment methods provide a feasible approach to comprehensive and adequately powered investigations of the brain methylome. Nucleic Acids Res. 2017 Jun 20;45(11):e97.
- Serre D, Lee BH, Ting AH. MBD-isolated genome sequencing provides a high-throughput and comprehensive survey of DNA methylation in the human genome. Nucleic Acids Res. 2010 Jan;38(2):391–399.
- Fraga MF, Ballestar E, Montoya G, et al. The affinity of different MBD proteins for a specific methylated locus depends on their intrinsic binding properties. Nucleic Acids Res. 2003 Mar 15;31(6):1765–1774.
- Aberg KA, Chan RF, Shabalin AA, et al. A MBD-seq protocol for large-scale methylome-wide studies with (very) low amounts of DNA. Epigenetics. 2017 Sep;12(9):743–750.
- Weber M, Davies JJ, Wittig D, et al. Chromosome-wide and promoter-specific analyses identify sites of differential DNA methylation in normal and transformed human cells. Nat Genet. 2005 Aug;37(8):853–862.
- Bock C, Tomazou EM, Brinkman AB, et al. Quantitative comparison of genome-wide DNA methylation mapping technologies. Nat Biotechnol. 2010 Oct;28(10):1106–1114.
- Nair SS, Coolen MW, Stirzaker C, et al. Comparison of methyl-DNA immunoprecipitation (MeDIP) and methyl-CpG binding domain (MBD) protein capture for genome-wide DNA methylation analysis reveal CpG sequence coverage bias. Epigenetics. 2011 Jan;6(1):34–44.
- Moreland B, Oman K, Curfman J, et al. Methyl-CpG/MBD2 interaction requires minimum separation and exhibits minimal sequence specificity. Biophys J. 2016 Dec 20;111(12):2551–2561.
- Lentini A, Lagerwall C, Vikingsson S, et al. A reassessment of DNA-immunoprecipitation-based genomic profiling. Nat Methods. 2018 Jul;15(7):499–504.
- van Den Oord EJ, Bukszar J, Rudolf G, et al. Estimation of CpG coverage in whole methylome next-generation sequencing studies. BMC Bioinformatics. 2013 Feb 12;14(1):50.
- Shabalin AA, Hattab MW, Clark SL, et al. RaMWAS: fast methylome-wide association study pipeline for enrichment platforms. Bioinformatics. 2018Feb;34(13):2283–2285.
- Lee JH, Park SJ, Nakai K. Differential landscape of non-CpG methylation in embryonic stem cells and neurons caused by DNMT3s. Sci Rep. 2017 Sep 12;7(1):11295.
- Lister R, Pelizzola M, Dowen RH, et al. Human DNA methylomes at base resolution show widespread epigenomic differences. Nature. 2009;462(7271):315.
- Lister R, Mukamel EA, Nery JR, et al. Global epigenomic reconfiguration during mammalian brain development. Science (New York, NY). 2013;341(6146):1237905.
- Song C-X, Szulwach KE, Fu Y, et al. Selective chemical labeling reveals the genome-wide distribution of 5-hydroxymethylcytosine. Nat Biotechnol. 2010;29:68.
- Aberg KA, McClay JL, Nerella S, et al. MBD-seq as a cost-effective approach for methylome-wide association studies: demonstration in 1500 case-control samples. Epigenomics. 2012 Dec;4(6):605–621.
- Down TA, Rakyan VK, Turner DJ, et al. A Bayesian deconvolution strategy for immunoprecipitation-based DNA methylome analysis. Nat Biotechnol. 2008 Jul;26(7):779–785.
- Lienhard M, Grasse S, Rolff J, et al. QSEA-modelling of genome-wide DNA methylation from sequencing enrichment experiments. Nucleic Acids Res. 2017 Apr 7;45(6):e44.
- Aberg KA, Dean B, Shabalin AA, et al. Methylome-wide association findings for major depressive disorder overlap in blood and brain and replicate in independent brain samples. Mol Psychiatry. 2018 Sep;21. [Epub ahead of print].
- Harper KN, Peters BA, Gamble MV. Batch effects and pathway analysis: two potential perils in cancer studies involving DNA methylation array analysis. Cancer Epidemiol Biomarkers Prev. 2013 Jun;22(6):1052–1060.
- Buhule OD, Minster RL, Hawley NL, et al. Stratified randomization controls better for batch effects in 450K methylation analysis: a cautionary tale. Front Genet. 2014;5:354.
- Nygaard V, Rodland EA, Hovig E. Methods that remove batch effects while retaining group differences may lead to exaggerated confidence in downstream analyses. Biostatistics. 2016 Jan;17(1):29–39.
- Price EM, Robinson WP. Adjusting for batch effects in DNA methylation microarray data, a lesson learned. Front Genet. 2018;9:83.
- Nagy C, Suderman M, Yang J, et al. Astrocytic abnormalities and global DNA methylation patterns in depression and suicide. Mol Psychiatry. 2015 Mar;20(3):320–328.
- Aberg KA, McClay JL, Nerella S, et al. Methylome-wide association study of schizophrenia: identifying blood biomarker signatures of environmental insults. JAMA Psychiatry. 2014 Mar;71(3):255–264.
- Han LKM, Aghajani M, Clark SL, et al. Epigenetic aging in major depressive disorder. Am J Psychiatry. 2018 Aug 1;175(8):774–782.