
ABSTRACT
Metabolic syndrome (MetS) is a cluster of cardiometabolic risk factors for all-cause mortality, cardiovascular disease, and cancer. Identifying epigenetic alterations associated with MetS in African Americans (AAs) and Whites may provide insight into genes that influence its differential health outcomes. We examined DNA methylation (DNAm) and performed an epigenome-wide association study (EWAS) of MetS among AAs and Whites with and without MetS. We assessed age, race and poverty status associated DNAm among AAs (n = 225) and White (n = 233) adults using NCEP-ATP III guidelines. Genome-wide DNAm measurement was assessed using Illumina Infinium Methylation EPIC BeadChip. Differentially methylated positions (DMPs) and differentially methylated regions (DMRs) were identified using dmpFinder and bumphunter. EWAS was performed using CpGassoc. We found significant DMPs associated with age, poverty status and MetS in each race. GSTT1(Glutathione S-Transferase Theta 1) was one of the top-hypermethylated genes and MIPEP (Mitochondrial Intermediate Peptidase) was one of the most hypomethylated genes when comparing AAs with and without MetS. PPP1R13L (Protein Phosphatase 1 Regulatory Subunit 13 Like) was the top hypermethylated and SCD (stearoyl-CoA desaturase-1) was one of the most hypomethylated genes for Whites with and without MetS. EWAS results showed that DNAm differences might contribute to MetS risk among Whites and AAs since different genes were identified in AAs and Whites. We replicated previously identified MetS associated genes and found that Thioredoxin-interacting protein (TXN1P) was statistically significantly differentially expressed only in Whites. Our results may be useful in further studies of genes underlying differences in MetS among AAs and Whites.
Introduction
Metabolic Syndrome (MetS) a cluster of three or more cardiometabolic risk factors including elevated triglycerides, central adiposity, reduced high-density lipoprotein (HDL) cholesterol, hypertension, and elevated fasting plasma glucose [Citation1] is an important signature symptom complex associated cardiovascular and cancer morbidity and mortality. MetS is becoming more prevalent with increasing obesity prevalence and thereby imposing a noticeable burden on the health-care system [Citation2]. MetS is emerging as an important public health problem not only in the United States but also internationally. In Europe, 25% of adults have MetS [Citation3]. According to the National Health and Nutrition Examination Survey (NHANES), the overall prevalence of MetS in adults (aged 18 and older) in the United States during the years 1988–2012 was 34.2% [Citation4], present in approximately a third of the US population or around 68 million individuals [Citation5]. MetS prevalence increases with age; approximately 50% of Americans over 50 years of age have MetS [Citation6]. There are also racial and ethnic differences in prevalence. Non-Hispanic black women were more likely than non-Hispanic White women to have MetS [Citation4]. The prevalence of MetS increased between 1988 and 2012 for both men and women in the US; however, the most noticeable increase has been among non-Hispanic black men. MetS prevalence increased by 55% among non-Hispanic black males compared to 31% for non-Hispanic White men and 12.5% for Hispanic men [Citation4].
MetS portends increased risk for chronic disease and mortality. The most well-known link is between MetS and incidence of cardiovascular disease. However, there are clearly established links between MetS and increased risk of chronic kidney disease, diabetes mellitus, arthritis, schizophrenia, non-alcoholic fatty liver disease and multiple types of cancer. MetS is associated with a greater risk of mortality, with a 2-fold increased risk for cardiovascular events or death, and an 1.8-fold increased risk of mortality [Citation7,Citation8]. The connection between MetS and diseases that have disproportionate incidence, prevalence and mortality among minority and poor poulations makes it a critically important entity to examine it in the context of health disparities. Potential common mechanisms behind MetS and its associated diseases include mitochondrial dysfunction, inflammation, microbial alterations, environmental and drug effects [Citation9]. The social determinants of health [Citation10] including low educational attainment and poverty are important risk factors for MetS as well as race and ethnicity [Citation11]. Environmental factors also influence risk for MetS. These include: urbanization, the built environment and workplace environment [Citation12–Citation16]. In addition, genetic factors are also implicated in MetS [Citation11].
The increasing prevalence of MetS and its negative impact on overall health status has led to a resurgence of investigations examining the underlying biologic mechanisms. One of the major gaps in our knowledge remains the interaction of genetic and epigenetic factors that underlie MetS. Among the genetic factors influencing MetS, epigenetic factors such as DNA methylation may play a key role. DNA methylation (DNAm) is an epigenetic mechanism through which a methyl group is added to the carbon 5 of a cytosine pyrimidine ring next to a guanidine nucleotide, which is commonly called a CpG residue. This forms a 5-methyl cytosine leading to changes and modifications in gene expression without altering the underlying DNA sequence [Citation17]. Recent advances have suggested that MetS is a programmable disease and epigenetic modifications due to DNAm can be used as an effective biomarker [Citation18]. Therefore, identification of alterations due to DNAm may provide understanding about the potential mechanism through which MetS influence the gene expression and ultimately increase chronic disease risk and mortality [Citation19].
Although several studies identified alterations in DNAm that may influence MetS and its components [Citation19,Citation20], how racial differences influence the prevalence of MetS and biological mechanisms underlying these racial disparities remain unclear. Therefore, identification of DNAm alterations associated with MetS that are race-specific may provide insight into the genes that influence differential health outcomes. The main goal of our study is to examine DNAm signatures measured across the genome associated with MetS using DNA from urban dwelling AA and White adult participants in the Healthy Ageing in Neighbourhoods of Diversity across the Life Span (HANDLS) study.
Materials and methods
Subjects and sample collections
Samples included in the present study are from the HANDLS study cohort initiated in 2004 (https://handls.nih.gov/). HANDLS is a prospective population-based longitudinal study with a fixed cohort of 3,720 community-dwelling AA and White participants between 30 and 64 years of age [Citation21]. The recruited participants were from 13 pre-determined neighbourhoods (contiguous census tracts) in the city of Baltimore selected using area probability sampling based on the 2000 US Census. The sampling frame for the overall study is a four-way factorial cross of age, sex, race, and socioeconomic status indexed by poverty status (with a reported household income below or above 125% of the Federal Poverty Guidelines for 2004). All participants provided written informed consent. The HANDLS study is approved by the National Institute of Environmental Health Sciences (NIEHS) Institutional Review Board (Protocol number: 09-AG-N248).
Study inclusion
The present study involves the samples collected at the baseline of the study, between August 2004 to March 2009 for which DNA methylation data were available. Of the 3,720 baseline participants (mean ± SD age(y): 48.6 ± 8.7), there were 508 participants who were previously selected by randomly sampling the cohort using a factorial design across race, sex, and poverty status to permit analysis of possible interactions among these sociodemographic factors (Figure S1). From these 508 samples, 458 samples passed quality control. We defined MetS using the following criteria suggested by the National Cholesterol Education Program Third Adult Treatment Panel (NCEP ATP III) [Citation22] definition: i) waist circumference (≥ 102 cm for men; ≥ 88 cm for women) ii) blood pressure (≥ 130/85 mmHg) or treatment of previously diagnosed hypertension iii) high-density lipoprotein (HDL) cholesterol (<40 mg/dL for men; <50 mg/dL for women) iv) triglycerides (≥150 mg/dL) v) hyperglycaemia (≥100 mg/dL) or treatment of previously diagnosed type 2 diabetes. The presence of MetS was established as having three or more criteria.
Quantification of DNAm using bisulphite treatment and DNA methylation quantification using the infinium methylation EPIC Beadchip
DNA 250 ng from donor samples were treated with sodium bisulphite using Zymo EZ-96 DNA Methylation kit according to the manufacturer’s protocol (Zymo Research, Orange, CA, USA). For all the kits, we have followed the standard protocols provided by the manufacturer with the suggested input/elution volumes [Citation23]. Subsequently, the samples underwent bisulphate treatment followed by genome-wide DNAm analysis using Illumina Infinium HumanMethylation EPIC BeadChip (EPIC). In the present study, we have used the latest version of EPIC which is a high throughput platform that efficiently quantifies the methylation at 866,836 CpG sites on the human genome [Citation24,Citation25].
Data processing, background correction, and adjustment
Quality control and data preprocessing were performed using the Bioconductor package minfi [Citation26] by loading the respective IDAT files into the package. Data analysis was performed in R by integrating minfi [Citation26], DMRcate [Citation27], limma [Citation28], missMethyl [Citation29], IlluminaHumanMethylation EPICanno.ilm10b2.hg19 [Citation30], and IlluminaHumanMethylationEPICmanifest [Citation31] using raw methylation values. Background correction, dye-bias equalization and normalization of the β scores were performed using the normal-exponential out-of-band (NOOB) correction method [Citation32] in the minifi package. Batch effects from the plate and other potential sources of technical variability in methylation measurements were removed using ComBat [Citation33]. Probes associated with single nucleotide polymorphisms (SNPs) were removed using the function dropLociWithSnps in minfi [Citation26]. This function drops the probes that contain either an SNP at the CpG interrogation or at the single nucleotide extension.
Prediction of significant DMPs
The methylation level based on β values were produced for CpG probe ranging from 0 (the CpG site is unmethylated) to 1 (the CpG site is fully methylated) differentially methylated positions (DMPs) associated with each variable in our study using the function dmpFinder in minfi package [Citation26]. This function tests each genomic position for the association between methylation and a phenotype of interest by testing linear regression for continuous phenotypes and F-test for categorical phenotypes. DMPs predicted from dmpFinder, were prioritized using the criteria described previously [Citation34], i.e., i) a p-value <0.05, i.e., nominally associated with each phenotype of interest (ii) a ∆beta value of ±0.1, i.e., a relatively large differential methylation. Further, differentially methylated regions (DMR) were predicted using the bumphunter function in minfi package [Citation26]. A DMR was defined as a DMP using the following criteria described previously [Citation34], i.e., i) a DMR with a ≥ 2 adjacent CpGs within 1000-bp physical distance ii) adjacent CpGs yielding a ∆beta in the same direction, i.e., all three CpGs in the DMR was consistently hypo- or hyper-methylated.
Differential-methylated interaction hotspots and gene enrichment analysis
To infer interactome modules that represent hotspots of differential DNAm, we used champ.EpiMod function in ChAMP package [Citation35]. The EpiMod algorithm can be run at probe level where the most differentially methylated probe will be assigned to each gene or it can be run at the gene-level where a DNAm value is assigned to each gene using an optimized procedure described previously [Citation36]. The EpiMod algorithm is a functional supervised algorithm version of FEM package which uses only the differential DNAm statistics. Epimod uses a network of relations between genes for identifying the subnetworks where a significant number of genes are associated with a phenotype of interest. Specifically, the weights in the interactome network in our study were constructed from differential DNAm statistics between the participants with and without MetS among AAs and Whites. All the other parameters of the Epimod algorithm were run as shown previously [Citation37,Citation38]. Gene ontology (GO) terms overrepresented in the genes harbouring differentially methylated probes were identified by performing a gene-set enrichment analysis with the number of CpG sites per gene using topGSA function in missMethyl [Citation29] package. GO terms with a false discovery rate (FDR) p-value <0.01 calculated using the method of Benjamini and Hochberg were considered as significant.
Cell-type composition
Generally, analysis of methylated DNA in the context of the cell population may uncover novel gene and environment interactions as well as markers of health and disease [Citation39]. Therefore, we have used the ‘EstimateCellCounts’ function in the minfi Bioconductor package by importing the FlowSorted.Blood.EPIC, a recently developed optimized library for reference-based deconvolution of whole-blood biospecimens to estimate the composition of cell types assayed using the Illumina HumanMethylationEPIC BeadArray [Citation40].
Epigenome-wide association analysis (EWAS)
Multivariable linear regression was used to model the relationship between DNAm levels and MetS. Participants were grouped into two categories (with and without MetS) for both AAs and Whites and coded as a factor (0 and 1) in our model. To check whether the methylation levels associated with MetS were influenced by variables such as age, poverty status and sex, we have included them in the EWAS model to adjust for confounding. The above model was also run with the inclusion of CD8+ and CD4+ T lymphocyte, natural killer cell, B lymphocyte, monocyte and granulocyte cell populations to assess confounding effects. All the models were constructed using the cpg.assoc function in CpGassoc package [Citation41] implemented in R available at http://genetics.emory.edu/conneely. The cpg.assoc function constructs fixed or mixed-effects models between a phenotype of interest and methylation of individual CpG sites across the genome using a matrix or data frame of β-values as input. It assesses significance using different statistical tests including Holm method, false discovery rate (FDR) and permutation procedures [Citation41]. We constructed Manhattan plots to show our epigenome-wide association analysis of MetS and used mixed models to compare methylation of the top CpG sites associated with MetS and adjusted for variables in each race.
MetS associated genes in breast and colon cancer tumour tissues
Because MetS is associated with cancers known to have differential morbidity and mortality among AAs, we investigated whether genes differentially methylated in MetS were also highly methylated in colon and breast tumours in AAs and Whites. Genes identified to be significantly associated with MetS in our HANDLS cohort were queried for methylation status in the publically available NCI Cancer Genome Atlas (TCGA) database for breast and colon cancers. To perform differential analysis, we downloaded the publicly available DNAm data for different cancer types from the TCGA database [Citation42,Citation43]. We performed analysis of TCGA datasets using TCGAbiolinks, an R/Bioconductor package for integrative analysis of the TCGA data which provides different features including facilitating the GDC open-access data retrieval, preparing the data using the appropriate pre-processing strategies, providing the platform to perform different standard analyses and providing several packages for data analysis [Citation44].
Results
Baseline characteristics
To examine whether alterations in DNAm is specific for each race, we obtained peripheral blood mononuclear cells (PBMCs) from the HANDLS participants. There were significant differences in demographic factors such as race and age between the MetS+ and MetS− participants (). Among all participants only 31% (n = 142) had MetS (MetS+), 68.9% (n = 316) did not have MetS (MetS−) with AA being 49.1% and Whites being 50.8% (Figure S1). Among the 225, AAs about 11% met the criteria for MetS whereas, among 233 White adults selected from the HANDLS study, about 20% met the criteria for MetS (Figure S1). In both races, MetS+ participants were older on average compared with MetS− participants with 51 ± 8.4 years and 47.6 ± 8.7 years, respectively. In both races, waist circumference was significantly higher in MetS+ compared with MetS− participants (). In addition, MetS+ participants showed higher levels of triglycerides (127 vs. 81 mg/dL among AA men, 133 vs. 79 mg/dL among AA women; 213 vs. 96 mg/dL among White men, 166 vs. 91 mg/dL among White women), lower levels of HDL cholesterol (37.4 vs. 56.8 mg/dL among AA men, 44.6 vs. 64.5 mg/dL among AA women; 38.4 vs. 48.4 mg/dL among White men, 42.9 vs. 57.6 mg/dL among White women) and higher levels of blood pressure and fasting glucose (117.0 vs. 95.4 mg/dL among AA men, 109.1 vs. 91.9 mg/dL among AA women; 149.1 vs. 95.8 mg/dL among White men, 121.1 vs. 93.2 mg/dL among White women) compared with MetS− participants ().
Table 1. Demographic information of the study participants.
Table 2. Baseline characteristics of HANDLS study participants.
Identification of DMPs associated with MetS, age, poverty status and sex
After completing the quality control, methylation data for 835,642 CpGs were analysed using DMPFinder to identify DMPs associated with variables including MetS, age, poverty status and sex. We used CpG prioritization process to select the most robustly associated DMPs for MetS, age, poverty status and sex by selecting all CpGs yielding a significant p-value <0.01. There were 2,867 DMPs for AA, 1069 (9%) which are unique to AA and 10,926 DMPs for Whites, 9128 (76%) which are unique in Whites with 1798 (15%) DMPs being overalpped between the participants when compared between MetS+ with MetS− participants (). Among the 2,867 DMPs in AAs, 679 (7%) were hypermethylated with top hits being LOC391322 (cg04234412), HLA-C (cg11917734), GYPC (cg22055451), LOC100507073 (cg01235375), HLA-C (cg11574174), LDHC (cg11821245), MAD1L1 (cg16476700), GSTT1 (cg17005068) genes () and 390 (25.1%) were hypomethylated with top hits being CELF4 (cg15355235), MIPEP (cg05755219), FRMD4A (cg26708920), SNTG2 (cg21938029) and FAM197Y2 (cg22028367) (). Of these DMPs, specific for AAs, genes HLA-C (cg11917734), GYPC (cg22055451), MIPEP (cg05755219) and FRMD4A (cg26708920) showed a beta value of ± 0.1. Among the 10,926 DMPs in White population, 8088 (82.4%) were hypermethylated with top hits being C1orf106 (cg10092377), HLA-DQB1 (cg14323910), ACBD5 (cg14240646), EBF4 (cg05825244), KCNQ5 (cg00964035) genes ()) and 1040 (66.9%) were hypomethylated with top hits being C1orf109 (cg24088508), LOC102467223 (cg08050114), SCD (cg09797202), MICAL3 (cg26379583), SMAD2 (cg06161952) ()). Of these DMPs, none of them showed a beta value of ± 0.1.
Figure 1. Volcano plots of differentially methylated positions between MetS and non-MetS in each race (a) DMPs associated with MetS in AAs (b) DMPs associated with MetS in Whites (c) DMPs associated with age in AAs (d) DMPs associated with age in Whites (e) DMPs associated with poverty status in AAs (f) DMPs associated with poverty status in Whites (g) DMPs associated with sex in AAs (f) DMPs associated with sex in Whites. Blue colour dots represent the genes with p-value<0.05. Green colour dots represent the genes with p-value <0.05 and hypermethylated with positive beta values. Red colour dots represent the genes with p-value <0.05 and hypomethylated with negative beta values. Black colour dots represent the genes that are not statistically significant at a p-value <0.05.
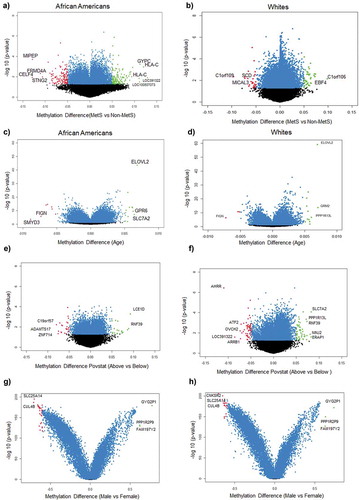
We identified 16,136 DMPs for AAs and 15,288 DMPs for White participants ()) for age. Among the 16,136 DMPs for age in AAs, 712 (10.2%) were hypermethylated with top hits being ELOVL2 (cg16867657), SLC7A2 (cg26333902), GPR6 (cg11372636), GRM2 (cg26079664), GRM2 (cg12934382) genes ()) and 3800 (42.4%) were hypomethylated with top hits being SMYD3 (cg04798314), FIGN (cg01620164), DDO (cg02872426), DNAH9 (cg13108341), STPG1 (cg21531089) ()) genes for age. Among the 15,288 DMPs for age in White population, 2866 (41.4%) were hypermethylated with top hits being GRM2 (cg26079664), ELOVL2 (cg16867657), PPP1R13L (cg27152890), CAPN8 (cg18391209), MDGA1 (cg14926196) genes ()) and 798 (8.9%) were hypomethylated with top hits being FIGN (cg01620164), APBB2 (cg11299543), KCNJ8 (cg00573770), ZEB2 (cg22083892), PDCD1LG2 (cg13207212) ()). None of the DMPs associated with age had beta coefficients of ± 0.1 among both AA and White participants.
Figure 2. Venn diagrams of significant hyper and hypomethylated DMPs in AAs and Whites (a) DMPs associated with MetS (b) DMPs associated with age (c) DMPs associated with poverty status (d) DMPs associated with sex.
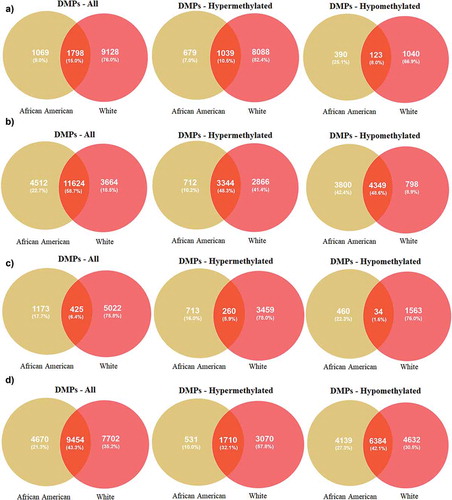
Our results showed 1,598 DMPs for AA and 5,447 DMPs for White participants when compared between poverty status above and below ()). Among the 1,598 DMPs for poverty status in AAs, 713 (16%) were hypermethylated with top hits being LCE1D (cg15967253), RNF39 (cg13401893, cg12633154, cg10930308, cg07382347, cg06249604, cg16078649), FCGBP (cg03635532), CDC40 (cg19586483), ADARB2 (cg24432675) genes () and 460 (22.3%) were hypomethylated with top hits being LINC00339 (cg19558832), ZNF714 (cg01326874), ADAMTS17 (cg05079227), C19orf57 (cg27284398), LCLAT1 (cg10326673, cg15652532) () genes. Among the 5,447 DMPs for poverty status in White population, 3459 (78%) were hypermethylated with top hits being NINJ2 (cg01201512), SLC7A2 (cg26333902), ERAP1 (cg08986950), CAPN8 (cg18391209), GSTTP1 (cg15242686) genes () and 1563 (76%) were hypomethylated with top hits being AHRR (cg05575921), LOC391322 (cg04234412), OVCH2 (cg14495594), ARRB1 (cg22867893), ATF2 (cg07253311) () genes. None of the DMPs associated with poverty status in AAs had beta coefficients of ± 0.1 whereas in White participants, AHRR gene showed a beta of ± 0.1.
We identified 14,124 DMPs for AAs and 17,156 DMPs for White participants () which were statistically significant for sex. Among the 14,124 DMPs in AAs, 531 (10%) were hypermethylated with top hits being GYG2P1 (cg06907892), FAM197Y2 (cg22028367), PPP1R2P9 (cg22223709), NLGN4Y (cg03278611), DDX3Y (cg03601053) genes () and 4139 (27.3%) were hypomethylated with top hits being CNKSR2 (cg16767700), TAZ (cg03670113), SLC25A14 (cg10717149), FHL1 (cg01742836), CUL4B (cg26505478) () genes. Among the 17,156 DMPs differentially associated with sex in the White participants, 3070 (57.8%) were hypermethylated with top hits being GYG2P1 (cg06907892), FAM197Y2 (cg22028367), PPP1R2P9 (cg22223709), NLGN4Y (cg03278611), DDX3Y (cg03601053) genes () and 4632 (30.5%) were hypomethylated with top hits being CNKSR2 (cg16767700), TAZ (cg03670113), SLC25A14 (cg10717149), FHL1 (cg01742836), CUL4B (cg26505478) () genes. Results showed a higher number of DMPs had beta coefficients of ± 0.1 in Whites (Table S13) compared to the AA (Table S10) participants.
Identification of interactome hotspots associated with MetS
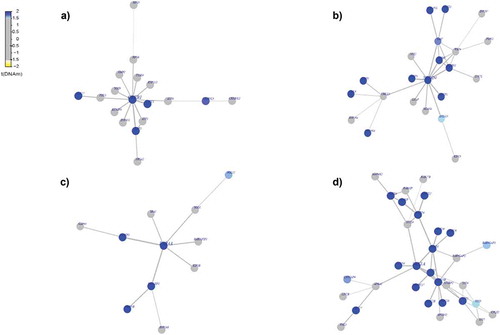
We asked if the identified differentially methylated statistically significant genes specific to each race among AAs and Whites act as functionally important interactome hotspots. Identification of interactome hotspots is useful in obtaining the functional insight of a specific phenotype of interest. In other words, it is useful to know whether differential methylation changes associated with a phenotype occur randomly or if they target specific gene modules or pathways [Citation45]. In order to infer interactome modules that represent hotspots of differential DNA methylation, we used the interactome procedure as described previously [Citation36,Citation38,Citation46]. Since we did not have any matched mRNA expression data from our samples, we applied the EpiMod algorithm, a version of FEM that takes only differential DNA methylation statistics into consideration. We used the procedure as described previously [Citation47]. Results from interactome hotspot analysis for MetS+ compared with MetS− revealed a number of significant hotspots of epigenetic deregulation, centred around the genes including LDB1, NPTN, ARRB2, ITGB7, TRIM29, VPS41, F10 (, Figure S2) among AAs and genes including CREB1, NEDD4, RAB4A, STX1A, ATRIP, EPAS1, TEC, TOPBP1 among White participants (, Figure S3). Most of these identified significant hotspots in AA (Table S11(a)) and White population (Table S11(b)) were found to be hypermethylated except the genes NPTN, ARRB2, ITGB.
Figure 3. Differential-methylated interaction hotspots identified in AAs . Interactome hotspots of epigenetic deregulation comparing MetS to non-MetS samples, inferred using the EpiMod/FEM algorithm showing (a) LIM domain binding 1 (LDB1) (b) Neuroplastin (NPTN) (c) arrestin beta 2 (ARRB2) (d) integrin subunit beta 7 (ITGB7) genes as centred seed genes.
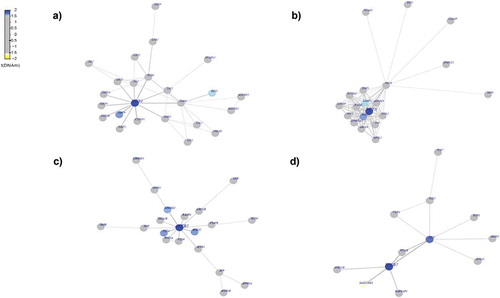
Figure 4. Differential-methylated interaction hotspots identified in White population. Interactome hotspots of epigenetic deregulation comparing MetS to non-MetS samples, inferred using the EpiMod/FEM algorithm showing (a) CAMP responsive element-binding protein 1 (CREB1) (b) neural precursor cell expressed developmentally down-regulated 4 (NEDD4) (c) Ras-related protein Rab-4A (RAB4A) (d) syntaxin 1A (STX1A) genes as centred seed genes.
Further, to evaluate the functionality of genes associated with MetS, age, poverty status and sex, we used gene ontology classification in the CpG context and identified the top 20 most significantly enriched pathways as detailed in the Figure S4. Results showed a higher number of significantly enriched GO terms associated with MetS, age, poverty status and sex among Whites compared to the AAs (Figure S4). There were fewer GO terms associated with poverty among AAs when compared to Whites. In addition, there was limited overlap of the GO terms multicellular organism development, developmental process and anatomical structure development present in both AAs and Whites (Figure S4(e)) compared to the Whites (Figure S4(f)) indicating that poverty status may have a race-specific role in regulating different molecular, cellular and biological processes. This was unique for poverty status while the other covariates demonstrated considerable overlap in the GO terms among AAs and Whites. Together, these results showed that most of the genes in both AAs and Whites were significantly enriched with the GO terms cellular and metabolic processes, protein binding and developmental process (Figure S4(a–h)).
Cell-type estimates
Genome-scale measures of DNAm in samples derived from peripheral blood may include signals from all the cell types present and may influence the confound associations of DNAm with the modelled outcomes [Citation48]. Therefore, we have estimated the cell-type composition and quantified the correlations among them. Results showed that neutrophils (Neu), CD4T, CD8T, natural killer (NK) and B cells were visually evident among AAs (Figure S5(a)) whereas neutrophils (Neu), CD4T, CD8T, natural killer (NK) and monocytes (mono) were visually evident among White population (Figure S5(b)). Importantly, correlations of DNAm were stronger with neutrophil populations compared to the other cell subsets in AA and White population suggesting that these cell ratios were important determinants of DNAm in whole blood for both the races (Figure S5(a, b)). CD8T cells were positively correlated with NK, B cell and mono cell population in AAs (Figure S5(a)). In contrast, CD8T cells were positively correlated with NK, B cell and CD4T cell population among the Whites (Figure S5(b)) indicating a clear difference in cell population estimate between the two races.
Age, poverty status and sex are associated with variable DNA methylation in MetS
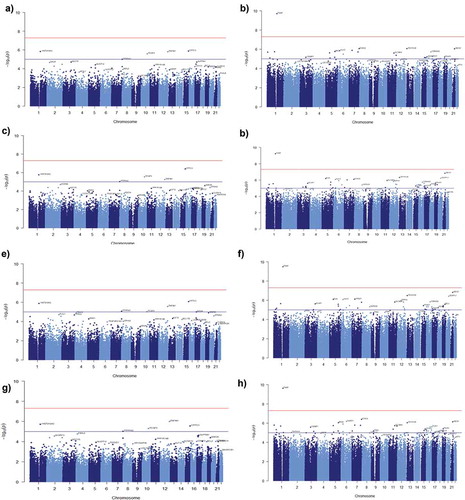
To identify whether DNA methylation sites in MetS are associated with variables such as age, poverty status and sex we performed an EWAS. Initially, we examined whether MetS is influenced by the variable cell population. Results showed that 5 DMPs (ARHGEF10, PCGF3, NPSR1, MGRN1, FBL) associated with MetS were influenced by the variable cell population at a significant threshold of −log10(1e-5) in AAs (Figure S6(a)). In contrast, none of the DMPs were associated with MetS for the variable cell population among Whites (Figure S6(b)). These results indicate that variable cell populations influence MetS only among the AA population. Next, we used multivariable linear regression to model the relationship between DNA methylation levels and MetS under the influence of cofounders age, poverty status and sex. Results from multivariable linear regression models for age showed that four DMPs among AAs (); Table S12(a)) and 23 DMPs among Whites (); Table S12(b)) were associated with methylation levels and MetS at a significant threshold of −log10(1e-5). Meanwhile, the results from multivariable linear regression models showed 5 DMPs among AAs (); Table S13(a)) and 48 DMPs among Whites (); Table S13(b)) for poverty status. There were 6 significant DMPs among AAs (); Table S10(a)) and 40 DMPs among Whites (); Table S10(b)) for sex. There were 5DMPs among AAs (); Table S11(a)) and 40 DMPs among Whites (); Table S11(b)) for all variables (age+poverty status+sex) that were associated with methylation levels and MetS at the significant threshold of −log10(1e-5). Further, results from multivariable linear regression models showed that 1DMP (TXN1P) among Whites for age, poverty status, sex and all the variables together (age+poverty status +sex) was associated with methylation levels and MetS at a significant threshold of −log10(5e-8) (). Respective QQ plots of the distribution of the p values for each of the different multivariable linear regression models generated were illustrated in the Figure S7(a–d).
Figure 5. Manhattan plots showing the results of epigenome-wide association studies (EWAS) of MetS. The model included (a) age (c) poverty status (e) sex (g) age, poverty status and sex as covariates for AA (b) age (d) poverty status (f) sex (h) age, poverty status and sex as covariates for Whites. The bottom (blue) line indicates the FDR-adjusted p-value threshold −log10(1e-5) and the top (red) line indicates the Bonferroni threshold for genome-wide significance threshold −log10(5e-8).
Differential methylation in MetS and cancer
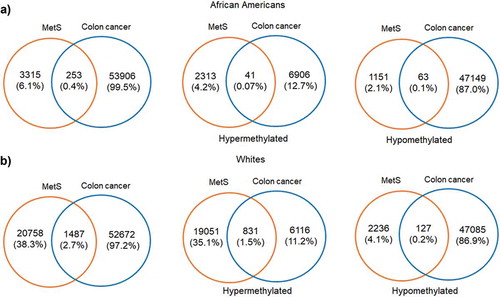
Since one of our aims was to investigate the role of MetS and DNAm in a population at risk for health disparities and cancer is a leading cause of disparate health outcomes in these populations, we examined whether there was overlap in differential DNA methylation patterns between HANDLS participants and breast and colorectal tumours in the TCGA database. We selected colorectal and breast cancer because of the differential incidence and mortality for these two cancers among AAs and because the TCGA database had representative data for tumours taken from both AAs and Whites. We examined whether any of the significantly differentially methylated annotated genes for MetS in our population coincided with the significantly differentially methylated annotated genes in these colorectal and breast tumours. To this end, we downloaded the publicly available methylation datasets from the primary solid tumours of breast invasive carcinoma (TCGA-BRCA) and colon adenocarcinoma (TCGA-COAD) from AAs and Whites from the GDC Data Portal using R package TCGAbiolinks. Box plots showing the number of samples from each of these datasets considered for our study was provided in the Figure S8(a,b). From the downloaded datasets, first, we identified genes that are differentially methylated between AAs and Whites in each of the selected cancer types. Results from prioritizing the DMRs at a significant p-value <0.01 and a mean methylation cut-off of 0.25 showed that HOOK2 (cg11738485), S100A14 (cg08477332), RPH3AL (cg21040096), C20orf71 (cg15131258) were the top-hypomethylated genes and MRPL28 (cg08923669), PACS2 (cg18397450, cg12425861, cg18912855) were the most hypermethylated genes in the breast cancer dataset ()) and DHRS4 (cg01878807), LRRN1 (cg10507275), ECHDC3 (cg09219688), C6orf47 (cg15415945) were the top-hypermethylated genes and S100A14 (cg08477332), ATXN1 (cg26843612), HOOK2 (cg11738485, cg06417478, cg04657146, cg23899408), EPAS1 (cg17518825), SSPO (cg01996567), DHX58 (cg20291162) were the most hypomethylated genes in the colon adenocarcinoma dataset ()). Furthermore, we discovered overlap with genes that are significantly differentially methylated between AA and White, MetS+ and MetS− HANDLS participants for both breast () and colon cancer () datasets.
Figure 6. Volcano plots of differentially methylated regions among African Americans and Whites in TCGA datasets (a) DMRs associated with breast cancer tumour TCGA data (b) DMRs associated with colon cancer tumour TCGA data. Blue colour dots represent the genes with p-value<0.01. Green colour dots represent the genes with p-value <0.01 and hypermethylated with positive beta values. Red colour dots represent the genes with p-value <0.01 and hypomethylated with negative beta values. Black colour dots represent the genes that are not significant.
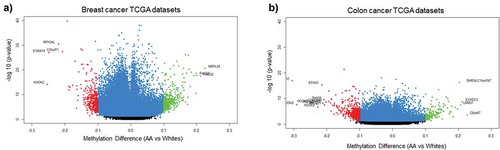
Figure 7. Venn diagrams showing the of significant hyper and hypomethylated genes among AA and Whites in MetS and breast cancer TCGA dataset (a) African Americans (b) Whites.
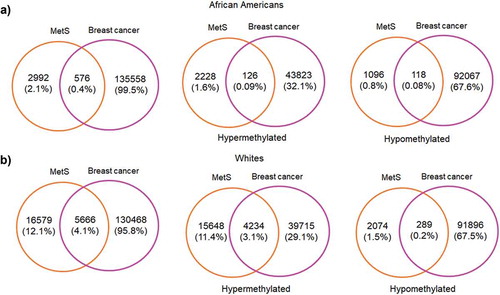
Figure 8. Venn diagrams showing the of significant hyper and hypomethylated genes among AA and Whites in MetS and colon cancer TCGA dataset (a) African Americans (b) Whites.
Discussion
In this study, we analysed the race-specific alterations in DNAm among the middle-aged AAs and Whites with and without MetS. Our cross-sectional study focused on younger participants compared to previous methylation studies on MetS [Citation19,Citation20]. We found that age, poverty status and sex-influenced DNA methylation across multiple CpG sites in both AAs and Whites. We identified a significant number of DMPs associated with MetS, age, poverty status and sex that were shared or were unique for each race (). Among the significant DMPs that are unique for each race, most were hypomethylated among AAs whereas the majority were hypermethylated in Whites (). The EWAS showed that there was only one unique gene that passed the level of significance for association of methylation level and MetS within the context of multiple variables. The DMP (TXN1P) found only in Whites met the significant threshold of −log10(5e-8) for age, poverty status, sex and all the variables together (age+poverty status +sex). We also found that there was overlap of hypermethyated and hypomethylated genes between TCGA colorectal and breast cancer tumour samples and those found in the HANDLS cohort.
We found significant DMPs associated with MetS, age, poverty status and sex in both races. GSTT1(Glutathione S-Transferase Theta 1), known to be associated with cellular response to oxidative stress and cardiometabolic disorders was identified as one of the top-hypermethylated genes (Table S1(a)) and MIPEP (Mitochondrial Intermediate Peptidase) a mitochondrial signal peptidase found in White adipose tissue was identified as one of the most hypomethylated genes when comparing AAs with and without MetS (Table S1(a)). Polymorphisms in GSTT1gene were associated with MetS in Zoroastrians in Yazd, Iran [Citation49]. The gene ACBD5 (Acyl-CoA Binding Domain-containing 5) that plays a role in peroxisomal β-Oxidation of very-long-chain fatty acids [Citation50] was identified as the top hypermethylated (Table S1(b)) and SCD (stearoyl-CoA desaturase-1), known to be required for the metabolic effects of leptin was identified as one of the most hypomethylated genes (Table S1(b)) when comparing Whites with and without MetS.
ELOVL2 (ELOVL fatty acid elongase 2), known to be associated with age-related DNA methylation changes and regulation of metabolism in mammals [Citation51] was identified as one of the top-hypermethylated genes (Table S2(a)) associated with age while DDO (D-aspartate oxidase), a flavin adenine dinucleotide-dependent peroxisomal enzyme that displays selective oxidative activity towards acidic d-amino acids [Citation52], was identified as one of the most hypomethylated genes in AAs among DMPs associated with age (Table S2(a)). The gene PPP1R13L (Protein Phosphatase 1 Regulatory Subunit 13 Like), that plays a role in apoptosis and NF-κB inflammatory pathways [Citation53], was identified as the top-hypermethylated gene (Table S2(b)) associated with age. FIGN (fidgetin, microtubule severing factor), known to have a role in congenital heart disease [Citation54] was identified as one of the most hypomethylated genes (Table S2(b)) in Whites among the DMPs associated with age.
In our cohort, we identified several genes whose methylation may be influenced by poverty status: RNF39, ZNF714, GSTTP1, and AHRR. RNF39 (ring finger protein 39), known to be hypermethylated in multiple sclerosis previously [Citation34], was hypermethylated (Table S3(a)). When comparing AAs below poverty to those above, ZNF714 (zinc finger protein 714), documented previously to be hypomethylated in visceral adipose tissue from morbidly obese patients [Citation55] was one of the most hypomethylated genes (Table S3(a)). When comparing Whites below and above poverty status, the gene GSTTP1 (Glutathione S-transferase theta pseudogene 1) that plays a role in glutathione metabolism was the top-hypermethylated gene (Table S3(b)). AHRR (Aryl-hydrocarbon receptor repressor), known to be hypermethylated in offspring of obese compared to normal-weight mothers [Citation56] was identified as one of the most hypomethylated genes (Table S3(b)) when comparing Whites below and above poverty status. Sex was important in methylation status in some genes. NLGN4Y (neuroligin 4 Y-linked), known to be involved in maternal immune responsivity [Citation57], was identified as one of the top-hypermethylated genes (Table S4(a, b)) in both AAs and Whites among DMPs associated with sex. CNKSR2 (zinc finger protein 714) known to function as a regulator of Ras signalling [Citation58] was identified as one of the most hypomethylated genes in AAs and Whites among DMPs associated with sex (Table S4(a,b)).
Our examination of interactome hotspots showed differences between AAs and Whites. We identified the following hot spots for MetS in AAs. LDB1(LIM domain binding 1) known to regulate energy homoeostasis during diet-induced obesity [Citation59], NPTN (neuroplastin) a gene that plays a role in signalling mechanisms [Citation60], ARRB2 (arrestin beta 2), known to promote 5‑FU‑induced apoptosis via the NF‑κB pathway in colorectal cancer [Citation61], ITGB7 (integrin subunit beta 7) a gene that regulates multiple myeloma cell adhesion, migration, and invasion [Citation62] (). In Whites, we identified CREB1(cAMP responsive element binding protein 1 known to be associated with type 2 diabetes mellitus risk [Citation63], NEDD4 (NEDD4 E3 ubiquitin protein ligase) which has an important role in controlling cell growth and in maintaining tissue homoeostasis [Citation64], RAB4A (RAB4A, member RAS oncogene family), known to modulate the amiloride-sensitive sodium channel (ENaC) function in colonic epithelia [Citation65] and STX1A (syntaxin 1A) known to play an essential role in biphasic exocytosis of the incretin hormone glucagon-like peptide 1 in type 2 diabetes [Citation66] as an interactome hotspots () for MetS. These identified interactome hot spots may play a key role in pertinent to metabolic pathways and may subsequently modulate the biologic mechanisms relevant to MetS.
Further, we identified differences in the enrichment of GO terms in molecular, cellular and biological processes associated with MetS, age, poverty status and sex among AAs and Whites (Figure S4). For MetS, the following GO terms were common among AAs and whites: protein binding, binding, intracellular organelle part, intracellular membrane-bounded organelle, cell part, intracellular organelle, cell, intracellular, cytoplasm, intracellular part, membrane-bounded organelle, organelle, cellular metabolic process, metabolic process (Figure S4(a)). In the context of age, we identified the following GO terms in both AAs and whites: binding, molecular function, cell part, cell, cellular component, biological regulation, cellular process, biological process (Figure S4(b)). There were also multiple overlapping GO terms for poverty status between AAs and whites. These included, multicellular organismal process, developmental process and anatomical structure developments. However, we found a notable difference in the number of genes enriched associated GO terms that correlate with poverty between AAs and Whites. This suggests that poverty status is a key variable in defining the molecular pathways that are influenced due to methylation. (Figure S4(c)). For sex, the GO terms protein binding, binding, molecular function, membrane-bounded organelle, cytoplasmic part, organelle, cell, cell part, cytoplasm, cellular component, intracellular part, intracellular, cellular process and biological process were found commonly associated in both AAs and Whites (Figure S4(d)).
We performed an EWAS to identify DNA methylation sites in MetS that were confounded by variables such as age, poverty status and sex. In our multivariable linear regression models, we have replicated previously identified genes ABCG1, IGF2BP1 as significantly methylated in MetS among African-American adults [Citation19]. We have found that the gene ABCG1 is statistically significant under the influence of confounding variables age (AAs: cg08668779; p-value = 0.014825, Whites: cg08668779; p-value = 8.79 x 10 − 7), poverty status (AAs: cg08668779; p-value = 0.0056, Whites: cg08668779; p-value = 1.42 x 10 − 7), sex (AAs: cg08668779; p-value = 0.002, Whites: cg08668779; p-value = 1.51 x 10 − 7), age+poverty status +sex (AAs: cg08668779; p-value = 0.0072, Whites: cg08668779; p-value = 0.0002). On the other hand, the gene IGF2BP1 was found statistically significant under influence of confounding variables age (cg24876164; p-value = 0.02192) and age+poverty status +sex (cg24876164; p-value = 0.038) among AAs. In Whites IGF2BP1 was found statistically significant under influence of confounding variables age (cg24876164; p-value = 0.0043), poverty status (cg24876164; p-value = 0.0026), sex (cg24876164; p-value = 0.0015), and age+poverty status +sex (cg24876164; p-value = 0.0028). These results demonstrate that MetS was consistently associated with increased methylation in the ABCG1 gene in both races whereas MetS was consistently associated with increased methylation in the IGF2BP1 gene only in Whites under the influence of different confounding variables.
Further, we have found that the gene Thioredoxin-interacting protein (TXN1P) (cg19693031) was significantly differentially methylated and associated with the variables age, poverty status, sex, and age+poverty status+sex () in White participants. TXN1P, an endogenous inhibitor of antioxidant thioredoxin (TRX), plays an important in oxidative stress and endothelial cell inflammation in diabetes and its vascular complications [Citation67]. TXNIP binds to the fructose transporters, promotes fructose absorption by the small intestine and regulates glucose homoeostasis in mammals [Citation68,Citation69]. Previous studies showed that the modulation of the thioredoxin/thioredoxin reductase system may be considered as a novel target in the management of several disorders including MetS, insulin resistance, type 2 diabetes, hypertension and atherosclerosis [Citation70]. Our results also demonstrate that MetS was consistently associated with differential methylation in the TXN1P gene under the influence of different confounding variables only in the Whites indicating that it can be used as a possible prognostic marker for MetS among the Whites. We did not find any statistically significant genes among AAs. Previous studies that also identified TXN1P as an important gene in MetS have failed to include non-White participants [Citation71]. Our data suggest that this gene may not be important for AA adults; however, we cannot definitively state this without evaluating a larger cohort of AAs in our future work.
MetS is an important risk factor for cancer significantly influencing incidence and mortality for several commonly occurring cancers [Citation72]. Previous studies showed that MetS was associated with a 52% increase in post-menopausal breast cancer risk [Citation73] and an increased risk of colorectal cancer incidence in both men and women [Citation72,Citation74]. In addition, the cancer mortality rate is 83% higher in those with three or more MetS components compared to cancer patients without MetS [Citation75]. We examined whether annotated genes that are significantly methylated in MetS in our study participants overlapped with the annotated genes that are significantly methylated in tumours from patients of the same race. This analysis revealed that there was overlap of hypermethylated and hypomethylated genes identified in the TCGA colorectal and breast cancer tumour samples with those genes significantly and differentially methylated in White and AA HANDLS participants with and without MetS for both breast () and colon cancer ().
Further, our results showed that the genes ABCG1(cg08668779), IGF2BP1 (cg24876164) and TXN1P (cg19693031) that are significantly methylated in our EWAS models were also significantly methylated with both breast (Table S12) and colon cancer (Table S13) datasets with a p-value <0.001. These three genes and the biologic pathways of which they are a part provide a hint about how MetS promotes tumorigenesis.
Our study has several notable strengths. The participants are community-dwelling middle-aged AAs and Whites allowing us to analyse race-specific differences associated with MetS and DNA methylation in a diverse cohort. The genome-wide DNAm analysis was performed using the latest version of EPIC which can efficiently quantify the methylation at more CpG sites compared to the previous Illumina HumanMethylation450 array. Nevertheless, several limitations should also be noted. The cross-sectional study design limits our ability to infer causality between MetS and DNA methylation. The study does not examine MetS in Hispanics who also have significant health disparities that may be influenced by MetS.
Conclusions
In conclusion, MetS in AA and White adults has a distinctive pattern of significantly differentially methylated DMPs, different interactome hotspots, different cell types and functional pathways that may be central to understanding molecular aspects of MetS. Identifying differential methylation patterns and different genes associated with MetS in populations at heightened risk for adverse health outcomes may enhance chances for early diagnosis by facilitating the development of biomarkers that could permit early diagnosis and treatment that would ultimately result in narrowing health disparities.
Availability of data and materials
The data that support the findings of this study are available from the corresponding author upon reasonable request. The full summary statistics of the epigenome-wide association study of age in AA and Whites are available at the study’s website (https://handls.nih.gov/).
Ethics approval and consent to participate
All participants of the HANDLS study provided informed consent. The HANDLS study is approved by the National Institute of Environmental Health Sciences (NIEHS) Institutional Review Board. Protocol number: 09-AG-N248.
Supplemental Material
Download Zip (85 MB)Acknowledgments
This project was funded by the Intramural Research Program of the National Institute on Aging (NIA), the National Institutes of Health (NIH), Baltimore, Maryland, project number: AG000519. We thank the HANDLS medical staff for their careful evaluation of HANDLS participants and obtaining the blood samples. We thank Althaf Lohani for technical assistance and the HANDLS participants for their continued participation in the study. This work utilized the computational resources of the NIH HPC Biowulf cluster (http://hpc.nih.gov).
Disclosure statement
No potential conflict of interest was reported by the authors.
Supplementary material
Supplemental data for this article can be accessed here.
Additional information
Funding
Related Research Data
References
- Alberti KG, Eckel RH, Grundy SM, et al. Harmonizing the metabolic syndrome: a joint interim statement of the international diabetes federation task force on epidemiology and prevention; National heart, lung, and blood institute; American heart association; world heart federation; International atherosclerosis society; and International association for the study of obesity. Circulation. 2009 Oct 20;120(16):1640–1645.
- Ansarimoghaddam A, Adineh HA, Zareban I, et al. Prevalence of metabolic syndrome in Middle-East countries: meta-analysis of cross-sectional studies. Diabetes Metab Syndr. 2018 Apr - Jun;12(2):195–201.
- Bellastella G, Scappaticcio L, Esposito K, et al. Metabolic syndrome and cancer: “The common soil hypothesis”. Diabetes Res Clin Pract. 2018;143:389–397.
- Moore JX, Chaudhary N, Akinyemiju T. Metabolic syndrome prevalence by race/ethnicity and sex in the United States, national health and nutrition examination survey, 1988–2012. Prev Chronic Dis. 2017 Mar 16;14:E24.
- O’Neill S, O’Driscoll L. Metabolic syndrome: a closer look at the growing epidemic and its associated pathologies. Obes Rev. 2015 Jan;16(1):1–12.
- Kraja AT, Borecki IB, North K, et al. Longitudinal and age trends of metabolic syndrome and its risk factors: the family heart study. Nutr Metab (Lond). 2006 Dec 5;3:41.
- Fernandez-Mendoza J, He F, LaGrotte C, et al. Impact of the metabolic syndrome on mortality is modified by objective short sleep duration. J Am Heart Assoc. 2017 May 17;6(5):e005479.
- Gami AS, Witt BJ, Howard DE, et al. Metabolic syndrome and risk of incident cardiovascular events and death: a systematic review and meta-analysis of longitudinal studies. J Am Coll Cardiol. 2007 Jan 30;49(4):403–414.
- Mendrick DL, Diehl AM, Topor LS, et al. Metabolic syndrome and associated diseases: from the bench to the clinic. Toxicol Sci. 2018 Mar 1;162(1):36–42.
- Khan RJ, Gebreab SY, Sims M, et al. Prevalence, associated factors and heritabilities of metabolic syndrome and its individual components in African Americans: the jackson heart study. BMJ Open. 2015 Nov 1;5(10):e008675.
- Monda KL, North KE, Hunt SC, et al. The genetics of obesity and the metabolic syndrome. Endocr Metab Immune Disord Drug Targets. 2010 Jun;10(2):86–108.
- Assah FK, Ekelund U, Brage S, et al. Urbanization, physical activity, and metabolic health in sub-Saharan Africa. Diabetes Care. 2011 Feb;34(2):491–496.
- Adediran O, Akintunde AA, Edo AE, et al. Impact of urbanization and gender on frequency of metabolic syndrome among native Abuja settlers in Nigeria. J Cardiovasc Dis Res. 2012 Jul;3(3):191–196.
- Zhan Y, Yu J, Chen R, et al. Socioeconomic status and metabolic syndrome in the general population of China: a cross-sectional study. BMC Public Health. 2012 Oct 30;12:921.
- Montez JK, Bromberger JT, Harlow SD, et al. Life-course socioeconomic status and metabolic syndrome among midlife women. J Gerontology Ser B Psychol Sci Social Sci. 2016 Nov;71(6):1097–1107.
- Krishnadath IS, Toelsie JR, Hofman A, et al. Ethnic disparities in the prevalence of metabolic syndrome and its risk factors in the suriname health study: a cross-sectional population study. BMJ Open. 2016 Dec 7;6(12):e013183.
- Menezo YJ, Silvestris E, Dale B, et al. Oxidative stress and alterations in DNA methylation: two sides of the same coin in reproduction. Reprod Biomed Online. 2016 Dec;33(6):668–683.
- Yara S, Lavoie JC, Levy E. Oxidative stress and DNA methylation regulation in the metabolic syndrome. Epigenomics. 2015;7(2):283–300.
- Akinyemiju T, Do AN, Patki A, et al. Epigenome-wide association study of metabolic syndrome in African-American adults. Clin Epigenetics. 2018;10:49.
- van Otterdijk SD, Binder AM, Szarc Vel Szic K, et al. DNA methylation of candidate genes in peripheral blood from patients with type 2 diabetes or the metabolic syndrome. PLoS One. 2017;12(7):e0180955.
- Evans MK, Lepkowski JM, Powe NR, et al. Healthy aging in neighborhoods of diversity across the life span (HANDLS): overcoming barriers to implementing a longitudinal, epidemiologic, urban study of health, race, and socioeconomic status. Ethn Dis. 2010 Summer;20(3):267–275.
- Grundy SM, Brewer HB Jr., Cleeman JI, et al. Definition of metabolic syndrome: report of the national heart, lung, and blood institute/American heart association conference on scientific issues related to definition. Arterioscler Thromb Vasc Biol. 2004 Feb;24(2):e13–8.
- Kint S, De Spiegelaere W, De Kesel J, et al. Evaluation of bisulfite kits for DNA methylation profiling in terms of DNA fragmentation and DNA recovery using digital PCR. PLoS One. 2018;13(6):e0199091.
- Moran S, Arribas C, Esteller M. Validation of a DNA methylation microarray for 850,000 CpG sites of the human genome enriched in enhancer sequences. Epigenomics. 2016 Mar;8(3):389–399.
- Pidsley R, Zotenko E, Peters TJ, et al. Critical evaluation of the illumina methylationEPIC BeadChip microarray for whole-genome DNA methylation profiling. Genome Biol. 2016 Oct 7;17(1):208.
- Aryee MJ, Jaffe AE, Corrada-Bravo H, et al. Minfi: a flexible and comprehensive Bioconductor package for the analysis of Infinium DNA methylation microarrays. Bioinformatics. 2014 May 15;30(10):1363–1369.
- Peters TJ, Buckley MJ, Statham AL, et al. De novo identification of differentially methylated regions in the human genome. Epigenetics Chromatin. 2015;8:6.
- S. GK. limma: linear Models for Microarray Data. In: Gentleman R. CVJ, Huber W, Irizarry RA, et al., editors. Bioinformatics and computational biology solutions using R and bioconductor. Statistics for biology and health. New York, NY: Springer; 2005.p.397–420.
- Phipson B, Maksimovic J, Oshlack A. missMethyl: an R package for analyzing data from illumina’s Humanmethylation450 platform. Bioinformatics. 2016 Jan 15;32(2):286–288.
- KD H IlluminaHumanMethylationEPICanno.ilm10b2.hg19: annotation for Illumina’s EPIC methylation arrays. R package version 0.6.0. 2016.
- KD H IlluminaHumanMethylationEPICmanifest: manifest for Illumina’s EPIC methylation arrays. R package version 0.3.0. 2016.
- Triche TJ Jr., Weisenberger DJ, Van Den Berg D, et al. Low-level processing of illumina infinium DNA methylation beadarrays. Nucleic Acids Res. 2013 Apr;41(7):e90.
- Johnson WE, Li C, Rabinovic A. Adjusting batch effects in microarray expression data using empirical bayes methods. Biostatistics. 2007 Jan;8(1):118–127.
- Maltby VE, Lea RA, Sanders KA, et al. Differential methylation at MHC in CD4(+) T cells is associated with multiple sclerosis independently of HLA-DRB1. Clin Epigenetics. 2017;9:71.
- Tian Y, Morris TJ, Webster AP, et al. ChAMP: updated methylation analysis pipeline for Illumina BeadChips. Bioinformatics. 2017 Dec 15;33(24):3982–3984.
- Jiao Y, Widschwendter M, Teschendorff AE. A systems-level integrative framework for genome-wide DNA methylation and gene expression data identifies differential gene expression modules under epigenetic control. Bioinformatics. 2014 Aug 15;30(16):2360–2366.
- Aref-Eshghi E, Schenkel LC, Ainsworth P, et al. Genomic DNA methylation-derived algorithm enables accurate detection of malignant prostate tissues. Front Oncol. 2018;8:100.
- West J, Beck S, Wang X, et al. An integrative network algorithm identifies age-associated differential methylation interactome hotspots targeting stem-cell differentiation pathways. Sci Rep. 2013;3:1630.
- Jones MJ, Islam SA, Edgar RD, et al. Adjusting for cell-type composition in DNA methylation data using a regression-based approach. Methods Mol Biol. 2017;1589:99–106.
- Salas LA, Koestler DC, Butler RA, et al. An optimized library for reference-based deconvolution of whole-blood biospecimens assayed using the illumina humanmethylationepic beadarray. Genome Biol. 2018 May 29;19(1):64.
- Barfield RT, Kilaru V, Smith AK, et al. CpGassoc: an R function for analysis of DNA methylation microarray data. Bioinformatics. 2012 May 1;28(9):1280–1281.
- Chin L, Hahn WC, Getz G, et al. Making sense of cancer genomic data. Genes Dev. 2011 Mar 15;25(6):534–555.
- Tomczak K, Czerwinska P, Wiznerowicz M. The Cancer Genome Atlas (TCGA): an immeasurable source of knowledge. Contemp Oncol. 2015;19(1A):A68–77.
- Colaprico A, Silva TC, Olsen C, et al. TCGAbiolinks: an R/Bioconductor package for integrative analysis of TCGA data. Nucleic Acids Res. 2016 May 5;44(8):e71.
- Teschendorff AE, W M. A network systems approach to identify functional epigenetic drivers in cancer. In: editor, Shen B. Bioinformatics for diagnosis, prognosis and treatment of complex diseases. Vol. 4. Dordrecht: Springer; 2013. p. 131–152.
- Jones A, Teschendorff AE, Li Q, et al. Role of DNA methylation and epigenetic silencing of HAND2 in endometrial cancer development. PLoS Med. 2013 Nov;10(11):e1001551.
- Teschendorff AE, Gao Y, Jones A, et al. DNA methylation outliers in normal breast tissue identify field defects that are enriched in cancer. Nat Commun. 2016 Jan 29;7:10478.
- Titus AJ, Gallimore RM, Salas LA, et al. Cell-type deconvolution from DNA methylation: a review of recent applications. Hum Mol Genet. 2017 Oct 1;26(R2):R216–R224.
- Afrand M, Bashardoost N, Sheikhha MH, et al. Association between Glutathione S-Transferase GSTM1-T1 and P1 Polymorphisms with Metabolic Syndrome in Zoroastrians in Yazd, Iran. Iran J Public Health. 2015 May;44(5):673–682.
- Yagita Y, Shinohara K, Abe Y, et al. Deficiency of a Retinal dystrophy protein, Acyl-CoA Binding Domain-containing 5 (ACBD5), impairs peroxisomal beta-oxidation of very-long-chain fatty acids. J Biol Chem. 2017 Jan 13;292(2):691–705.
- Jakobsson A, Westerberg R, Jacobsson A. Fatty acid elongases in mammals: their regulation and roles in metabolism. Prog Lipid Res. 2006 May;45(3):237–249.
- Huang AS, Beigneux A, Weil ZM, et al. D-aspartate regulates melanocortin formation and function: behavioral alterations in D-aspartate oxidase-deficient mice. J Neurosci. 2006 Mar 8;26(10):2814–2819.
- Falik-Zaccai TC, Barsheshet Y, Mandel H, et al. Sequence variation in PPP1R13L results in a novel form of cardio-cutaneous syndrome. EMBO Mol Med. 2017 Mar;9(3):319–336.
- Wang D, Chu M, Wang F, et al. A genetic variant in FIGN gene reduces the risk of congenital heart disease in Han Chinese populations. Pediatr Cardiol. 2017 Aug;38(6):1169–1174.
- Crujeiras AB, Diaz-Lagares A, Moreno-Navarrete JM, et al. Genome-wide DNA methylation pattern in visceral adipose tissue differentiates insulin-resistant from insulin-sensitive obese subjects. Transl Res. 2016;178:13–24 e5.
- Burris HH, Baccarelli AA, Byun HM, et al. Offspring DNA methylation of the aryl-hydrocarbon receptor repressor gene is associated with maternal BMI, gestational age, and birth weight. Epigenetics. 2015;10(10):913–921.
- Bogaert AF, Skorska MN, Wang C, et al. Male homosexuality and maternal immune responsivity to the Y-linked protein NLGN4Y. Proc Natl Acad Sci U S A. 2018 Jan 9;115(2):302–306.
- Lanigan TM, Liu A, Huang YZ, et al. Human homologue of Drosophila CNK interacts with Ras effector proteins Raf and Rlf. Faseb J. 2003 Nov;17(14):2048–2060.
- Loyd C, Liu Y, Kim T, et al. LDB1 regulates energy homeostasis during diet-induced obesity. Endocrinology. 2017 May 1;158(5):1289–1297.
- Beesley PW, Herrera-Molina R, Smalla KH, et al. The neuroplastin adhesion molecules: key regulators of neuronal plasticity and synaptic function. J Neurochem. 2014 Nov;131(3):268–283.
- Ren W, Wang T, He X, et al. betaarrestin2 promotes 5FUinduced apoptosis via the NFkappaB pathway in colorectal cancer. Oncol Rep. 2018 Jun;39(6):2711–2720.
- Neri P, Ren L, Azab AK, et al. Integrin beta7-mediated regulation of multiple myeloma cell adhesion, migration, and invasion. Blood. 2011 Jun 9;117(23):6202–6213.
- Xu Y, Song R, Long W, et al. CREB1 functional polymorphisms modulating promoter transcriptional activity are associated with type 2 diabetes mellitus risk in Chinese population. Gene. 2018 Jul 30;665:133–140.
- Totland MZ, Bergsland CH, Fykerud TA, et al. The E3 ubiquitin ligase NEDD4 induces endocytosis and lysosomal sorting of connexin 43 to promote loss of gap junctions. J Cell Sci. 2017 Sep 1;130(17):2867–2882.
- Saxena SK, Singh M, Shibata H, et al. Rab4 GTP/GDP modulates amiloride-sensitive sodium channel (ENaC) function in colonic epithelia. Biochem Biophys Res Commun. 2006 Feb 10;340(2):726–733.
- Wheeler SE, Stacey HM, Nahaei Y, et al. The SNARE protein syntaxin-1a plays an essential role in biphasic exocytosis of the incretin hormone glucagon-like peptide 1. Diabetes. 2017 Sep;66(9):2327–2338.
- Perrone L, Devi TS, Hosoya K, et al. Thioredoxin interacting protein (TXNIP) induces inflammation through chromatin modification in retinal capillary endothelial cells under diabetic conditions. J Cell Physiol. 2009 Oct;221(1):262–272.
- Ding XQ, Wu WY, Jiao RQ, et al. Curcumin and allopurinol ameliorate fructose-induced hepatic inflammation in rats via miR-200a-mediated TXNIP/NLRP3 inflammasome inhibition. Pharmacol Res. 2018;137:64–75.
- Dotimas JR, Lee AW, Schmider AB, et al. Diabetes regulates fructose absorption through thioredoxin-interacting protein. eLife. 2016 Oct 11;5:e18313.
- Tinkov AA, Bjorklund G, Skalny AV, et al. The role of the thioredoxin/thioredoxin reductase system in the metabolic syndrome: towards a possible prognostic marker? Cell Mol Life Sci. 2018 May;75(9):1567–1586.
- Samblas M, Milagro FI, Martinez A. DNA methylation markers in obesity, metabolic syndrome, and weight loss. Epigenetics. 2019 May;14(5):421–444.
- Mendonca FM, de Sousa FR, Barbosa AL, et al. Metabolic syndrome and risk of cancer: which link? Metabolism. 2015 Feb;64(2):182–189.
- Sertznig P, Seifert M, Tilgen W, et al. Present concepts and future outlook: function of peroxisome proliferator-activated receptors (PPARs) for pathogenesis, progression, and therapy of cancer. J Cell Physiol. 2007 Jul;212(1):1–12.
- Esposito K, Chiodini P, Capuano A, et al. Colorectal cancer association with metabolic syndrome and its components: a systematic review with meta-analysis. Endocrine. 2013 Dec;44(3):634–647.
- Jaggers JR, Sui X, Hooker SP, et al. Metabolic syndrome and risk of cancer mortality in men. Eur J Cancer. 2009 Jul;45(10):1831–1838.