
ABSTRACT
Primordial germ cells (PGCs) are precursors of eggs and sperm. How the PGCs epigenetically reprogram during early embryonic development in fish is currently unknown. Here we generated a series of PGC methylomes using whole genome bisulfite sequencing across key stages from 8 days post fertilization (dpf) to 25 dpf coinciding with germ cell sex determination and gonadal sex differentiation in medaka (Oryzias latipes) to elucidate the dynamics of DNA methylation during epigenetic reprogramming in germ cells. Our high-resolution DNA methylome maps show a global demethylation taking place in medaka PGCs in a two-step strategy. The first step occurs between the blastula and 8-dpf stages, and the second step occurs between the 10-dpf and 12-dpf stages. Both demethylation processes are global, except for CGI promoters which remain hypomethylated throughout the stage of PGC specification. De novo methylation proceeded at 25-dpf stage with the process in male germ cells superseding female germ cells. Gene expression analysis showed that tet2 maintains high levels of expression during the demethylation stage, while dnmt3ba expression increases during the de novo methylation stage during sexual fate determination in germ cells. The present results suggest that medaka PGCs undergo a bi-phasic epigenetic reprogramming process. Global erasure of DNA methylation marks peaks at 15-dpf and de novo methylation in male germ cells takes precedence over female germ cells at 25 dpf. Results also provide important insights into the developmental window of susceptibility to environmental stressors for multi- and trans-generational health outcomes in fish.
Background
DNA methylation is one of the major forms of epigenetic modifications that are associated with transcriptional regulation [Citation1], genomic imprinting [Citation2], suppression of repetitive elements [Citation3,Citation4] and DNA–protein interactions during the development of organisms. DNA methylation plays an important role in embryonic development and undergoes dramatic changes in two epigenetic reprogramming windows: first in preimplantation embryos and second in primordial germ cells (PGCs) during sex-specific fate specification. In both windows, DNA methylation patterns are reprogrammed genome-wide, and the majority of the inherited methylation marks are erased, generating cells with a broad developmental potential [Citation5].
PGCs are the only embryonic cells with the potential to transmit genetic and epigenetic information to the next generation. Epigenetic reprogramming of mammalian PGCs is well characterized. In mice, PGC demethylation proceeds in two phases [Citation6]. At phase 1, DNA demethylation starts from embryonic day 8 (E8.0) and completes at E9.5. The PGCs lose DNA methylation levels established in epiblasts (E6.5). In phase 2, PGCs undergo locus-specific DNA demethylation starting at E10.5 and reach a ground state of hypomethylation at E13.5 [Citation6–Citation8]. Similarly, in humans, global erasure of DNA methylation marks gives rise to a stem cell state for PGCs, and de novo methylation allows a controlled sex-specific gene expression pattern in germ cells [Citation9–Citation11]. However, the process of epigenetic reprogramming of PGCs in fish is currently unknown.
Any perturbations of global epigenetic reprogramming events in PGCs have the potential for fertility problems later in life and adverse health outcomes in descendants [Citation12]. Previous studies suggest that these reprogramming errors can cause a change in the epigenome and associated transcriptome in PGCs, and that epigenetic shifts can be permanently programmed and transmitted to subsequent generations via both sperm [Citation13] and eggs [Citation14,Citation15]. A variety of environmentally induced transgenerational health effects have been observed in both mammals and fish [Citation16–Citation22]. In most of the transgenerational studies, experiments were designed to expose animals during the window of PGC reprogramming, and the effects were found to be transmitted to subsequent generations via germline transmission. Analysis of sperm and PGCs, whose ancestors were developmentally exposed to chemical stressors, yielded differentially methylated regions on the genome-specific to exposure, suggesting that environmental exposures can alter epigenetic modifications on PGCs and sperm genome [Citation18,Citation23,Citation24]. However, how environmental stressors establish epigenetic alterations in PGCs and what controls their precise transmission to eggs and sperm and subsequent generation is enigmatic. Fish, mainly medaka and zebrafish, are promising animal models for studying the epigenetic inheritance of acquired traits [Citation16,Citation22,Citation25–Citation30] and have advantages over mammalian models due to external fertilization and embryo development. It is, therefore, imperative to understand epigenetic reprogramming in fish.
Medaka (Oryzias latipes) is an important biomedical model organism [Citation25,Citation31–Citation33], with advantages including genetic sex determination in the Hd-rR strain [Citation34], external fertilization, availability of large numbers of eggs and sperm, short generation time (3–4 months/reproductive cycle), a sequenced genome, and a small genome size [Citation27,Citation35]. Additionally, the molecular mechanisms underlying early embryogenesis, germ cell migration, and differentiation are complementary to human and mouse [Citation36]. For instance, medaka embryos undergo DNA methylation programming similar to the patterns occurring in preimplantation stage human and mouse embryos [Citation26,Citation37,Citation38]. In medaka, as in many other organisms, PGCs form early in embryonic development [Citation39], and are distinguishable at early gastrulation (stage 13), converge to the embryonic axis until late gastrulation, and then migrate posteriorly into dense bilateral clusters in the ventral lateral areas of the abdomen [Citation36,Citation40]. However, direct evidence of DNA methylation reprogramming during PGC specification in fish is still missing [Citation41]. To fill this gap in information, we generated a series of single-base resolution genomic methylomes and investigated the DNA methylation dynamics during epigenetic reprogramming in medaka PGCs using a whole genome bisulfite sequencing (WGBS) approach.
Results
Genome-wide DNA methylation dynamics in medaka PGCs
To gain insights into epigenetic reprogramming in medaka PGCs, we performed whole genome bisulfite sequencing on PGC samples isolated at 8, 10, 12, 15, and 25 days post fertilization (dpf), coinciding with gonadal sex determination and gonadogenesis in medaka. The numbers of larvae used in each sample are shown in Table S1. WGBS libraries were prepared from three independent samples at each time point. Table S1 summarizes the outcome of the sequencing runs of all WGBS samples. A set of data from blastula was obtained from the published literature [Citation42] and analysed using the same pipeline as the initial PGC reprogramming.
The dynamics of global DNA methylation in PGCs are shown in . Two phases of demethylation processes were observed. The first demethylation phase occurred from the blastula to 8-dpf stage, and the second phase occurred from the 10-dpf to 12-dpf stage. In the blastula stage, the global methylation level at CpG dinucleotides was 80%, showing a hypermethylated status. In the 8-dpf stage PGCs, methylation levels were already reduced to 50%, indicating that the bulk of methylation erasure occurred in PGCs prior to the 8-dpf stage. From the 8-dpf stage, PGC methylation levels decreased gradually to 39% at the 15-dpf stage, which was the lowest level observed during reprogramming of medaka PGCs. To determine the detailed DNA methylation dynamics, the genome was divided into 5 kb tiling probes with a 2.5 kb stepping size [Citation6]. Since shorter tile sizes may not contain CpGs within a tile, while longer tile sizes, such as 5 kb span, ensure the presence of sufficient numbers of CpGs for analysis. Beanplot showed the distribution of CpG methylation levels of the pooled replicates of medaka blastula, and PGCs showed a consistent global methylation dynamic pattern (). To confirm the global DNA methylation dynamics in medaka PGCs, we also used global 5mC ELISA to determine methylation levels at each stage, showing a similar dynamic profile to the WGBS results (Figure S1(c)). Intriguingly, female PGCs maintained hypomethylation levels in the 25-dpf stage, while genome-wide methylation levels in male PGCs increased up to 50% at the same stage, suggesting de novo methylation already occurred in male PGCs (,)). The genomic methylation levels increased up to 56% in the sperm [Citation26], demonstrating that the remethylation process continued during spermatogenesis ()).
Figure 1. DNA methylation dynamics in medaka PGCs. (a): Global CpG methylation levels observed in PGCs at different stages of life history; (b): Beanplots showing the distribution of CpG methylation levels of the pooled replicates of medaka blastula and PGCs. Methylation was quantitated by taking 5 kb genomic probes approach; (c): Distribution of CpG methylation levels across the genome; (d): Average CpG methylation of the genomic features in PGCs at different stages of life history; (e): Average CpG methylation profiles over all medaka annotated genes starting from 5 kb upstream (−5 kb) of the transcription start site (TSS), through scaled gene bodies to 5 kb downstream (+5 kb) of transcription end sites (TESs); (f): Average CpG methylation profiles over all medaka CpG islands, CGI shores, and CGI shelves.
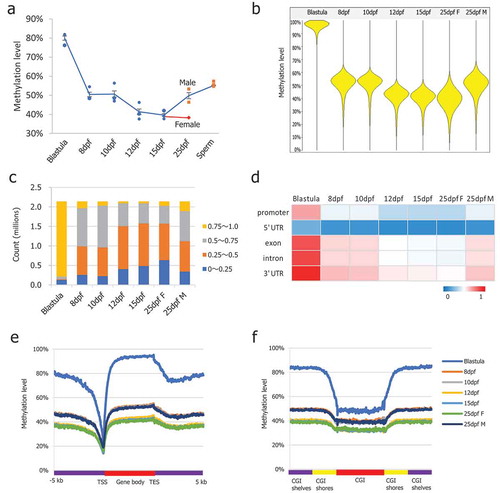
Next, we investigated methylation changes on single CpG sites and genomic features. As shown for the distribution of CpG methylation levels across the genome, global loss of methylation affected the methylation levels of all the elements examined (). Both phases of methylation erasure were global prior to the 12-dpf stage. Although the timing varied slightly, methylation of promoters, exon, introns and 3ʹUTRs followed the trend of whole genome methylation, while the 5ʹUTRs maintained low levels of methylation throughout the developmental time points (). The methylation pattern in gene regions, especially low methylation at the transcription start sites (TSSs) and slightly increased levels in gene bodies, was maintained during this phase (). Average CpG methylation profiles over all medaka annotated genes starting from 5 kb upstream (−5 kb) of the transcription start site (TSS) through scaled gene bodies to 5 kb downstream (+5 kb) of the transcription end site (TES) showed global demethylation occurring across gene regions. The methylation patterns over CpG islands, CGI shores, and CGI shelves were maintained during this phase (). The average CpG methylation profile overall medaka CpG islands, CGI shores, and CGI shelves showed global demethylation over CGI-related regions. In the mouse, the methylation level of chromosome X is slightly higher than in the autosomes and shows resistance to demethylation [Citation7]. However, in medaka, we did not observe differences in methylation of the 5 kb probes and CGIs between autosomes and chromosome 9, where the Y chromosome-specific region is located [Citation43] (Figure S1(d,e)), suggesting that medaka do not possess a mature Y chromosome.
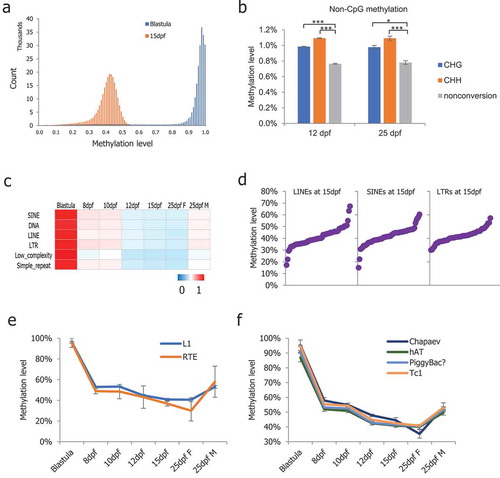
To determine the ground methylation state in medaka PGCs, we plotted the 5 kb probe methylation levels at the 15-dpf stage, during which the global methylation reached the lowest level. The distribution of 5 kb probe methylation in the 15-dpf medaka PGCs showed methylation in a majority of probes, maintaining 30% to 50% with a unique peak (), suggesting that it is the ground methylation state for medaka PGCs. Next, we compared genome-wide 5-methylcytosine levels on non-CpG sites. Non-CpG methylation was maintained at low levels close to non-conversion rates (Figure S2(a)). Interestingly, the 12- and 25-dpf stage PGCs exhibited a significantly higher level of non-CpG methylation compared to the non-conversion rate (, paired t-test, *p < 0.05, ***p < 0.001).
Figure 2. DNA methylation profiles of non-CpG sites and dynamics of repeat elements. (a): Methylation level distribution of 5 kb probes in blastula and 15-dpf medaka PGCs; (b): Non-CpG methylation levels increased significantly in medaka PGCs from 12-dpf and 25-dpf males; (c): Average CpG methylation of the repeat elements in medaka PGCs; (d): The methylation levels of the majority of retrotransposons were found to be between 30% and 50%; (e): RTE showing continued demethylation in PGCs including in 25-dpf female PGCs; (f): Chapaev transposons showing continued demethylation including in 25-dpf female PGCs.
DNA methylation dynamics of repeat elements
Repeat elements comprise 17.5% of the medaka genome in total [Citation35]. Next, we analysed the average methylation levels of major classes of medaka repeat elements, including long and short interspersed elements (LINEs and SINEs), long terminal repeats (LTR), DNA transposons, and low complexity and simple repeats. DNA methylation is important for the repression of retrotransposons, which make up approximately 3.9% of the medaka genome [Citation35,Citation44]. We examined the methylation states of major medaka retrotransposon classes, including LINEs, SINEs, and LTRs. In 8-dpf to 15-dpf PGCs, the majority of retrotransposon loci were progressively demethylated, similar to the unique portion of the genome, but a notable fraction of L1 and RTE loci remained partially methylated ( and S2(b)). In particular, the majority of LINE, SINE, and LTR loci showed >30% methylation in the 15-dpf stage PGCs, which showed the lowest methylation level (). We observed a general trend that RTEs and Chapaev were continuously demethylated in female PGCs from the 15-dpf to 25-dpf but not in male PGCs (,)).
DNA methylation dynamics of CpG islands (CGIs)
CGIs were identified based on HMM by applying the R software package makeCGI [Citation45,Citation46]. In total, we identified 52,932 CGIs in the medaka genome with an average length of 308 bp (Figure S3(a)). Within them, 5,319 CGIs were located on promoter regions (Promoter-CGI, Figure S3(b)). Interestingly, we found promoter-CGIs remained hypomethylated across all stages compared to non-promoter-CGIs ((a)). Gene ontology analysis showed that promoter-CGIs had a significant enrichment. Particularly, among biological processes, the most enriched GO terms included ‘chromatin assembly’, ‘nucleosome assembly’, ‘histone modification’, ‘MAPK cascade’ and ‘cell fate commitment’ (Figure S3(c)). Among cellular components, the most enriched GO terms included ‘nucleosome’, ‘DNA packaging complex’, ‘protein-DNA complex’, ‘chromatin’ and ‘transferase complex’ (Figure S3(d)). Among molecular functions, the most enriched GO terms included ‘histone-lysine N-methyltransferase activity’, ‘DNA-binding transcription factor activity’, and ‘transcription regulator activity’ (Figure S3(e)). Pathway analysis showed enrichment at ‘FGF signaling pathway’ and ‘Endothelin signaling pathway’ (Figure S3(f)).
Figure 3. DNA methylation levels of CpG islands in medaka PGCs. (a): Promoter-CGIs showed hypomethylation throughout the PGC reprogramming process, while the non-promoter-CGIs showed hypermethylation throughout the PGC reprogramming period; (b): DMCGIs identified between 10-dpf and 12-dpf PGCs; (c): DMCGIs identified between 15-dpf and 25-dpf male PGCs; (d): Distribution of DMCGIs identified in 10-dpf and 12-dpf PGCs; (e): Distribution of DMCGIs identified in 15-dpf and 25-dpf male PGCs; (f): DMCGIs were hypermethylated in 25-dpf male PGCs and were hypomethylated in 25-dpf female PGCs.
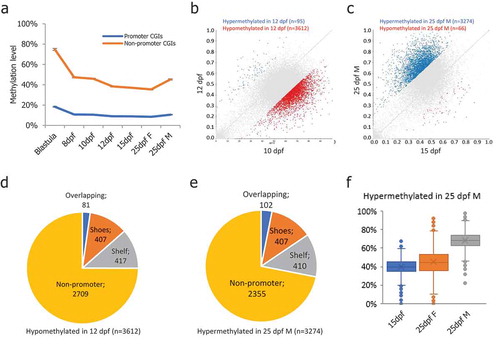
Next, we identified differentially methylated CGIs (DMCGIs) between adjacent stages. First, we focused on the DMCGIs identified between 10-dpf and 12-dpf, during which the second demethylation phase occurred. In total, we found 95 DMCGIs hypermethylated and 3,612 DMCGIs hypomethylated in 12-dpf PGCs compared with 10-dpf PGCs (). Within the 3,612 hypomethylated DMCGIs, only 81 DMCGIs overlapped with promoter regions (). Gene ontology analysis showed no significant enrichment of these genes. However, we found 407 DMCGI shores and 417 DMCGI shelfs overlapping with the promoter region (). Next, we focused on the DMCGIs identified between 15-dpf and 25-dpf male PGCs, during which remethylation occurred in male PGCs. In total, we found 3,274 DMCGIs hypermethylated and 66 DMCGIs hypomethylated in 25-dpf male PGCs compared with 15-dpf (). The 3,274 hypermethylated DMCGIs remained hypomethylated in 25-dpf female PGCs (). Within the 3,274 hypermethylated DMCGIs, only 102 DMCGIs overlapped with promoter regions (). Gene ontology analysis showed no significant enrichment of these genes. Similar to DMCGIs identified between 10-dpf and 12-dpf, 407 DMCGI shores and 410 DMCGI shelves overlapped with the promoter region (), suggesting that those DMCGIs are located at remote regulatory regions.
Analysis of differentially methylated promoters
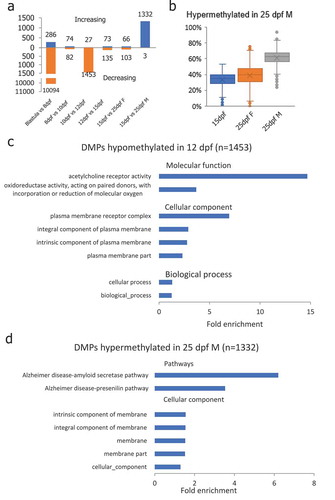
To investigate the genes involved in DNA methylation reprogramming in medaka PGCs, we identified differentially methylated promoters (DMP) in each subsequent stage pairs (Figure S4). Consistent with global DNA methylation changes, the majority of DMPs were identified between blastula and 8-dpf stage PGCs, 10-dpf and 12-dpf PGCs, and 15-dpf PGCs and 25-dpf male PGCs. In total, 10,094 DMPs were demethylated in PGCs from the blastula to 8-dpf stage, and 286 DMPs gained methylation in PGCs from the blastula to 8-dpf stage (). The majority of the DMPs between 10-dpf and 12-dpf PGCs were demethylated (1,453 out of 1,480), of which 177 DMPs overlapped with CGIs. Gene ontology analysis showed these genes enriched in ‘biological_processes’ and ‘cellular processes’ related items in biological process; ‘plasma membrane receptor complex’ and ‘integral component of plasma membrane’ related items in cellular component; and ‘acetylcholine receptor activity’ and ‘oxidoreductase activity’ in molecular function (). In PGCs from 15-dpf embryos and 25-dpf males, 1,335 DMPs were identified, of which 1,332 DMPs were remethylated. Similar to DMCGIs identified between 15-dpf and 25-dpf male PGCs, 1335 hypermethylated DMPs were hypomethylated in 25-dpf female PGCs (). Within them, 176 DMPs overlapped with CGIs. Gene ontology analysis showed that these genes were enriched with ‘membrane’ related items in the cellular component category (). Intriguingly, pathway analysis showed that these genes were enriched in the ‘Alzheimer’s disease’ related pathway ().
Figure 4. Differentially methylated promoters (DMP) identified during PGC reprogramming. (a): Differentially methylated promoters in PGCs at different stages of life history; (b): DMPs that were hypermethylated in 25-dpf male PGCs were still at the hypomethylated state in female PGCs at the 25-dpf stage indicating de novo methylation taking place in male PGCs earlier than in females; (c): Gene ontology enrichment of DMPs hypomethylated in 12-dpf compared with 10-dpf PGCs; (d): Gene ontology and pathway enrichment of DMPs hypomethylated in 25-dpf male compared with 15-dpf PGCs.
Expression of DNA methylation-related genes in medaka PGCs
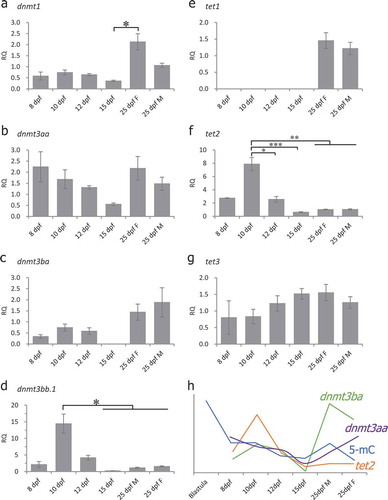
DNA methyltransferases are involved in DNA methylation regulation [Citation47]. Active demethylation is achieved through TET-mediated oxidation of 5-methylcytosine (5mC), followed by replication-dependent dilution or base excision repair [Citation48]. To determine which dnmt or tet genes are involved in DNA methylation reprogramming in medaka PGCs, we measured the expression of DNA methylation-related genes in different stages by real-time quantitative RT-PCR (). The expression of dnmt1 was detected in all stages examined () and significantly increased from 15-dpf to 25-dpf female PGC samples. The expression of dnmt3aa was detected in all stages examined () and showed no significant changes. The expression of dnmt3ba was low from 8-dpf to 12-dpf and could not be detected in 15-dpf samples (). However, the expression of dnmt3ba increased at the 25-dpf in both female and male PGCs (), indicating that dnmt3ba might play a critical role in the genome de novo methylation during gametogenesis. The expression of dnmt3bb.1 significantly decreased from 15-dpf to 25-dpf compared with 10-dpf (). The expression of tet1 was detected only in 25-dpf PGCs (), suggesting that it is not involved in demethylation during PGC specification. The expression of tet2 was detected in all stages examined with significantly higher expression in 10-dpf PGCs (), suggesting the possible role of this gene in DNA demethylation during PGC specification. The expression of tet3 was detected in all stages examined () and had no significant changes. There were positive correlations between 5-mC levels and levels of dnmt3ba and tet2 (, correlation coefficient: 0.1660 between 5-mC and dnmt3ba expression, and 0.5468 between 5-mC and tet2 expression), suggesting the involvement of dnmt3ba in DNA remethylation and tet2 in DNA demethylation during PGC development in medaka.
Figure 5. Expression of DNA methyltransferases (DNMT) and TET methylcytosine dioxygenases during specification of PGCs as measured by real-time qRT-PCR. Gene expression in all the stages was normalized to expression in 25-dpf male PGCs (set as 1). Beta-actin (β-actin) was used as an internal control. RQ: Relative quantification. (a): dnmt1, one-way ANOVA showed p < 0.05, Tukey’s multiple comparisons test showed significant differences between 15-dpf and 25-dpf female PGC samples; (b): dnmt3aa, one-way ANOVA showed no significant differences among the examined stages; (c): dnmt3ba, one-way ANOVA showed no significant differences among the examined stages; (d): dnmt3bb.1, one-way ANOVA showed p < 0.05, Tukey’s multiple comparisons test showed significant differences between 10-dpf vs 15-dpf, 25-dpf female and 25-dpf male PGC samples; (e): tet1, one-way ANOVA showed no significant differences among the examined stages; (f): tet2, one-way ANOVA showed p < 0.001, Tukey’s multiple comparisons tests showed significant differences between 10-dpf vs 12-dpf, 15-dpf, 25-dpf female and 25-dpf male PGC samples; (g): tet3, one-way ANOVA showed no significant differences; (h): A relationship between dnmt3ba, tet2 expression and global 5-mC levels. Data represent the mean ± SEM. Asterisk indicates statistical significance (*p < 0.05, **p < 0.01, ***p < 0.001).
Discussion
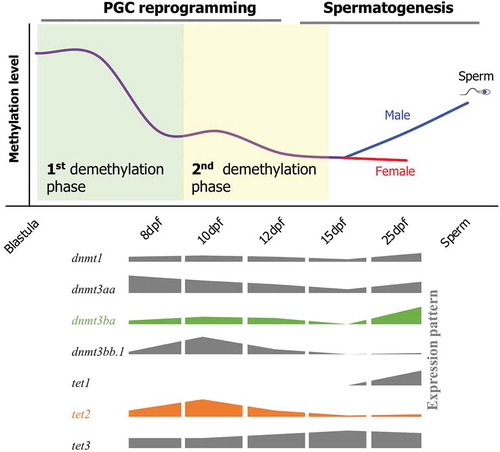
The dynamics of DNA methylation during epigenetic reprogramming of PGCs in fish is currently unknown. In the present study, we performed comprehensive profiling of DNA methylation patterns at single-base resolution across the whole genome during key stages of PGC development in medaka to elucidate the process of epigenetic reprogramming of PGCs in fish. We found two phases of demethylation during medaka PGC reprogramming (). The first demethylation phase completes before 8-dpf, during which the PGCs undergo demethylation globally. The second demethylation phase starts at 10-dpf and is completed by 12-dpf, during which the PGCs complete the demethylation process. By 25-dpf, male PGCs undergo de novo methylation (remethylation), while female PGCs are still hypomethylated at a level similar to 15-dpf (a ground state). This is the first study to demonstrate epigenetic reprogramming in a non-mammalian vertebrate, which provides a baseline information for future studies concerning totipotency, stem cell differentiation, transgenerational epigenetic inheritance, and environmentally induced reproductive impairments. These two phases of demethylation during PGC reprogramming are also reported for humans and mice [Citation6,Citation7] suggesting similar epigenetic events occurring in medaka and mammals during the differentiation of germ cells. Because of genetic diversity and species-specific responses to stressors, molecular alterations induced by environmental or nutritional stressors in one vertebrate species are often not translatable to other species. This synergy in fish and mammals allows for comparative analysis of molecular responses to stressors during early embryonic development in vertebrates, in general.
Figure 6. A schematic of DNA methylation dynamics during reprogramming of PGCs in medaka. Demethylation in PGCs occurs in two phases. The first phase occurs prior to 8-dpf (First demethylation phase), and the second phase lasts from the 10-dpf to 12-dpf stage (second demethylation phase). Global DNA methylation level increase from 15-dpf to 25-dpf stage in male PGCs, whereas female PGCs still remain hypomethylated. Cartoons representing expression patterns of the genes involved in DNA methylation and hydroxymethylation are shown on the lower panel.
The ground methylation state of 5 kb tiling probes for medaka PGCs range from 30% to 50% at 15-dpf, during which the global methylation reached the lowest level. As the processes of DNA methylation reprogramming during PGC specification only have been studied in mice and humans [Citation6–Citation11], we compared the ground methylation stage among three species. In the E13.5 mouse embryo, the level of genome methylation drops to 14% and 7% in male and female PGCs [Citation6], respectively. In the human embryo, the lowest methylation level is found at 10 to 11 weeks after gestation, with only 7.8% and 6.0% methylation in male and female PGCs, respectively [Citation9,Citation10]. These levels are lower than medaka 15-dpf PGCs. Since there is no information on epigenetic reprogramming of PGCs in other fish species, it is not possible at this moment to conclude if this methylation state is unique for medaka or is universal for fish in general. During epigenetic reprogramming of zebrafish embryos, the lowest methylation level has been reported to be 80% in oocytes; however, no demethylation occurs in cleavage stages after fertilization, which is unique and different from mammals and medaka [Citation26,Citation49,Citation50]. Tet1 and Tet2 function to regulate locus-specific methylation during PGC development [Citation51]. According to a recent study by Hill et al., Tet1 also functions as a transcription regulator during mouse gametogenesis by stimulating a set of germline reprogramming-responsive (GRR) genes that are critical in gamete generation and meiosis [Citation52]. Observations show that medaka tet1 is not expressed during PGC demethylation, while tet2 mRNAs remain abundant during demethylation stages, suggesting that tet2 may play a critical role in locus-specific methylation during the development of PGCs in medaka. Although the present study did not examine the dynamics of GRR gene expression, future investigation of the medaka PGC transcriptome, including the association of TETs with GRR genes, would explain the roles of tets in the specification of PGCs and gametogenesis in medaka. A number of recent studies have demonstrated that tets are sensitive to environmental stressors [Citation53–Citation55], suggesting the effects of tets in stressor responses are most likely mediated through epigenetic modifications both in germ cells and somatic tissues.
Transposable elements comprise 17.5% of the medaka genome, which is lower than the mouse genome (37%) and the human genome (45%) [Citation35,Citation44,Citation56]. In medaka PGCs, large portions of LINE, SINE and LTR are hypermethylated at 15-dpf, which are similar to the methylation pattern of intracisternal A particles (IAPs) in mice. As IAPs are not found in the medaka genome, LINEs, SINEs and LTRs may play a functional role in the transgenerational epigenetic inheritance of phenotypes in medaka. A gender-specific dynamic pattern was observed in PGCs at 25-dpf, during which RTE and Chapaev transposons remained demethylated in females, while the male PGCs begin to undergo de novo methylation, indicating the possibility for differential roles of TEs in female and male gametogenesis. Given the advantages of smaller genome size and comparatively low copy numbers of TEs [Citation35], medaka (Hd-rR strain) has great potential as a model for investigating the mechanisms underlying the roles of transposable elements in development, disease, and transgenerational inheritance.
CpG islands are not annotated in the latest medaka genome assembly (ASM223467v1), so we utilized a widely used method designed for other vertebrates to identify CGIs in medaka genome [Citation45,Citation46]. Medaka CGIs showed distinguishing dimorphisms. CGIs located on promoter regions continued to remain hypomethylated during reprogramming of PGCs, which is similar to the levels observed in mice and humans [Citation7], indicating their role in development of PGCs in a developing embryo. Approximately 25% of DMCGI’s shores or shelves overlapped with promoters, suggesting that a number of non-promoter CGIs located close to gene regions may function through remote cis-regulators. The majority of non-promoter CGIs remained hypermethylated during PGC reprogramming, suggesting that these regions might be carriers of epigenotypes in medaka.
Because PGCs are the only embryonic cells to transmit epigenetic changes to the next generations [Citation57], it is extremely important to establish a relationship between epigenetic reprogramming of PGCs and transgenerational inheritance of environmentally established epigenetic marks and the emergence of phenotypic traits in subsequent generations that were not directly exposed to environmental stressors. However, the mechanisms underlying the epigenetic inheritance of ancestral exposure effects are not clearly understood. When developing embryos are exposed to an environmental stressor, differential DNA methylation marks can be established in PGCs. Based on our and others’ findings of epigenetic reprogramming of PGCs, we propose the following possible mechanisms for transgenerational inheritance: 1) environmental stressor-induced DNA methylation marks are resistant to global erasure processes; 2) environmental stressor-induced DNA methylation marks are erased during reprogramming and are re-established during the de novo methylation process by yet unknown mechanisms; or 3) the genome uses other mechanisms (e.g., miRNAs or tRNAs) to memorize exposure-specific epigenetic marks that are finally incorporated during gametogenesis or the late stage of sperm packaging [Citation58,Citation59].
Given that PGCs undergo reprogramming of DNA methylation and histone marks, it is not clear if the reprogramming events clear out all environmentally established DNA methylation marks and establish a clean state. It is not clearly understood whether environmental chemicals induce DNA methylation marks that escape the reprogramming described herein. In mammals, the basic principles of epigenetic reprogramming in embryos and germ cells have been known and studied for many years; however, major aspects, including the dynamics of these processes and their role in the inheritance of phenotypic traits, remain enigmatic [Citation60,Citation61]. Understanding this process in another model organism opens the door for further investigation into the mechanisms underlying epigenetic reprogramming and inheritance of phenotypes. Furthermore, similarities in these epigenetic processes between human, mice, and medaka further strengthen the possibility for medaka to serve as an ideal model for comparative epigenetic and transgenerational inheritance research.
Conclusions
The present report performed a systematic study of genome-wide DNA methylation dynamics across key stages of PGC development during which epigenetic reprogramming occurs in medaka fish, elucidating dynamics of genome DNA demethylation and remethylation during PGC specification in medaka. PGCs undergo two phases of demethylation during epigenetic reprogramming. The global erasure of DNA methylation in PGCs is completed by 12-dpf. Genomic remethylation in PGCs starts at 25 dpf in males but not in females. Given that DNA methylation reprogramming processes are conserved among humans, mice, and medaka, biological processes concerning PGC development, totipotency, and transgenerational epigenetic inheritance can be further illustrated by studying them in medaka, and the present methylome database serves as a baseline for future studies.
Methods
Fish care and embryo collection
An Hd-rR strain of transgenic medaka with vasa-GFP [Citation62] was maintained and bred under standard conditions. Procedures for handling and using animals were approved by the Institutional Animal Care and Use Committee (IACUC #16-003) of the University of North Carolina, Greensboro. Briefly, several pairs of adult broodstock medaka were raised in 20-litre tanks on a light-dark cycle of 14 h:10 h with a recirculatory water system with an exchange of 25% water every 4 h. Tanks were siphon-cleaned periodically, and the water temperature was maintained at 26 ± 1°C. The eggs were collected immediately after fertilization, cleaned, and kept in embryo rearing solution at 26 ± 1°C in petri dishes. Only fertilized eggs were used for the study. Embryos that hatched within 10 days of fertilization were selected for the study. During the first 10 days of post-hatch development, juveniles were supplied with the ground food and thereafter with flake food twice and brine shrimp once a day. The embryos were staged by developmental time and morphology [Citation63]. At 25-dpf, each embryo was sexed by gonad morphology, differential numbers of GFP-positive PGCs under fluorescent microscopy, and the presence or absence of male-specific orange colouration on the body or by dmy PCR [Citation34].
Primordial germ cell isolation
To obtain purified PGCs, we used a Percoll gradient [Citation64,Citation65], combined with magnetic-activated cell sorting using an anti-GFRα-1 antibody [Citation66,Citation67]. This method was superior over FACS for the isolation of a pure population of PGCs from developing medaka because leucophores (yellow pigments) interfered with the FACS sorting process. To collect gonads, the trunk region was excised from medaka larva together with developing gonads and washed with DMEM containing antibiotics. Then, DMEM containing collagenase (0.5 mg/ml final) and DNase I (0.00005% final) was added to the tissue and incubated for 2 h with periodic pipetting and continuous but gentle shaking. Then, the cell suspension was filtered with a 40 μm filter and centrifuged at 600 x g for 15 min, washed, and suspended in DMEM (1% ES FBS).
After making a series of 100%, 50%, 25% and 12.5% Percoll gradients, the cell suspension was added onto the top of the Percoll gradient and centrifuged at 1,160 x g for 20 min at room temperature. PGCs concentrated between the 50% and 25% Percoll layers. A total of 1 ml of the intermediate layer, including a 50-25% Percoll border, was collected and transferred to a 1.5 ml tube. DMEM was added to fill the tube to full, pipetted, and centrifuged at 1,200 rpm for 5 min. After removal of supernatant, the purified cell pellet was resuspended in 1× PBS (with 0.1% BSA). Approximately 1–2 μg of monoclonal anti-GFRα antibody was added to the washed beads and incubated for 20 min at RT to prepare a Dynabead-antibody mixture. Ten microlitres of Dynabead-antibody mixture were added to the tube containing cell suspension in PBS, mixed gently, and allowed to react at room temperature for 10 min. The tube was then placed on a magnet to separate the beads from the cell suspension. The supernatant was discarded, and the cells with the beads were then washed with 1× PBS (with 0.1% BSA). The bead-Ab complex was washed three times with 1 mL of 1× PBS (with 0.1% BSA). The bead-Ab complex was resuspended in 0.4 mL of lysis buffer (Zymo Research) to separate beads from cells. After magnetic separation of beads, cell lysis buffer suspension was used for total RNA/DNA isolation.
Genomic DNA and total RNA extraction
Genomic DNA and total RNA from each PGC sample were extracted using an AllPrep DNA/RNA/miRNA Universal Kit (QIAGEN, Cat No: 80224) according to the manufacturer’s instructions and the procedure previously described elsewhere [Citation26]. Genomic DNA and total RNA were quantified using Nanodrop 2000 and stored at −80°C until further analysis.
MethylC-Seq library preparation and sequence analysis
Whole-genome bisulfite sequencing library preparation was described in a previous study [Citation26]. Briefly, libraries were prepared with NEBNext® Ultra™ II FS DNA Library Prep Kit (NEB, E6177) according to the user’s manual. For each sample, 100 ng genomic DNA was added with 0.5% unmethylated E. coli DNA. Prepared MethylC-Seq libraries were sequenced using an Illumina NextSeq 500 instrument at the DNA Sequencing Core of the University of Missouri–Columbia with a single-end 150 bp sequencing strategy. Bismark (Version: v0.19.0) was used to map bisulfite sequencing reads onto the medaka genome (Ensembl release-95) with default parameters [Citation68]. CpG methylation calls were analysed using SeqMonk software (Version 1.45.0). The gene annotation set was downloaded from Ensembl (Ensembl release 95). Repeat element sequences were downloaded from the UCSC Genome Browser [Citation69]. CGIs were identified using HMM and the R package makeCGI [Citation45,Citation46]. Details of the sequencing analysis can be found in the Supplemental Information section. Sequencing data reported in this paper have been deposited in the public database at NCBI Gene Expression Omnibus (GEO) under accession number GSE130002.
Gene ontology and pathway enrichment analysis
Gene ontology and pathway enrichment analyses were performed using the PANTHER Overrepresentation Test (Released 20190308) with the GO Ontology database (Released 2019-02-02) [Citation70–Citation72]. Gene Ontology (GO) terms in the biological processes (GO biological process complete), molecular functions (GO molecular function complete), cellular component (GO cellular component complete) and PANTHER Pathways annotation were selected. Fisher’s exact test followed by the false discovery rate (FDR) correction were used to determine significance. An FDR adjusted p-value < 0.05 indicates significantly enriched GO and pathway terms.
Real-time quantitative PCR and statistical analysis of mRNA data
The expression of genes involved in DNA methylation (dnmt1, dnmt3aa, dnmt3ba, dnmt3bb.1) and DNA demethylation (tet1, tet2, tet3) were examined by real-time qRT-PCR. The qRT-PCR method was described in the previous study [Citation26], and the primer sequences are provided in the Supplemental Information section. In brief, β-actin was used as an endogenous reference gene. Target gene expression was analysed by the 2−ΔΔCt method [Citation73]. qRT-PCR was performed using PowerUp SYBR™ Green Master Mix (Applied Biosystems, A25742) on a QuantStudio 3 Real-Time PCR System. Expression levels in all stages were normalized to the expression levels in the 25-dpf male PGCs. Statistical differences were determined using one-way ANOVA followed by Tukey’s multiple comparisons test. Data are presented as the mean ± standard error of the mean (SEM), and p < 0.05 was considered significant. Correlation coefficients were calculated to measure the correlation of methylation and gene expression.
Authors’ contributions
XW and RKB designed the research; XW performed the research; RKB contributed reagents/analytic tools; XW analyzed the data, and XW and RKB wrote the paper.
Accession number
Sequencing data reported in this paper has been deposited into the public 466 database at NCBI Gene Expression Omnibus (GEO) under accession number GSE130002.
Supplemental Material
Download MS Excel (12.7 KB)Supplemental Material
Download MS Word (1.7 MB)Acknowledgments
The authors thank Drs. Donald Tillitt and Frederick vom Saal from the U.S. Geological Survey and the Division of Biological Sciences at the University of Missouri, respectively, for invaluable suggestions throughout the experimental period. The authors thank the undergraduate and graduate students in the Bhandari Laboratory for their invaluable assistance in animal care and maintenance.
Disclosure statement
No potential conflict of interest was reported by the authors.
Supplementary material
The supplemental data for this article can be accessed here.
Additional information
Funding
Related Research Data
References
- Kass SU, Pruss D, Wolffe AP. How does DNA methylation repress transcription? Trends Genet. 1997;13:444–449.
- Li E, Beard C, Jaenisch R. Role for DNA methylation in genomic imprinting. Nature. 1993;366:362.
- Jähner D, Stuhlmann H, Stewart CL, et al. De novo methylation and expression of retroviral genomes during mouse embryogenesis. Nature. 1982;298:623.
- Iida A, Shimada A, Shima A, et al. Targeted reduction of the DNA methylation level with 5-azacytidine promotes excision of the medaka fish Tol2 transposable element. Genet Res (Camb). 2006;87:187–193.
- Reik W, Dean W, Walter J. Epigenetic reprogramming in mammalian development. Science. 2001;293:1089–1093.
- Seisenberger S, Andrews S, Krueger F, et al. The dynamics of genome-wide DNA methylation reprogramming in mouse primordial germ cells. Mol Cell. 2012;48:849–862.
- Kobayashi H, Sakurai T, Miura F, et al. High-resolution DNA methylome analysis of primordial germ cells identifies gender-specific reprogramming in mice. Genome Res. 2013;23:616–627.
- Guibert S, Forné T, Weber M. Global profiling of DNA methylation erasure in mouse primordial germ cells. Genome Res. 2012;22:633–641.
- Gkountela S, Zhang KX, Shafiq TA, et al. DNA demethylation dynamics in the human prenatal germline. Cell. 2015;161:1425–1436.
- Guo F, Yan L, Guo H, et al. The transcriptome and DNA methylome landscapes of human primordial germ cells. Cell. 2015;161:1437–1452.
- Tang WW, Dietmann S, Irie N, et al. A unique gene regulatory network resets the human germline epigenome for development. Cell. 2015;161:1453–1467.
- Skinner MK. Epigenetic transgenerational toxicology and germ cell disease. Int JAndrology. 2007;30:393–397.
- Skinner MK, Haque CG-BM, Nilsson E, et al. Environmentally induced transgenerational epigenetic reprogramming of primordial germ cells and the subsequent germ line. PloS One. 2013;8:e66318.
- Morgan HD, Sutherland HG, Martin DI, et al. Epigenetic inheritance at the agouti locus in the mouse. Nat Genet. 1999;23:314.
- Skinner MK, Manikkam M, Tracey R, et al. Ancestral dichlorodiphenyltrichloroethane (DDT) exposure promotes epigenetic transgenerational inheritance of obesity. BMC Med. 2013;11:228.
- Bhandari RK, Vom Saal FS, Tillitt DE. Transgenerational effects from early developmental exposures to bisphenol A or 17alpha-ethinylestradiol in medaka, Oryzias latipes. Sci Rep. 2015;5:9303.
- Wang X, Hill D, Tillitt DE, et al. Bisphenol A and 17α-ethinylestradiol-induced transgenerational differences in expression of osmoregulatory genes in the gill of medaka fish (Oryzias latipes). Aquatic Toxicol. 2019;211:227–234.
- Anway MD, Cupp AS, Uzumcu M, et al. Epigenetic transgenerational actions of endocrine disruptors and male fertility. science. 2005;308:1466–1469.
- Volkova K, Reyhanian Caspillo N, Porseryd T, et al. Transgenerational effects of 17alpha-ethinyl estradiol on anxiety behavior in the guppy, poecilia reticulata. Gen Comp Endocrinol. 2015;223:66–72.
- Guerrero-Bosagna C, Covert TR, Haque MM, et al. Epigenetic transgenerational inheritance of vinclozolin induced mouse adult onset disease and associated sperm epigenome biomarkers. Reprod Toxicol. 2012;34:694–707.
- Wolstenholme JT, Edwards M, Shetty SR, et al. Gestational exposure to bisphenol a produces transgenerational changes in behaviors and gene expression. Endocrinology. 2012;153:3828–3838.
- Wang SY, Lau K, Lai KP, et al. Hypoxia causes transgenerational impairments in reproduction of fish. Nat Commun. 2016;7:12114.
- Nilsson EE, Sadler-Riggleman I, Skinner MK. Environmentally induced epigenetic transgenerational inheritance of disease. Environ Epigenet. 2018;4:dvy016.
- Boskovic A, Rando OJ. Transgenerational epigenetic inheritance. Annu Rev Genet. 2018;52:21–41.
- Wittbrodt J, Shima A, Schartl M. Medaka—a model organism from the far East. Nat Rev Genet. 2002;3:53.
- Wang X, Bhandari RK. DNA methylation dynamics during epigenetic reprogramming of medaka embryo. Epigenetics. 2019;14:611–622.
- Bhandari RK. Medaka as a model for studying environmentally induced epigenetic transgenerational inheritance of phenotypes. Environ Epigenet. 2016;2:dvv010.
- Head J. An ecotoxicological perspective on transgenerational epigenetic inheritance. Environ Toxicol Chem. 2019;38:1149–1151.
- Carvan MJ 3rd, Kalluvila TA, Klingler RH, et al. Mercury-induced epigenetic transgenerational inheritance of abnormal neurobehavior is correlated with sperm epimutations in zebrafish. PLoS One. 2017;12:e0176155.
- Baker TR, King-Heiden TC, Peterson RE, et al. Dioxin induction of transgenerational inheritance of disease in zebrafish. Mol Cell Endocrinol. 2014;398:36–41.
- Papoulias DM, Noltie DB, Tillitt DE. An in vivo model fish system to test chemical effects on sexual differentiation and development: exposure to ethinyl estradiol. Aquatic Toxicol. 2000;48:37–50.
- Ishikawa Y. Medakafish as a model system for vertebrate developmental genetics. Bioessays. 2000;22:487–495.
- Nishimura T, Tanaka M. Gonadal development in fish. Sexual Dev. 2014;8:252–261.
- Matsuda M, Nagahama Y, Shinomiya A, et al. DMY is a Y-specific DM-domain gene required for male development in the medaka fish. Nature. 2002;417:559.
- Kasahara M, Naruse K, Sasaki S, et al. The medaka draft genome and insights into vertebrate genome evolution. Nature. 2007;447:714.
- Shinomiya A, Tanaka M, Kobayashi T, et al. The vasa‐like gene, olvas, identifies the migration path of primordial germ cells during embryonic body formation stage in the medaka, Oryzias latipes. Dev Growth Differ. 2000;42:317–326.
- Guo H, Zhu P, Yan L, et al. The DNA methylation landscape of human early embryos. Nature. 2014;511:606.
- Smith ZD, Chan MM, Humm KC, et al. DNA methylation dynamics of the human preimplantation embryo. Nature. 2014;511:611.
- Xu H, Li M, Gui J, et al. Fish germ cells. Sci China Life Sci. 2010;53:435–446.
- Kurokawa H, Aoki Y, Nakamura S, et al. Time‐lapse analysis reveals different modes of primordial germ cell migration in the medaka Oryzias latipes. Dev Growth Differ. 2006;48:209–221.
- Labbé C, Robles V, Herraez MP. Epigenetics in fish gametes and early embryo. Aquaculture. 2017;472:93–106.
- Qu W, Hashimoto S-I, Shimada A, et al. Genome-wide genetic variations are highly correlated with proximal DNA methylation patterns. Genome Res. 2012;22:1419–1425.
- Schartl M. A comparative view on sex determination in medaka. Mech Dev. 2004;121:639–645.
- Burns KH, Boeke JD. Human transposon tectonics. Cell. 2012;149:740–752.
- Wu H, Caffo B, Jaffee HA, et al. Redefining CpG islands using hidden markov models. Biostatistics. 2010;11:499–514.
- Irizarry RA, Wu H, Feinberg AP. A species-generalized probabilistic model-based definition of CpG islands. Mammalian Genome. 2009;20:674.
- Bestor TH. The DNA methyltransferases of mammals. Hum Mol Genet. 2000;9:2395–2402.
- Wu X, Zhang Y. TET-mediated active DNA demethylation: mechanism, function and beyond. Nat Rev Genet. 2017;18:517–534.
- Jiang L, Zhang J, Wang -J-J, et al. Sperm, but not oocyte, DNA methylome is inherited by zebrafish early embryos. Cell. 2013;153:773–784.
- Potok ME, Nix DA, Parnell TJ, et al. Reprogramming the maternal zebrafish genome after fertilization to match the paternal methylation pattern. Cell. 2013;153:759–772.
- Vincent JJ, Huang Y, Chen P-Y, et al. Stage-specific roles for tet1 and tet2 in DNA demethylation in primordial germ cells. Cell Stem Cell. 2013;12:470–478.
- Hill PW, Leitch HG, Requena CE, et al. Epigenetic reprogramming enables the transition from primordial germ cell to gonocyte. Nature. 2018;555:392.
- Smith CM, Vera MK, Bhandari RK. Developmental and epigenetic effects of roundup and glyphosate exposure on Japanese medaka (Oryzias latipes). Aquatic Toxicol. 2019;210:215–226.
- Liu Y, Zhang Y, Tao S, et al. Global DNA methylation in gonads of adult zebrafish Danio rerio under bisphenol A exposure. Ecotoxicol Environ Saf. 2016;130:124–132.
- Jefferson WN, Chevalier DM, Phelps JY, et al. Persistently altered epigenetic marks in the mouse uterus after neonatal estrogen exposure. Mol Endocrinol. 2013;27:1666–1677.
- Consortium MGS. Initial sequencing and comparative analysis of the mouse genome. Nature. 2002;420:520.
- Sasaki H, Matsui Y. Epigenetic events in mammalian germ-cell development: reprogramming and beyond. Nat Rev Genet. 2008;9:129.
- Chen Q, Yan W, Duan E. Epigenetic inheritance of acquired traits through sperm RNAs and sperm RNA modifications. Nat Rev Genet. 2016;17:733.
- Sharma U, Sun F, Conine CC, et al. Small RNAs are trafficked from the epididymis to developing mammalian sperm. Dev Cell. 2018;46:481–94. e6.
- Messerschmidt DM, Knowles BB, Solter D. DNA methylation dynamics during epigenetic reprogramming in the germline and preimplantation embryos. Genes Dev. 2014;28:812–828.
- Iqbal K, Tran DA, Li AX, et al. Deleterious effects of endocrine disruptors are corrected in the mammalian germline by epigenome reprogramming. Genome Biol. 2015;16:59.
- Tanaka M, Kinoshita M, Kobayashi D, et al. Establishment of medaka (Oryzias latipes) transgenic lines with the expression of green fluorescent protein fluorescence exclusively in germ cells: a useful model to monitor germ cells in a live vertebrate. Proc Nat Acad Sci. 2001;98:2544–2549.
- Iwamatsu T. Stages of normal development in the medaka Oryzias latipes. Mech Dev. 2004;121:605–618.
- Lacerda S, Batlouni S, Silva S, et al. Germ cells transplantation in fish: the nile-tilapia model. Anim Reprod. 2006;3:146–159.
- De Felici M, McLaren A. Isolation of mouse primordial germ cells. Exp Cell Res. 1982;142:476–482.
- Gassei K, Ehmcke J, Dhir R, et al. Magnetic activated cell sorting allows isolation of spermatogonia from adult primate testes and reveals distinct GFRa1‐positive subpopulations in men. J Med Primatol. 2010;39:83–91.
- Gassei K, Ehmcke J, Schlatt S. Efficient enrichment of undifferentiated GFR alpha 1+ spermatogonia from immature rat testis by magnetic activated cell sorting. Cell Tissue Res. 2009;337:177–183.
- Krueger F, Andrews SR. Bismark: a flexible aligner and methylation caller for bisulfite-seq applications. bioinformatics. 2011;27:1571–1572.
- Casper J, Zweig AS, Villarreal C, et al. The UCSC genome browser database: 2018 update. Nucleic Acids Res. 2017;46:D762–D9.
- Ashburner M, Ball CA, Blake JA, et al. Gene ontology: tool for the unification of biology. Nat Genet. 2000;25:25.
- Consortium GO. The gene ontology resource: 20 years and still GOing strong. Nucleic Acids Res. 2018;47:D330–D8.
- Mi H, Huang X, Muruganujan A, et al. PANTHER version 11: expanded annotation data from gene ontology and reactome pathways, and data analysis tool enhancements. Nucleic Acids Res. 2016;45:D183–D9.
- Livak KJ, Schmittgen TD. Analysis of relative gene expression data using real-time quantitative PCR and the 2− ΔΔCT method. methods. 2001;25:402–408.