
ABSTRACT
In human tumours, the crosstalk between cancer cells and their microenvironment is involved in tumour progression, metastasis and resistance to anti-cancer therapies. Among the factors involved in this exchange of information pro-inflammatory cytokines seem to play a crucial role. We observed that a group of pro-inflammatory cytokines, interleukin 6 (IL6), interleukin 1-beta (IL1b), and tumour necrosis factor-alpha (TNFa), preferentially activated genes exhibiting a high basal methylation level at their transcription start sites, in the human breast cancer cell line MCF7. In human breast tumours, these responding genes were also hypermethylated, and some of them (N = 104) were differentially methylated across human breast tumour samples (The Cancer Genome Atlas cohort). While their expression was positively correlated with the stromal content of the tumours and the expression of stromal-associated pro-inflammatory cytokines, the expression of this subset of genes was negatively correlated with their methylation level at their 5ʹ end. Nevertheless, while the methylation level of this subset of genes was not correlated with the stromal cell content of the tumours, this negative correlation was partially lost in tumours with high stromal cell content. Consistently, we observed that the methylation level in this subset of genes influenced the correlation between gene expression and stromal cell content. Thus, these data indicated that the stromal component of breast tumours should be taken into account for DNA methylation and gene expression studies and suggest an additional pathway, via DNA methylation, in the cross-talk between cancer cells and their microenvironment in human breast cancers.
Introduction
Cancer tissues are not just the result of an accumulation of cancer cells but a ‘complex organ’ composed of different cellular subtypes, including immune cells, vascular endothelial cells and fibroblast [Citation1]. This heterogeneous mix of cells is involved in dynamic processes; their interactions between each other and cancer cells leading to the appearance of phenotypically modified cells. Exchanges of information between the immune/stromal components and cancer cells promote tumour progression, metastasis and resistance to anti-cancer therapies [Citation2–Citation7]. In human breast tumours, the molecules secreted by the activated fibroblasts (cancer-activated fibroblasts, CAFs), the predominant part of the stromal cell types [Citation8], are directly involved in the fine-tuning regulation of gene expression in cancer cells. Data obtained from the breast cancer cell lines SKBR3 and AU565 exposed to molecules secreted by CAFs have underlined these mechanisms [Citation9]. In this experimental model CAF conditioned media induced the expression of many genes and 373 genes of which were upregulated in both cell lines. Despite that these genes being hypermethylated at their 5ʹ end, when compared with non-responsive genes and epigenetically controlled, this upregulation was not mediated through their demethylation, suggesting that exposure to CAF secreted molecules counteracted the repressive effect of DNA methylation [Citation9]. CAFs secrete a plethora of molecules including various growth factors, cytokines, proteases, and extracellular matrix components [Citation10–Citation17]. While downregulated genes and genes not affected by CAFs conditioned media were not associated with statistically significant KEGG pathways, the cytokine-cytokine receptor interaction and the Jack-STAT signalling pathways were identified in the top 5 of the KEGG pathway, enriched in upregulated genes, suggesting that cytokines participate in the upregulation of these hypermethylated genes [Citation9].
To investigate the potential relationship between cytokine exposure and the upregulation of methylated genes in an independent model, we analysed the transcriptome of a breast cancer cell line, MCF7, treated with 3 of the major pro-inflammatory cytokines (interleukin 6, (IL6) interleukin 1-beta (IL1b), and tumour necrosis factor-alpha (TNFa)) secreted by stromal cells [Citation18,Citation19] from publicity available data. The association between high initial DNA methylation level at transcription start site (TSS) regions and the genes responding to cytokine treatments was determined from Illumina-Methylation-450-Bead-Chip and whole-genome bisulphite sequencing data of untreated MCF7 cells. Since these data may be of interest for the understanding of the pathophysiology of the human breast cancers, we extended this study to a human breast cancer cohort (TCGA databank). The diversity of DNA methylation patterns in human cancer cells offered the opportunity to investigate the crosstalk between cytokine-activated genes, their methylation levels and their in vivo response to their microenvironment.
Results
Identification of genes upregulated in response to the pro-inflammatory cytokines, Il6, Il1b, and TNFa, in the human breast cancer cell line MCF7
Previous analyses of genes upregulated by CAF conditioned media suggested that cytokines secreted by CAFs preferentially impact genes exhibiting a high methylation level at their 5ʹ end [Citation9]. To gain further insight into this process, we first identified genes upregulated by specific cytokines in an independent model. MCF7 cells were chosen since this breast cancer cell line has been widely studied for expression, DNA methylation and response to many factors, and therefore extensive public datasets are available and can be compared with the large number of breast tumour samples from TCGA databank.
Among the molecules secreted by the tumoural microenvironment, pro-inflammatory cytokines play a major role in tumour progression and drug resistance [Citation20–Citation23] thus orienting our selection of cytokines to be analysed towards the interleukins IL6, IL1b, and TNFa. Furthermore, we chose the insulin growth factor (IGF) as a control. We then analysed the expression patterns of MCF7 cells treated with these factors (Supplementary Table 1). Differential expression was determined from RNAseq and array data using Cuffdiff [Citation24] and GEO2R (http://www-ncbi-nlm-nih-gov.gate2.inist.fr/geo/geo2r/), respectively. Genes with very low levels of expression (FPKM < 0.5) were filtered out.
From the 14,043 genes retained, we identified 121 genes upregulated (fold change (FC) ≥ 2, false discovery rate (FDR) < 0.05) and 2286 unaffected genes (0.9 < FC <1.1) upon IL6 treatment, 262 upregulated genes and 5159 unaffected genes upon IL1b, and 373 upregulated genes and 4135 unaffected genes upon TNFa treatments (Supplementary Table 2). Upregulated genes used to compile a list of 595 genes upregulated by at least one cytokine (FC2-pool-list) and control genes were pooled in a list of 3162 genes unaffected by at least 2 cytokines (FC1-pool-list) (Supplementary Table 2).
DNA hypermethylation at TSS regions of genes upregulated upon IL6, IL1b, and TNFa treatments, in MCF7 cells
To define the regions of interest we compared the DNA methylation patterns and chromatin modifications of genes classified according to their response to specific molecules, in MCF7 cell line. As a first screen, DNA methylation density at TSS regions (TSS ± 2 Kb), before exposure to cytokines, of the FC1 and FC2-pool-list of genes was visualized using a heat map constructed from whole-genome bisulphite sequencing (WGBS) of unstimulated MCF7 cells [Citation25] ()). TSS regions of upregulated genes were enriched in 5-mC when compared with unaffected genes or all TSS regions, while, gene bodies were methylated at a similar level in up or unaffected genes ()); this hypermethylation was not observed for genes upregulated (311 genes, versus 4680 unaffected genes, Supplementary Table 3) by insulin growth factor (IGF) ()). In addition, we tested the anti-inflammatory cytokine tumour growth factor (TGFb) using the same strategy. Since only a few genes were upregulated by TGFb treatment in MCF7 cells, we also analysed the genes upregulated by this cytokine in another breast cell line, MCF10A, and in HepG2 cells (a human hepatocellular carcinoma cell line) (Supplementary Table 4). While we identified a relatively high number of upregulated genes (615 and 221 in MFCF10A and HepG2, respectively) upon TGFb exposure (only a few genes (13) were shared by these two groups, Supplementary Table 4), hypermethylation was not observed (Supplementary Figure 1) at the TSS regions of these. Thus, high level of DNA methylation at TSS regions is not a general characteristic of genes upregulated by cytokine exposures.
Figure 1. Epigenetic modifications of genes responding to the pro-inflammatory cytokines IL6, IL1b, and TNFa, in MCF7 cells.
Genes were classified as upregulated (FC ≥2, FDR < 0.05), unaffected (0.9 < FC < 1.1) and all-TSS for all expressed genes (rpkm > 0.5) when compared with the untreated MCF7 cells. IL6-IL1b-TNFa, pool of genes responding either to IL6, or IL1b, or TNFa; IGF, genes responding to IGF treatment. In red, upregulated genes; green unaffected genes; blue, all genes. a. DNA methylation density at TSS ± 2 kb regions of genes expressed, upregulated or unaffected by cytokine exposure, in MCF7; when a gene is associated with several TSS, all the TSS were kept for the construction of the heat map. b. DNA methylation density over the entire gene body of upregulated and unaffected by IL6, IL1B, and TNFa treatments, in MCF7 cells. c. Density of histones marks and DNA hypersensitivity sites within the ± 2 kb regions surrounding the TSS of genes in each subclass; IL6-IL1b-TNFa, pool of genes responding either to IL6, or IL1b, or TNFa; IGF, genes responding to IGF treatment.
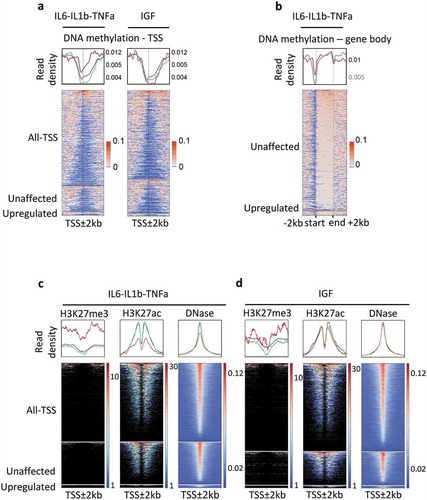
In addition, we observed that the basal density of repressive marks (H3K27me3) at TSS regions of genes upregulated by pro-inflammatory cytokines was also higher than the H3K27me3 at unaffected genes ()). Consistently, the density of permissive marks (H3K7ac and DNase sensitivity sites) was lower in the TSS regions of upregulated genes ()). As expected from DNA methylation data, these differences were not observed for the genes upregulated by IGF, in MCF7 cells ()), indicating that the hypermethylation of genes responding to pro-inflammatory cytokines was associated with the presence of repressive epigenetic marks.
TSS regions of genes upregulated upon IL6, IL1b, and TNFa treatment in MCF7 cells are hypermethylated: Infinium HumanMethylation450K BeadChip data analysis
In order to compare our findings in MCF7 cells with tumour tissues from TCGA databank, we also investigated the methylation levels of these regions using DNA methylation data for MCF7 cells obtained through bisulphite modification and analysis on Infinium HumanMethylation450K BeadChip (Supplementary Table 1). To confer the same weight to each CpG, only the distance to the proximal TSS was retained, using the annotation of Illumina manifest (http://emea.support.illumina.com/) for gene probes annotation. As observed from WGBS data, TSS regions of the genes upregulated by each pro-inflammatory cytokines, namely IL6, IL1b, and TNFa, were found hypermethylated (–), thus hypermethylation of responsive genes was observed for each pro-inflammatory cytokine analysed.
Figure 2. Hypermethylation of shore regions of genes upregulated upon IL6, IL1b, and TNFa treatments, analysis from Infinium HumanMethylation450K BeadChip data.
Genes were classified as upregulated (FC ≥ 2, FDR < 0.05), unaffected (0.9 < FC < 1.1) and all-TSS for all expressed genes (rpkm > 0.5) when compared with the untreated MCF7 cells. a to d. Average of the DNA methylation level (β-values) of ‘upregulated’ (red lines) and ‘unaffected’ (green lines) genes according to their distance from their TSS, for each CpG, only the distance to the proximal TSS was retained, using the annotation of the Illumina manifest for probes annotation. e to h. Violin plots depicting the DNA methylation density at specific genomic features, DNA methylation level (β-values) of ‘upregulated’ (red violins) and ‘unaffected’ (green violins) genes, CpG islands (CGi), shore regions (Shore), shelf regions (Shelf) and not associated with a specific genomic feature (NA); black point, median value (****p-value < 0.0001, *p-value < 0.05, Welch t-test).
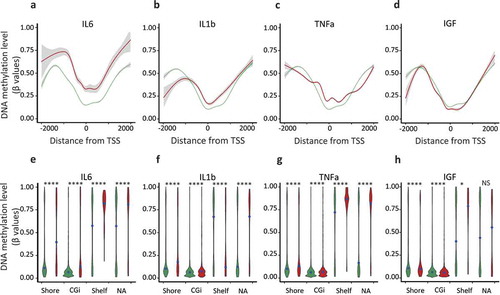
The analysed regions were then restricted to TSS ± 1kb, the major discriminant regions (see –, and to compare similar genomic features, the CpG probes were subdivided, according to their location, into CpG islands (CGi), shore regions (Shore, sequences up to 2 kb distant to CGi), shelf regions (Shelf, sequences < 2kb flanking outwards from a shore) and not associated with a specific genomic feature (NA), according to the Illumina manifest. CGis and Shores associated with proinflammatory cytokine-responsive genes were more methylated than their corresponding sequences in unaffected genes (Shelves and NA were not discriminant regions, Welch t-test, Supplementary Table 5), while, the genes upregulated by IGF were hypomethylated when compared with the unaffected genes (Welch t-test, Supplementary Table 5).
Shore regions have been found to be preferential sites for DNA methylation alterations in cancers and to be closely associated with the level of gene expression [Citation26,Citation27]. Furthermore, the density of DNA methylation at shore regions of genes upregulated by the pro-inflammatory cytokines differed from that of unaffected genes across all data sets (–), suggesting that IL6, IL1b, TNFa treatments interfered with the relationship between DNA methylation and gene expression.
Genes upregulated by IL6, IL1b, and TNFa are hypermethylated at shore regions, in human breast tumour samples
Due to the discriminatory capacity of DNA methylation at pro-inflammatory target shores regions shown above, and owing to the close association between shore DNA methylation and gene expression level [Citation26,Citation27], we focused on the shore regions identified through MCF7 cell treatments in the analysis of human breast cancers samples (TCGA databank). A large proportion of the genes identified from differential expression analyses of MCF7 cells treated with IL6, IL1b, and TNFa were retained, since more than 60% of the genes harboured a shore at their TSS regions (63% and 70% of the upregulated genes and unaffected genes, respectively). For each gene, we determined the mean methylation level of the CpG spanning the shore regions in order to avoid an over-representation of some genes, since the number of CpG probes per shore region can differ between genes, on the Illumina HumanMethylation450K BeadChip. Furthermore, this approach allowed a comparison based on similar genomic features.
Upregulated genes, identified inMCF7 cells, were also found hypermethylated, in TCGA data at shore sequences located at ± 1 kb of their TSS (mean beta-values: 0.2818861 and 0.2164017, respectively, Welch t-test, p-value < 2.2−[Citation16]) when compared with the unaffected genes ()), corroborating our findings in MCF7 cells.
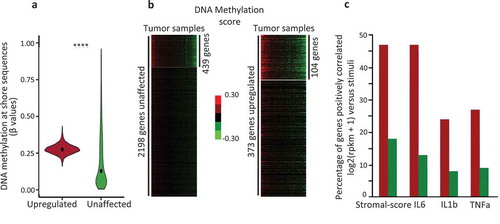
Figure 3. The genes upregulated by IL6, IL1b, and TNFa are hypermethylated at shore regions, in human breast tumour samples.
a. Violin plot depicting the DNA methylation level at shore sequence located at TSS ± 1kb region of genes identified through MCF7 cells treated with IL1, IL1b, and TNFa in human breast tumours (N = 775); upregulated, red box, genes expressed at least twofold more after either IL1, or IL1b, or TNFa treatments; green box, unaffected genes exhibiting an FC > 0.9 and < 1.1, in MCF7 cells (****p-value < 0.0001, Welch t-test); b. K-means clustering and heat maps of DNA methylation at Shore (TSS ± 1 kb) of upregulated genes (N = 373) and unaffected genes (N = 2,198), 104 (FC2 group) and 439 (FC1 group) differentially methylated genes were identified in the tumours analysed (N = 775). c Percentage of genes with an expression level correlated with either the stromal content of the tumour (stromal-score), IL6, or IL1b, or TNFa; red bars, FC2 group; green bars, FC1 group; from normalized expression values, Spearman’s rank correlation, rho ≤ −0.20, adjusted p-value ≤ 0.05 (Bonferroni method for multiple testing corrections), from normalized expression values.
To investigate the potential relationship between DNA methylation and gene expression we searched for genes differentially methylated at shore regions across tumour samples, taking advantage of the diversity of DNA methylation patterns in human breast tumours.
From K-means clustering of FC2 and FC1-pool-list, we identified a subset of differentially methylated genes, FC2 (n = 104) for the upregulated genes and FC1 (n = 439) for the unaffected genes ()), across tumour samples.
Since the stromal component is a major element in the secretion of cytokines, the stromal cell contents of the tumours were evaluated using the Stromal-score from ESTIMATE method [Citation28]. It should be noted that only one gene (CXCL14) of the FC2 group belonged to the gene list of stromal or immune signature [Citation28] and the FC2 group did not define a specific cellular type (Enrich, Human Gene Atlas, http://amp.pharm.mssm.edu/).
Among the breast cancers analysed (n = 771), expression of 47% of FC2 genes was correlated (spearman rho ≥ 0.2, adjusted p-value ≤ 0.005) with the stromal content, 47% with the expression level of IL6, 24% with the expression level of IL1b, and 27% with the expression level of TNFa, respectively ()). Most of the genes with an expression level positively correlating with the expression of these 3 cytokines, also exhibited a positive correlation with the stromal-score (Supplementary Figure 2).
Thus, these sub-groups offer an in vivo model for investigating the potential relationship between DNA methylation and gene response to tumour microenvironment, not biased by experimentally induced DNA methylation level alterations.
Expression of the FC2 genes is correlated with the stromal cell content of the human breast tumours
Prior to investigating the associations between expression, methylation, and stromal content, we ruled out a potential link between shore DNA methylation and tumour stromal-score. Indeed, correlation tests indicated that the mean methylation levels at shore sequences of FC2 and FC1 groups were not associated (Mann Whitney test, adjusted p-value 0.71 and 0.74, respectively) with the stromal content of the tumours ()). Thus, the stromal cell content of tumours did seem to interfere with the DNA methylation levels of the genes analysed.
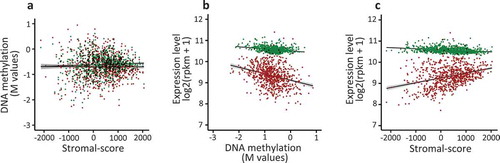
Figure 4. The expression of the FC2 genes is correlated with the stromal cell content of the human breast tumours.
The breast tumour samples (n = 775) from TCGA databank were analysed in order to investigate the correlation between DNA methylation, stromal-score and gene expression level. a. For each tumour, mean DNA methylation level at Shores was normalized (log2(β/1- β)) and plotted against the stromal-score of the corresponding tumour; red points, FC2 group (Spearman’s test, rho = −0.025, p-value = 0.493); green points, FC1 group (rho = 0.024, p-value = 0.510). b. As in a, normalized mean expression level was plotted against mean DNA methylation; red points, FC2 group (Spearman’s test, rho = −0.328, p-value < 2.2e-16); green points, FC1 group (rho = −0.252, p-value = 9.924e-13). c. As in a, normalized mean expression level was plotted against the stromal-score; FC2 group (Spearman’s test, rho = 0.325, p-value < 2.2e-16); green points, FC1 group (rho −0.322, p-value < 2.2e-16).
Since DNA methylation is an epigenetic mark of gene repression, the expression of these genes versus their methylation level was determined. The mean level of expression of these genes was negatively correlated with their DNA methylation level at shore sequences located in TSS regions ()), suggesting that DNA methylation was indeed correlated with their repression.
Nevertheless, the expression of FC2 genes was positively correlated with the tumour stromal score, while this positive correlation was not observed for FC1 genes ()). In line with these observations, classification of the tumour samples into five quantiles according to their stromal score indicated that all quintiles exhibited similar mean DNA methylation levels at shore sequences, while the mean expression level of these genes was higher in the first quantile (lowest Stromal-score) than in the other quantiles (Supplementary Table 6 and Supplementary Figure 3). This global evaluation of the cross-talk between DNA methylation, gene expression and microenvironment suggest that for many genes of the FC2 group the stromal cell content of the tumour counteracted the repressive effect of DNA methylation. Thus, this potential relationship was examined at the individual gene level.
Tumour microenvironment impacts the relationship between DNA methylation and gene expression, in human breast cancer
The global DNA methylation analysis of genes upregulated by pro-inflammatory cytokines suggested that the stromal content of the tumours altered the repressive effect of their methylation. To validate this hypothesis, we determined the association between gene expression and stromal score according to the methylation level of each gene.
Tumours were divided into five quantiles according to their mean DNA methylation level at shore sequences located near the TSS (± 1kb), for each gene of the FC2 group. Then, the correlation between gene expression and stromal score was determined for each gene within of the group of tumours harbouring the less methylated genes (first quintile) and the highest methylated genes (fifth quintile).
The expression of a higher number of genes (48%) was positively correlated (spearman test, rho ≥ 0.2) with the stromal index in the fifth quintile when compared to the first quintile (26%), the less methylated group of tumour ()). Moreover, the strength of this correlation, evaluated from a linear model, was also higher in the fifth quintile than in the first quintile ()). These data indicated that the expression level of the genes analysed was associated with the stromal cell content of the tumours and their methylation level at shore sequences. However, to exclude a potential bias due to an over/under-representation of methylated genes in the tumours harbouring a high stromal score, we determined for each gene the potential association between their methylation level and the stromal cell content of the tumours. The methylation level of the individual genes of the FC2 group of genes was not correlated with the stromal-score (), Supplementary Figure 4). Furthermore, the methylation level of these genes was not significantly different in the first and fifth quintile (median value, 0.369 and 0.364, respectively; Mann Whitney test, p = 0.872) (Supplementary Table 6 and Supplementary Figure 3).
Figure 5. Tumour microenvironment impacts the relationship between DNA methylation and gene expression, in human breast cancer.
a. Tumours (TCGA databank, N = 775) were classified in quintiles according to the mean DNA methylation level for each gene of the FC2 group; Pearson correlation coefficients (rho) between the normalized expression of each gene and the stromal-score plotted against the adjusted p-value; blue points, the most methylated tumours (fifth quintile); yellow points, the least methylated tumours (first quintile); vertical dashed line, rho = 0.2; horizontal dashed line, q-value = 0.05. b. Slope of the correlation shown in a; for each gene, a linear model was used; red bars, fifth quintile; blue bars, first quintile. c. Correlation matrix between DNA methylation (M-values) and stromal-score for individual genes. d. Venn diagram depicting the overlap between the genes (FC2 group) harbouring a negative correlation between their expression and their DNA methylation level at their 5ʹ end shore sequences according to the stromal cell content of the tumour. Tumours were divided into quintiles according to their stromal-score; only the highest and lowest scores are shown.
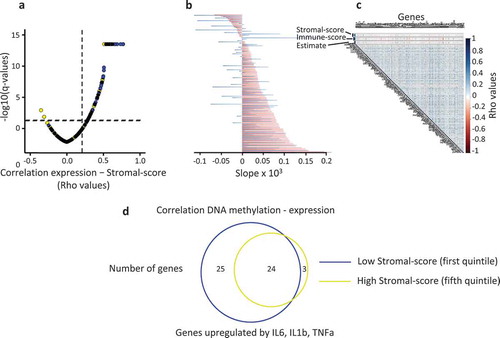
Altogether, these data suggested that the stromal cell content altered the negative correlation between DNA methylation and gene expression. Thus, we determined whether the percentage of genes exhibiting this negative correlation was associated with the stromal cell content of the breast tumours. Breast tumour samples were classified in quintiles according to their stromal-score, and we observed that the percentage of genes negatively correlated with their methylation level was higher in the first (low stromal-score) than in the fifth quintile (high stromal-score) (48% and 26%, respectively, spearman test, rho ≤ −0.2, adjusted p-value < 0.05) ()). Thus, the stromal cell component of tumours interfered with the repressive effect of DNA methylation at the level of individual genes analysed.
Mechanistic insight into this cytokine-induced upregulation of hypermethylated genes
While the stroma is the major component of the tumour microenvironment of human breast tumours [Citation28], we investigated for a potential bias induced by the immune cell content of tumour samples. The correlation between immune score, obtained from ESTIMATE method [Citation28], and DNA methylation was determined. Although for a small number of genes (n = 28), a negative correlation (spearman test, rho ≤ −0,2, adjusted p-value < 0.005) was observed, only 15 of these genes was included in the list of the 50 genes upregulated according to the stromal cell content of the tumour samples. In addition, the immune component appeared to be a minor component in breast cancers [Citation28], thus it is unlikely that it interferes with the relationship between gene expression and the tumour stromal cell content.
To gain further mechanistic insight, we then screened for potential transcription factors (TF) binding sites at 5ʹ end DNA sequences (TSS ± 1 kb) of FC2 group versus FC1 group of genes. Using RSAT scan module [Citation29], we identified several TFs (Supplementary Table 7) and some of them known to preferentially bind methylated sequences [Citation30]. Since these TFs have pleiotropic effects, these data suggest that the upregulation of the FC2 group was not mediated through the recruitment of a specific TF, while the loss of transcriptional repressors cannot be excluded. In line with this latter hypothesis, we have previously observed that the loss/gain of the methyl-CpG binding protein domain 2 (MBD2) at specific loci is associated with the regulation of some genes upon transformation or external signals [Citation9,Citation31].
Discussion
Thus, we reveal that the expression of genes identified following the treatment of MCF7 cells with pro-inflammatory cytokines IL6, IL1b, and TNFa is associated with the expression of these cytokines in human breast cancers. The presence of stromal cells, major source of cytokines, has the strongest effect on the upregulation of the responding genes and counteracts, at least partially, the repressive effect of DNA methylation at their shore sequences. Our data also highlight that the stromal cell content of the tumours should be taken into account when the relationship between gene expression and DNA methylation is analysed in human tumours, depending on the set of genes analysed.
The involvement of the pro-inflammatory cytokines IL1, Il6b, and TNFa in tumour progression, drug resistance, and metastasis has been described in many cancer types [Citation32]. These molecules modulate gene expression of cancer cells and are produced by both the tumour cells and stromal cells, in many cancers. The description of the genes responding to the cytokines is, therefore, of interest, since their expression level seems to be directly related to the pathophysiology of human cancers and may help in the understanding of the mechanisms of these cytokines in the tumorigenic process [Citation33].
Breast tumours are heavily infiltrated by non-tumour cells [Citation28,Citation34], and the breast cancer cell line, MCF7, has been extensively studied for their response to pro-inflammatory cytokines [Citation32]. Our study took advantage of the extensive publicly available data both on MCF7 cells and human databanks (TCGA) to identify genes responding to these cytokines, and analyse their expression and epigenetic modifications.
WGBS and Illumina’s BeadArray assays indicated that genes upregulated by the pro-inflammatory cytokines harboured a high level of DNA methylation at their 5ʹend when compared with the non-responding genes or the bulk of genes, in MCF7 cells. This hypermethylation was particularly observed at the shore sequences (sequences flanking the CGi), suggesting an epigenetic regulation of the responding-genes. Aberrant hypermethylation of CGi associated with gene silencing has been frequently observed in many cancers [Citation35–Citation37]; however, DNA methylation alterations (hyper/hypomethylation) of shore sequences are also frequently observed in cancers and closely associated with the level of gene expression [Citation26,Citation27]. Therefore, we focused on shore sequences for the analysis of human breast tumour samples (TCGA databank), this strategy offering the advantage of comparing genes from a common feature basis.
The genes upregulated by pro-inflammatory cytokines, in the MCF7 cell line, were also hypermethylated (compared with the non-responding genes) in human breast tumours. K-means clustering of the DNA methylation data defined groups of differentially methylated genes among the tumour samples, offering a model an in vivo model for investigating the potential relationship between DNA methylation and gene response to external signals, not biased by experimentally induced alterations in DNA methylation.
A large part (about 50%) of the responding genes, differentially methylated in breast tumours (FC2 group, n = 104), exhibited an expression level which correlated with the stromal cell content of the tumour and the expression of the pro-inflammatory cytokines, indicating that stromal cells played a major role in the response of this subset of genes to pro-inflammatory cytokines. In line with this observation, it has been shown that cancer-associated fibroblasts are the major cell source of IL-6 in the tumour microenvironment of gastric cancer [Citation38]. Similar to IL-6, TNFa is produced by numerous cell types, including immune cells, fibroblasts and tumour cells, in human breast tumours [Citation32]. In addition, cell contact plays an important role in the response to these cytokines, as, for instance, the transmembrane form of TNF is superior to soluble TNF in activating their receptors [Citation39].
An increase of the expression of FC2 is associated with the stromal cell content of the breast tumours, in the TCGA-cohort analysed. This positive correlation was observed not only when the expression level of each was compared with the stromal cell content but also when we analyse the mean expression of these genes, suggesting a co-regulation of the genes responding to pro-inflammatory cytokines, in human breast tumours.
For each FC2 gene, the correlation between methylation levels and stromal cell content on gene expression was investigated by assigning samples either to the highest or lowest ‘20% DNA methylation level’. Thus, we observed that the transcriptional response of the FC2 genes to the stromal cell content of the tumours is associated with their methylation levels at shore sequences, suggesting that the repressive effect of the DNA methylation is counteracted, at least partially, by the presence of stromal cells. In line with this hypothesis, the significant negative correlation between gene expression and DNA methylation level was observed to a lesser extent in tumours with a high stromal-score (27 genes) than those with a lower stromal-score (49 genes).
A large amount of data about the potential relationship between DNA methylation and gene expression has been accumulated over the past 30 years. Most of these studies associate a high methylation level at the 5ʹ end of the genes and with their transcriptional repression [Citation40]. However, alterations of DNA methylation are not a prerequisite for a modification of a transcriptional program, as, for instance, transdifferentiation of B cell to macrophage can occur without DNA methylation changes [Citation41], and we have previously observed that soluble factors secreted by CAFs modulate gene expression in cell lines, without inducing modification of the DNA methylation patterns of responsive genes [Citation9].
Pioneering studies have established that the methylation of templates does not prevent transcription in vitro[Citation42], while methylated vectors are not transcribed in the living cell [Citation43,Citation44], suggesting that proteins associating methylated CpGs may be necessary for the repression of methylated genes. This hypothesis has been validated by the discovery of several families of proteins that recognize methylated DNA with no or weak sequence specificity [Citation45]. Among the three families identified so far, the Methyl-CpG-Binding protein Domain proteins (MeCp2, MBD2, and MBD4) have extensively studied [Citation46] and have been associated with the repression of the transcription [Citation47], while these proteins may also play a role in the transcriptional activation of some genes [Citation48,Citation49].
MBD proteins may also modulate gene expression in the absence of DNA methylation changes. In mice, TFF2 is expressed in duodenum and silenced in colon, while this gene is methylated in both tissues. This tissue-specific repression is correlated with the tissue-specific presence of MBD2 at TFF2 promoter and MBD2 deletion leads to TFF2 upregulation in colon [Citation50], suggesting that the dynamics of MBD2 binding has a direct effect on gene transcription. In human cell lines, during the in vitro transformation of immortalized human mammary cells, and for many genes, their down-regulation is not driven by DNA hypermethylation but by the redistribution of MBD2 across methylated regions [Citation31]. Dynamics of MBD2 deposition across methylated DNA, linked to changes in gene expression, has also been observed in human cell lines exposed to CAF secreted factors [Citation9]. Thus, it cannot be excluded that the MBD2 deposition was modulated by the microenvironment of the tumours, leading to changes in the expression of genes responding to the stromal cell content of the human breast tumours.
DNA methylation at specific sites may also inhibit the binding of transcription factors leading to a downregulation of the transcription of corresponding genes [Citation51–Citation54]. Nevertheless, it had been shown for some transcription factors that their binding to regulatory sequences is not inhibited by the methylation of their target sequences and, for some of them, DNA methylation represents a positive signal [Citation30,Citation55].
A screen for known binding motifs at 5ʹ end DNA sequences (TSS ± 1 kb) of FC2 group versus FC1 group of genes identified several sites corresponding to repressors or activators of the transcription and some of which are methylation-dependent [Citation30]. These factors are involved in very different pathways (including, degradation of acetylated low-density lipoprotein and spermatogenesis) and did not permit the identification of a specific pathway. However, a large part of these putative binding proteins (ZNF281, KLF3, TBX1, HES5, and FOXO3) have been associated with tumorigenic processes, arguing in favour of an involvement of FC2 genes in pathophysiology of breast cancers.
Taken together these data identify an additional pathway, via the methylation of the shore sequences, in the cross-talk between cancer cells and their microenvironment in human breast cancers.
Materials and methods
Public data
Transcriptomic data for MCF7 and MCF10A cell lines were collected from GEO DataSets (Supplementary Table S1), MCF7 cells were treated for 4 days with IL6, 24 h with IGF, 3 h with TNFa, and 45 min with IL1b. MCF10A cells were treated for 3 days with TGFb. HepG2 cells were treated for 3 days with TGF. Histone marks and DNase hypersensitive sites for MCF7 were where downloaded from ENCODE at UCSC (human data, http://hgdownload.cse.ucsc.edu/goldenPath/hg19/encodeDCC/). For the MCF7 cell line DNA methylation data, Infinium HumanMethylation450K β-values were collected from GEO DataSets (https://www.ncbi.nlm.nih.gov/gds/?term=GSE78875[Accession]). Whole-genome bisulphite sequencing data were from GEO Datasets, GSE54693 and GSM2308631 for MCF7 and HepG2 cell lines, respectively. Transcriptomic and DNA methylation data for human breast cancer were collected from TCGA (https://cancergenome.nih.gov/) using the TCGA2STAT package (http://www.liuzlab.org/TCGA2STAT/) as rpkm for RNAseq data and β-values for DNA methylation data.
Indexes for breast cancer tumour purity, stromal-score, immune-score, and estimate-score were collected from the ESTIMATE website (http://bioinformatics.mdanderson.org/estimate/).
The list of human TSS, annotated from hg19 version of human genome, was collected from UCSC (http://genome.ucsc.edu/cgi-bin/hgTables)
Data analysis
Differential expression was determined from RNAseq using Cuffdiff [Citation24] and GEO2R (http://www-ncbi-nlm-nih-gov.gate2.inist.fr/geo/geo2r/) for array data GSE54329, GSE67295, GSE67295, GSE7561, and GSE28569. Data from GSE127828 were analysed using R/Bioconductor package lumi as previously described [Citation56]. Using the RNAseq data obtained from MCF7 cell line (GSE67295), only genes with at least 0.5 rpkm were kept for subsequent analysis. For upregulated genes, fold change (FC) ≥ 2, an FDR < 0.05 was used as a threshold, unaffected genes were defined as genes exhibiting an FC > 0.9 and < 1.1.
Heatmaps were constructed using either EnrichedHeatmap (R/Bioconductor package) for DNA methylation or Deep Tools package (https://deeptools.readthedocs.io) for histone modifications and DNase hypersensitivity sites.
K-means clustering was performed with Cluster 3 (http://bonsai.hgc.jp/~mdehoon/software/cluster/software.htm) and Java Tree view (http://jtreeview.sourceforge.net) packages using the Euclidean distance to the mean option.
For correlative analyses, RNA expression in rpkm was normalized to log2(1 + rpkm), and DNA methylation in β values (methylated CpG/(methylated CpG + unmethylated CpG) to M values: log2(β/1- β).
Motif identification surrounding TSS regions of FC2 genes. Extended TSS regions (TSS ± 2kb) were scanned using the RSATmatrix scan module (https://rsat01.biologie.ens.fr/rsat/) for potential transcription factor binding motifs using the DNA sequences surrounding the TSS (TSS ±1 kb) of FC2 genes and DNA sequences surrounding the TSS (TSS ±1 kb) of FC1 genes as background.
Statistical analyses were performed using Corrplot, ggplot2, dplyr R packages and GraphPad Prism software.
Authors’ contributions
HH, PM and RD carried out the methylation and gene expression data meta-analysis; HH, RD and CG co-wrote the first draft of the manuscript; HH and RD conceived the study. All authors read, critically revised and approved the final manuscript.
Supplemental Material
Download Zip (2.5 MB)Acknowledgments
We thank Dr Brigitte Manship for critical reading of this manuscript and helpful discussions. We thank the patients involved in the research and all researchers that deposited their data in open repositories.
Disclosure statement
No potential conflict of interest was reported by the authors.
Supplementary material
Supplemental data for this article can be accessed here.
Additional information
Funding
Related Research Data
References
- Balkwill FR, Capasso M, Hagemann T. The tumor microenvironment at a glance. J Cell Sci. 2012;125:5591–5596.
- Pickup MW, Mouw JK, Weaver VM. The extracellular matrix modulates the hallmarks of cancer. EMBO Rep. 2014;15:1243–1253.
- Hanahan D, Coussens LM. Accessories to the crime: functions of cells recruited to the tumor microenvironment. Cancer Cell. 2012;21:309–322.
- Quail DF, Joyce JA. Microenvironmental regulation of tumor progression and metastasis. Nat Med. 2013;19:1423–1437.
- Bussard KM, Mutkus L, Stumpf K, et al. Tumor-associated stromal cells as key contributors to the tumor microenvironment. Breast Cancer Res. 2016;18:84.
- Marusyk A, Tabassum DP, Janiszewska M, et al. Spatial proximity to fibroblasts impacts molecular features and therapeutic sensitivity of breast cancer cells influencing clinical outcomes. Cancer Res. 2016;76:6495–6506.
- Junttila MR, de Sauvage FJ. Influence of tumour micro-environment heterogeneity on therapeutic response. Nature. 2013;501:346–354.
- Sappino AP, Skalli O, Jackson B, et al. Smooth-muscle differentiation in stromal cells of malignant and non-malignant breast tissues. Int J Cancer. 1988;41:707–712.
- Mathot P, Grandin M, Devailly G, et al. DNA methylation signal has a major role in the response of human breast cancer cells to the microenvironment. Oncogenesis. 2017;6:e390.
- Kalluri R, Zeisberg M. Fibroblasts in cancer. Nat Rev Cancer. 2006;6:392–401.
- Buchsbaum RJ, Oh SY. Breast cancer-associated fibroblasts: where we are and where we need to go. Cancers. 2016;8(2) 19.
- Qiao A, Gu F, Guo X, et al. Breast cancer-associated fibroblasts: their roles in tumor initiation, progression and clinical applications. Front Med. 2016;10:33–40.
- Madar S, Goldstein I, Rotter V. ’Cancer associated fibroblasts’–more than meets the eye. Trends Mol Med. 2013;19:447–453.
- Luo H, Tu G, Liu Z, et al. Cancer-associated fibroblasts: a multifaceted driver of breast cancer progression. Cancer Lett. 2015;361:155–163.
- Straussman R, Morikawa T, Shee K, et al. Tumour micro-environment elicits innate resistance to RAF inhibitors through HGF secretion. Nature. 2012;487:500–504.
- Orimo A, Gupta PB, Sgroi DC, et al. Stromal fibroblasts present in invasive human breast carcinomas promote tumor growth and angiogenesis through elevated SDF-1/CXCL12 secretion. Cell. 2005;121:335–348.
- Barone I, Catalano S, Gelsomino L, et al. Leptin mediates tumor-stromal interactions that promote the invasive growth of breast cancer cells. Cancer Res. 2012;72:1416–1427.
- Mantovani A, Allavena P, Sica A, et al. Cancer-related inflammation. Nature. 2008;454:436–444.
- Coussens LM, Werb Z. Inflammation and cancer. Nature. 2002;420:860–867.
- Dinarello CA. Biologic basis for interleukin-1 in disease. Blood. 1996;87:2095–2147.
- Wu T-C, Xu K, Martinek J, et al. IL1 receptor antagonist controls transcriptional signature of inflammation in patients with metastatic breast cancer. Cancer Res. 2018;78:5243–5258.
- Palucka AK, Coussens LM. The basis of oncoimmunology. Cell. 2016;164:1233–1247.
- Lin -W-W, Karin M. A cytokine-mediated link between innate immunity, inflammation, and cancer. J Clin Invest. 2007;117:1175–1183.
- Trapnell C, Williams BA, Pertea G, et al. Transcript assembly and quantification by RNA-Seq reveals unannotated transcripts and isoform switching during cell differentiation. Nat Biotechnol. 2010;28:511–515.
- Menafra R, Brinkman AB, Matarese F, et al. Genome-wide binding of MBD2 reveals strong preference for highly methylated loci. PLoS One. 2014;9:e99603.
- Irizarry RA, Ladd-Acosta C, Wen B, et al. The human colon cancer methylome shows similar hypo- and hypermethylation at conserved tissue-specific CpG island shores. Nat Genet. 2009;41:178–186.
- Dedeurwaerder S, Desmedt C, Calonne E, et al. DNA methylation profiling reveals a predominant immune component in breast cancers. EMBO Mol Med. 2011;3:726–741.
- Yoshihara K, Shahmoradgoli M, Martinez E, et al. Inferring tumour purity and stromal and immune cell admixture from expression data. Nat Commun. 2013;4:2612.
- Thomas-Chollier M, Defrance M, Medina-Rivera A, et al. RSAT 2011: regulatory sequence analysis tools. Nucleic Acids Res. 2011;39:W86–91.
- Yin Y, Morgunova E, Jolma A, et al. Impact of cytosine methylation on DNA binding specificities of human transcription factors. Science. 2017;356:eaaj2239.
- Devailly G, Grandin M, Perriaud L, et al. Dynamics of MBD2 deposition across methylated DNA regions during malignant transformation of human mammary epithelial cells. Nucleic Acids Res. 2015;43:5838–5854.
- Goldberg JE, Schwertfeger KL. Proinflammatory cytokines in breast cancer: mechanisms of action and potential targets for therapeutics. Curr Drug Targets. 2010;11:1133–1146.
- Ebbing EA, van der Zalm AP, Steins A, Creemers A, Hermsen S, Rentenaar R, Klein M, Waasdorp C, Hooijer GKJ, Meijer SL, et al. Stromal-derived interleukin 6 drives epithelial-to-mesenchymal transition and therapy resistance in esophageal adenocarcinoma. Proc Natl Acad Sci. 2019;116:2237–2242.
- Aran D, Sirota M, Butte AJ. Systematic pan-cancer analysis of tumour purity. Nat Commun. 2015;6:8971.
- Esteller M. Epigenetics in cancer. N Engl J Med. 2008;358:1148–1159.
- Baylin SB, Jones PA. A decade of exploring the cancer epigenome – biological and translational implications. Nat Rev Cancer. 2011;11:726–734.
- Ehrlich M, Lacey M. DNA methylation and differentiation: silencing, upregulation and modulation of gene expression. Epigenomics. 2013;5:553–568.
- Wu X, Tao P, Zhou Q, et al. IL-6 secreted by cancer-associated fibroblasts promotes epithelial-mesenchymal transition and metastasis of gastric cancer via JAK2/STAT3 signaling pathway. Oncotarget. 2017;8:20741–20750.
- Grell M, Douni E, Wajant H, et al. The transmembrane form of tumor necrosis factor is the prime activating ligand of the 80 kDa tumor necrosis factor receptor. Cell. 1995;83:793–802.
- Bird A. DNA methylation patterns and epigenetic memory. Genes Dev. 2002;16:6–21.
- Rodriguez-Ubreva J, Ciudad L, Gomez-Cabrero D, et al. Pre-B cell to macrophage transdifferentiation without significant promoter DNA methylation changes. Nucleic Acids Res. 2012;40:1954–1968.
- Jove R, Sperber DE, Manley JL. Transcription of methylated eukaryotic viral genes in a soluble in vitro system. Nucleic Acids Res. 1984;12:4715–4730.
- Vardimon L, Kressmann A, Cedar H, et al. Expression of a cloned adenovirus gene is inhibited by in vitro methylation. Proc Natl Acad Sci U S A. 1982;79:1073–1077.
- Stein R, Razin A, Cedar H. In vitro methylation of the hamster adenine phosphoribosyltransferase gene inhibits its expression in mouse L cells. Proc Natl Acad Sci U S A. 1982;79:3418–3422.
- Defossez PA, Stancheva I. Biological functions of methyl-CpG-binding proteins. Prog Mol Biol Transl Sci. 2011;101:377–398.
- Hendrich B, Bird A. Identification and characterization of a family of mammalian methyl-CpG binding proteins. Mol Cell Biol. 1998;18:6538–6547.
- Jaenisch R, Bird A. Epigenetic regulation of gene expression: how the genome integrates intrinsic and environmental signals. Nat Genet. 2003;33:Suppl:245–54.
- Baubec T, Ivánek R, Lienert F, et al. Methylation-dependent and -independent genomic targeting principles of the mbd protein family. Cell. 2013;153:480–492.
- Angrisano T, Lembo F, Pero R, et al. TACC3 mediates the association of MBD2 with histone acetyltransferases and relieves transcriptional repression of methylated promoters. Nucleic Acids Res. 2006;34:364–372.
- Berger J, Sansom O, Clarke A, et al. MBD2 is required for correct spatial gene expression in the gut. Mol Cell Biol. 2007;27:4049–4057.
- Iguchi-Ariga SM, Schaffner W. CpG methylation of the cAMP-responsive enhancer/promoter sequence TGACGTCA abolishes specific factor binding as well as transcriptional activation. Genes Dev. 1989;3:612–619.
- Kim J. Methylation-sensitive binding of transcription factor YY1 to an insulator sequence within the paternally expressed imprinted gene, Peg3. Hum Mol Genet. 2003;12:233–245.
- Campanero MR, Armstrong MI, Flemington EK. CpG methylation as a mechanism for the regulation of E2F activity. Proc Natl Acad Sci U S A. 2000;97:6481–6486.
- Watt F, Molloy PL. Cytosine methylation prevents binding to DNA of a HeLa cell transcription factor required for optimal expression of the adenovirus major late promoter. Genes Dev. 1988;2:1136–1143.
- Hu S, Wan J, Su Y, et al. DNA methylation presents distinct binding sites for human transcription factors. Elife. 2013;2:e00726.
- Hernandez-Vargas H, Gruffat H, Cros MP, et al. Viral driven epigenetic events alter the expression of cancer-related genes in Epstein-Barr-virus naturally infected Burkitt lymphoma cell lines. Sci Rep. 2017;7:5852.