
ABSTRACT
Unrecognized depression during adolescence can result in adult suicidal behaviour. The aim of this study was to identify, replicate and characterize DNA methylation (DNAm) shifts in depression aetiology, using a longitudinal, multi-tissue (blood and brain) and multi-layered (genetics, epigenetics, transcriptomics) approach. We measured genome-wide blood DNAm data at baseline and one-year follow-up, and imputed genetic variants, in 59 healthy adolescents comprising the discovery cohort. Depression and suicidal symptoms were determined using the Development and Well-Being Assessment (DAWBA) depression band, Montgomery-Åsberg Depression Rating Scale-Self (MADRS-S) and SUicide Assessment Scale (SUAS). DNAm levels at follow-up were regressed against depression scores, adjusting for sex, age and the DNAm residuals at baseline. Higher methylation levels of 5% and 13% at cg24627299 within the MET gene were associated with higher depression scores (praw<1e-4) and susceptibility for suicidal symptoms (padj.<0.005). The nearby rs39748 was discovered to be a methylation and expression quantitative trait locus in blood cells. mRNA levels of hepatocyte growth factor (HGF) expression, known to strongly interact with MET, were inversely associated with methylation levels at cg24627299, in an independent cohort of 1180 CD14+ samples. In an open-access dataset of brain tissue, lower methylation at cg24627299 was found in 45 adults diagnosed with major depressive disorder compared with matched controls (padj.<0.05). Furthermore, lower MET expression was identified in the hippocampus of depressed individuals compared with controls in a fourth, independent cohort. Our findings reveal methylation changes at MET in the pathology of depression, possibly involved in downregulation of HGF/c-MET signalling the hippocampal region.
Introduction
Depression in adolescents is a prediction marker for suicidal behaviour in adulthood [Citation1,Citation2]. Approximately one million people die by committing suicide every year worldwide [Citation3] and over 90% of them have a diagnosable mood disorder including depression [Citation4]. Moreover, adolescent-onset recurrent major depression disorder (MDD) is linked to more severe psychosocial impairment during adulthood compared with adult-onset recurrent MDD [Citation5]. The development of depression is the result of an interaction between environmental and genetic risk factors [Citation6].
Emerging evidence suggests that psychosocial stressors affect epigenetic patterns in blood and brain tissues [Citation7–Citation9], which can lead to long-term gene expression changes [Citation10]. The best-characterized epigenetic mark, DNA methylation (DNAm), reflects the interplay between environmental stress and genetic contribution to depression over the lifespan [Citation11,Citation12]. DNAm involve the addition of a methyl group to DNA, typically at a cytosine nucleotide adjacent to a guanine (CpG). Studies have investigated DNAm of candidate genes in depression aetiology, such as BDNF, SLC6A4 and NR3C1 [Citation13,Citation14]. Importantly, DNAm patterns are notoriously tissue-specific [Citation15], with moderate correlations between DNAm variation in blood and post-mortem brain tissue [Citation16–Citation18]. To date, epigenome-wide association studies (EWAS) of depression mainly focused on the adult population, using whole blood [Citation19–Citation23], brain [Citation24,Citation25] or saliva samples [Citation26]. These studies identified differentially methylated CpGs within genes such as ZBTB20, WDR26 and GHSR and differentially methylated regions in the GRIK2, BEGAIN and PRIMA1 genes. Differences in tissue sources, ethnicity, co-morbidity diagnoses and medication history, may partly explain why these studies failed to find common CpGs robustly associated with depression. Therefore, using both whole blood and brain tissues would allow gaining more insight into the regulatory mechanisms of depression.
Adolescent neurodevelopment is modulated by environmental signals [Citation27], yet without being affected by a large variety of abundant psychiatric comorbidities and medication usage. Moreover, analysing DNA signatures at early stages reduces the noise created by stochastic DNAm changes that happen with advancing age [Citation28]. Only two studies reported methylome-wide findings associated with depression in adolescents [Citation29,Citation30]. One study that identified inverse association between methylation at MIR4646 and gene expression was underpowered (n = 11 adults). Another study reported increased DNAm at STK32C in blood of 18 pairs of monozygotic adolescent twins discordant for depression, and replicated the findings in cerebellar tissue, but did not investigate the downstream effects on RNA expression [Citation30]. Moreover, both studies were cross-sectional, while a longitudinal approach tracks changes in depressive symptoms over time and identifies DNA methylation shifts in a more controlled environment [Citation31].
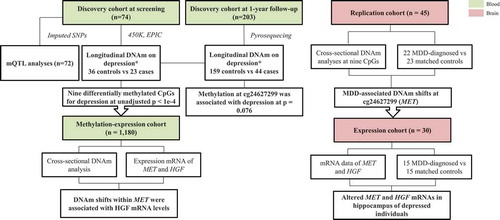
Shifts in epigenetic patterns may be an early mechanism at play in depression and thus, this work aims to uncover longitudinal epigenetic patterns in depression development. We used a longitudinal epigenome-wide approach to identify blood DNAm changes associated with changes in depression in otherwise healthy adolescents. We then tested whether these associations could be correlated with nearby SNP presence by conducting a mQTL analysis. In addition, we tested for replication of the associations between DNAm and depression in an independent dataset of brain tissue. We further investigated the functional relevance of these depression-associated DNAm signatures by integrating them with gene expression in a third dataset. Importantly, we showed in a fourth cohort that genes annotated to these DNAm signatures were differentially expressed in the hippocampus of depressed individuals. Using four independent cohorts consisting of blood and brain samples and a statistical framework for analysing longitudinal epigenetic data, we uncovered a broad epigenetic-genetic network in the pathology of depression. Our results are summarized in .
Figure 1. Study design for methylation and expression association with depression using four cohorts. Blood associations between DNA methylation and depression risk, genotype and mRNA expression were investigated using two independent cohorts, i.e. the discovery cohort and methylation-expression cohort. In brain, methylation and mRNA levels were separately analysed in relation to MDD in two independent cohorts. * Individuals with depression DAWBA band risk scores below 15% and MADRS-S scores <9 were defined as ‘Controls’, while individuals with depression DAWBA level bands 3 (≈ 15%), 4 (≈ 50%) or 5 (>70%) and MADRS-S scores ≥9 were assigned to the ‘Cases’ category. SNPs: single nucleotide polymorphisms; MDD: major depression disease.
Results
Demographic and clinical characteristics of discovery and replication cohorts
The discovery cohort consisted of 59 Caucasian adolescents who had available imputed genetic data, recorded psychiatric phenotype and blood DNAm levels at both baseline and 1-year follow-up. Depression scores were assessed by the standardized Development and Well-Being Assessment (DAWBA) depression band at baseline and follow-up, and by the Montgomery-Åsberg Depression Rating Scale-Self report (MADRS-S) at follow-up only. Adolescents defined as cases and controls based on the DAWBA and MADRS-S scores at follow-up did not differ in age, sex distribution or body mass index (BMI). While the majority of controls had low depression scores at both baseline and follow-up, 19 adolescents showed an increased risk for depression from baseline to follow-up ().
Table 1. Characteristics of the adolescents from the discovery cohort at follow-up.
The replication cohort comprised of 45 male and female Caucasians (), with DNAm profiling in brain tissue. Individuals diagnosed with MDD and controls did not differ in age or sex distribution.
Table 2. Characteristics of individuals in the replication cohort.
Differential methylation associated with depression risk, suicidal behaviour and mRNA expression in the blood
In the discovery cohort, we aimed to identify epigenome-wide associations between changes in depression risk and changes in methylation levels, focusing on CpGs located in promoter regions (from baseline to 1-year follow-up).
Depression risk at follow-up (i.e. control/case) was used as the outcome variable and corrected for methylation residuals at baseline, sex and age. A total of 5,785 CpG sites were nominally (praw<0.05) associated with changes in depression risk from baseline to follow-up, 53% of which were hypomethylated in cases. However, none of these sites remained significant after adjustment for multiple testing (), so a stricter nominal threshold of p = 10−4 [Citation19,Citation20] was chosen. Nine CpG sites were associated with depression risk at praw < 10−4 (). The calculated inflation factor of our epigenome-wide analysis was λ = 0.89, suggesting that there was no overestimation of the level of statistical significance. The largest methylation difference was detected at cg24627299 within the hepatocyte growth factor receptor (MET) gene, DNAm being 5% higher in cases (0.54 ± 0.03) than in controls (0.49 ± 0.04) (). Methylation levels at this site were measured by pyrosequencing in a larger sample of 203 individuals at both baseline and follow-up. The normally distributed methylation values at follow-up were regressed against the dichotomous depressive phenotype variable, including the methylation residuals at baseline, age, sex and technical covariates. A clear tendency (two-sided p = 0.076) of increased methylation at cg24627299 in ‘cases’ compared to methylation levels of their healthy counterparts was observed.
Figure 2. Manhattan plot of the longitudinal epigenome-wide association of depressive-transformed variable in whole-blood samples of 59 adolescents. The depressive-transformed variable was calculated based on depression DAWBA band risk scores and MADRS-S scores. The blue line represents the significance level at p = 10−4.
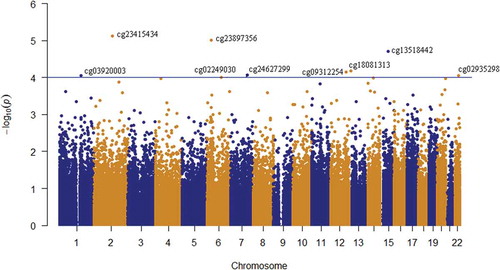
Figure 3. Blood DNAm levels (β-values) at cg24627299 within the MET gene for adolescents defined as ‘controls’ and ‘cases’. Individuals with depression DAWBA band risk scores below 15% and MADRS-S scores <9 were defined as ‘Controls’, while individuals with depression DAWBA level bands 3 (≈ 15%), 4 (≈ 50%) or 5 (>70%) and MADRS-S scores ≥9 were assigned to the ‘Cases’ category.
Table 3. List of differentially methylated CpG sites in longitudinal analyses.
We also investigated a possible association between the continuous scores for suicidal symptoms in SUAS and the previously identified nine CpGs. Four of the nine methylation sites associated with depression risk were also associated with suicide (). Similar to the observation made in relation to depression scores, methylation levels were higher for increased suicide symptoms at three out of four CpG sites. The largest effect size of methylation shifts was seen at the aforementioned cg24627299 within the MET gene.
The HGF gene is located in the same chromosomal region (7q21-11) as its receptor the c-MET tyrosine kinase (7q.31) encoded by the MET gene. Given the interaction of c-MET and HGF and their close chromosomal localization, methylation levels at the MET gene were investigated in relation to both MET and HGF expression levels using a methylation-expression cohort (). A suggestive inverse association between blood methylation levels at cg24627299 and mRNA expression of HGF (transcript ID: ILMN_1801586, praw = 0.046, estimate = −0.050) was identified. No association at this CpG site with expression levels of MET gene was identified.
Lower methylation at cg24627299 and mRNA levels of MET and HGF are associated with MDD in the brain
Methylation levels at the nine CpG sites (praw < 10−4) associated with depression in the blood discovery cohort were investigated in a replication cohort consisting of post-mortem cortical tissues of MDD-diagnosed and matched-controls (n = 45). Methylation data were available for both neuronal and glial cells. Methylation at cg24627299 (MET) adjusted for age and sex, was associated with depression in neurons (FDR-adjusted p = 0.0437, absolute difference = 2.6%) (), yet the significance did not survive after FDR adjustment in the glial cells (). In contrast to the findings in blood, methylation levels were lower in the brain from individuals diagnosed with MDD compared to controls.
Figure 4. Methylation levels at cg24627299 (MET) in brain samples of MDD-diagnosed individuals and controls.
Table 4. Differentially methylated CpG sites in the brain.
To investigate HGF-MET signalling dysregulation in depression, we contrasted MET and HGF mRNA expression levels in hippocampus region of depressed and healthy adults in a fourth independent cohort (see Methods). By alternative splicing, the genes give rise to several transcript sequences. The HEEBO array covers five oligo sequences of MET and HGF, associated with two accession numbers, i.e. NM_000245 and NM_001010932. Binomial tests were run separately for the dentate gyrus and CA1 sub-regions of hippocampus. More than 50% of the average expression values were higher in the matched controls compared to the MDD-diagnosed individuals (p < 0.05), indicating lower expression levels of MET and HGF in the adult-depressed hippocampus (Supplementary Table 1).
Methylation levels at cg24627299 showed functional relevance in the brain tissue but not whole blood
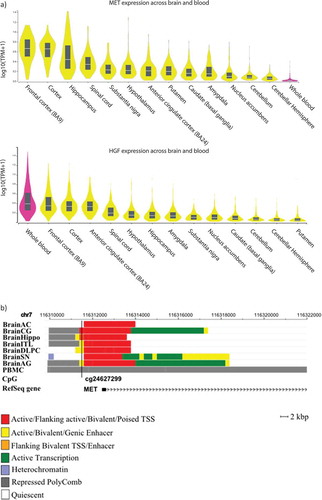
Using the GTEx online database, MET gene was found highly expressed in the cortex, frontal cortex and hippocampus, contrasting with low expression in whole blood (). The HGF gene was highly expressed in whole blood, frontal cortex, cortex and BA24 region (). Moreover, exploration of chromatin states of this locus revealed that cg24627299 is located within active chromatin regions (i.e. TSS or enhancer) in all brain tissues except the anterior caudate and substantia nigra. In contrast, cg24627299 was located in a region repressed by PolyComb proteins in PBMCs (). Furthermore, based on the online BECon tool resource of comparing methylation levels in whole blood and three brain regions, blood methylation levels at cg24627299 inversely associated with BA10, BA20 and BA7 methylation levels, supporting an opposite pattern of methylation observed originally in whole blood and brain.
Genotypes at rs39748 are associated with differential methylation at cg24627299 in whole blood
Taking into account the influence of genetic variants on both methylation [Citation32,Citation33] and gene expression [Citation34], we performed mQTL and eQTL analyses of SNPs within 100 kbp (up- and down-stream) of cg24627299 using 74 individuals from the discovery cohort that had both imputed SNPs and DNA methylation data at follow-up. Using the hg19 version of the UCSC genome browser, we identified 39 genetic variants within 100 kbp of cg24627299. Twenty independent genetic variants were not in LD (r2 < 0.8) () and had MAF > 0.3 in the discovery cohort. Based on an additive model, we identified one genetic variant (rs39748), located in intron 1 of MET and ~16 kpb downstream of cg24627299, that was nominally associated with methylation levels at cg24627299 (p = 0.045, effect size (CC: CG) = 1% (CC: GG) = −2.8%)), after adjusting for age and sex. Methylation levels at cg24627299 at rs39748 genotypes were 0.51 ± 0.05 at CC, 0.52 ± 0.04 at CG and 0.48 ± 0.04 at GG. In the discovery cohort, the MAF at rs39748 was 0.36, similar to the whole-population frequency of 0.34. Notably, this variant was also associated with MET mRNA expression, and the highest effect sizes were seen in brain regions ().
Figure 5. LD matrix of the 39 investigated genetic variants within the ±100 kbp of the differentially methylated CpG site (cg24627299, MET gene).
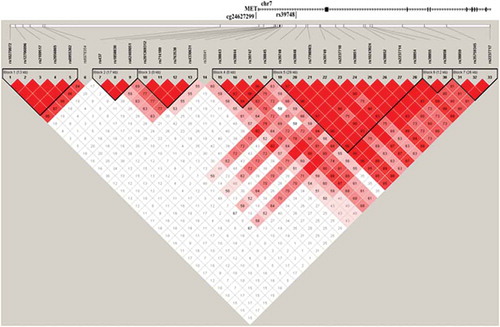
Table 5. Distribution of the rs39748 eQTL contribution across the tissues.
Discussion
Here, we conducted a comprehensive analysis of epigenetic, transcriptomic and genetic information in four independent cohorts and two tissues, including longitudinal EWAS, to uncover epigenetic shifts associated with high risk for depression. Higher methylation at cg24627299 within the MET gene was associated with a high risk for depression and susceptibility for suicidal behaviour in blood, while lower methylation at cg24627299 was observed in cortical tissue of depressed adults. Importantly, methylation shifts at this site were inversely associated with expression levels of the MET ligand HGF in blood, indicating a possible functional relationship between methylation and expression. Interestingly, both MET and HGF mRNA expressions were altered in hippocampus of depressed individuals. These findings highlight the interplay between methylation and expression of HGF, as well as on HGF/c-MET signalling in the development of depression.
Our discovery of the changes in blood methylation levels in adolescents at risk for depression, supported by the confirmatory approach in adult brain samples, sheds light on depression aetiology. MET encodes a tyrosine kinase receptor called c-MET that has high affinity for HGF. Although c-MET was shown to be regulated by a number of transcription factors including p53 [Citation35] and Daxx [Citation36], less is known about the role of DNA methylation in regulating c-MET expression. Loss of MET promoter methylation is involved in HGF-dependent increase in tumorigenicity and metastatic potential of hepatocellular carcinoma via upregulation of c-Met and HGF expression [Citation37]. Importantly, both MET and HGF are expressed in the developing nervous system, especially in the cerebral cortex [Citation38,Citation39], strengthening the importance of our replication in cortical tissue samples. In the current study, altered gene expression of the MET ligand HGF could be caused by methylation changes at MET in the brain. This finding is supported by the locus harbouring the identified differentially methylated CpG exerts a regulatory role on transcription in the brain regions (), supporting a functional link with MET and HGF expression in the hippocampus. Our results suggest that the interplay of these two molecules is regulated at the gene expression level. Therefore, altered activity of HGF/c-MET signalling due to methylation shifts may interfere with HGF-mediated action on interneuron migration, disrupting neuronal growth in the cortex [Citation40].
Figure 6. a) MET and HGF expression levels among different brain regions and whole blood. b) Genomic context of the most significant CpG site associated with the depressive phenotype in the longitudinal analyses. Genomic positions of RefSeq genes are displayed in the bottom part and indicated by arrows. The position of the significant CpG site is highlighted by black lines. Since analyses were performed based on data obtained in blood, chromatin marks overlapping in brain and blood cells were investigated. Chromatin states of eight tissues downloaded from the 37/hg19 WashU Epigenome Browser are illustrated. Each functional role of a segment is indicated by a particular colour. BrainAC: brain anterior caudate; BrainCG: brain cingulate gyrus; BrainHIPPO: brain hippocampus; BrainITL: brain inferior temporal lobe; BrainDPC: brain dorsolateral prefrontal cortex; BrainSN: brain substantia nigra; BrainAG: brain angular gyrus; PBMC: peripheral blood mononuclear primary cells.
DNAm levels at the identified CpG site within MET gene in depression were associated with suicidal thoughts assessed by the SUAS questionnaire. Previous studies investigating DNAm in relation to both depression and suicidality found that decreased anterior prefrontal GABRA1 levels in major depressive suicide victims may be due to increased anterior prefrontal GABRA1 gene promoter methylation [Citation41]. An EWAS in MDD suicide cases compared with non-psychiatric, sudden death controls, found hypomethylation at PSORS1C3 across both cortical brain region, i.e. BA11 and BA25 [Citation42]. DNAm levels at the GRIK2 and BEGAIN genes involved in synaptic communication were associated with astrocyte dysfunction in depression and suicide in the dorsolateral prefrontal cortex [Citation24]. Lastly, among MDD patients, altered DNAm levels at ELOVL5 were found in suicide attempters when compared with age- and sex-matched healthy volunteers [Citation43].
Although we could not test the regulatory role of genetic variants on MET and HGF mRNA expression levels, we found that the genetic variant rs39748, located in intron 1 of the MET gene, was associated with differential methylation at cg24627299 at follow-up. During this time window (18–19 years), the within-individual adjustment to environmental factors and its plasticity may be under genetic control. Intriguingly, reduced protein levels of c-MET have been associated with the C allele at the MET promoter variant rs1858830 in post-mortem autistic brain samples [Citation44,Citation45]. These findings indicate that changes in DNA methylation may compensate and/or mediate the inter-individual genetic variation [Citation46] and its effect on gene expression.
Intriguingly, we found decreased levels of MET and HGF in hippocampus of depressed individuals compared with control hippocampi. A number of studies have already examined depressive symptoms in relation to dysregulation of the hippocampus [Citation47]. Negative psychosocial factors induce changes in hippocampal neural activity and synaptic plasticity [Citation48] as well as in the prefrontal cortical region [Citation49]. Moreover, the disturbed activity of the hippocampus can also be caused by a weakening of excitatory synapses in, e.g. CA1, which plays a critical role in the determination of affect and reward [Citation50]. Importantly, the hippocampus is a prominent site for the expression of HGF and MET in the developing and adult brain [Citation51] (). It has been demonstrated that HGF and MET are clustered at the postsynaptic density of excitatory synapses in CA1 and increased HGF levels improve expression and clustering of excitatory synaptic proteins at sites along dendrites [Citation52], highlighting their importance for neuronal activity. Importantly, our results showed lower mRNA levels of both HGF and MET in the hippocampus of depressed adults. Consistently, a decreased HGF protein level was reported in individuals with obsessive-compulsive disorder, bipolar disorder and depression [Citation53–Citation55]. Downregulation of HGF/c-MET signalling reduces the axonal growth of hippocampal neurons through deterioration of the autocrine feedback loops [Citation56], resulting in a reduced arborization at excitatory synapses [Citation57]. Processing of the input stimuli is thus altered and an inadequate response is formulated [Citation58], leading to depressive symptoms (). In addition, alteration of HGF/c-MET at the excitatory synapses in the CA1 region may disturb the connection between the axons in the entorhinal cortex with the distal dendrites of pyramidal cells, a pathway required for long-term consolidation memory [Citation59]. Interestingly, as serotonin potentiates these synapses, treatment of depression by conventional agents such as selective serotonin reuptake inhibitors results in restoration of the CA1 pyramidal spine density and excitability [Citation60–Citation62].
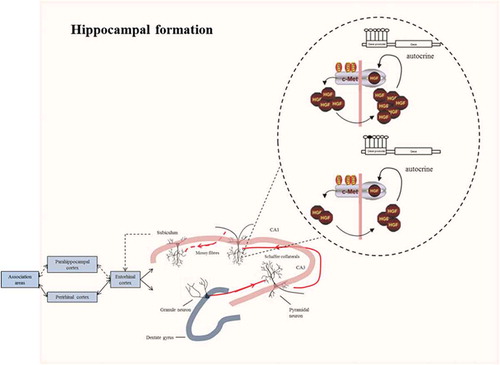
Figure 7. Connections in the hippocampal formation. In the hippocampus, sensory information arrives from the cerebral association neocortex via the entorhinal cortex, parahippocampal gyrus and/or perirhinal cortex. The hippocampal subfield CA1 sends axons to both subcortical areas and the deep layers of the entorhinal cortex, either directly or through the subiculum. Processed information is sent back from the hippocampal CA1 area to the cerebral association cortex through the same pathway. Higher methylation levels at the promoter of MET may alter the autocrine mechanism of HGF/c-MET signalling necessary for promoting axonal growth at the excitatory synapses of the CA1 hippocampal pyramidal neurons. The response to the environmental stimuli may therefore be altered, leading to depressive symptoms.
Our findings on methylation changes at the MET gene in whole blood were validated in an independent cohort of prefrontal cortex samples, and further extensively investigated in the brain tissue. This is the first study which identifies differential DNAm at the MET gene in depression. This may be the result of the fact that our findings derive from a longitudinal study, taking into account the association of DNAm levels and depression scores at two-time points, compared to earlier EWASs that only used a cross-sectional set-up. Whole blood is commonly used as surrogate for brain in DNAm studies due to accessibility and its potential connection with neuropsychiatric diseases through hormonal and immune regulation [Citation63]. However, given the tissue specificity of DNAm, a cross-tissue analysis approach, using both brain and blood, may help in identifying more relevant DNAm patterns in psychiatric populations. Additionally, the EPIC array used in our discovery analysis showed higher proportion of correlated CpGs between blood and brain than the previously used 450K array [Citation64]. Using separate cohorts, we discovered that higher methylation levels were associated with lower expression levels at the HGF gene in whole blood in adolescents at risk for depression and lower HGF expression levels in adult depressed hippocampus, indicating that the association between DNAm and expression levels may be translated to the hippocampus. However, in the prefrontal brain samples of depressed adults, we observed an opposite direction of methylation patterns from blood, i.e. lower DNAm at the CpG site. The finding is not surprising, as DNAm dynamics are not only tissue-specific, but may also significantly differ across different regions of the brain [Citation65]. Whole blood can be assumed to reflect a partial summation of methylation changes at this CpG site occurring in the brain. The observed opposite direction of methylation patterns in blood and prefrontal brain samples found in our study was also supported by an inverse correlation of methylation levels at the identified CpG site between blood and BA10 medial frontal gyrus region using the BECon omics platform.
Our findings have to be evaluated in light of their limitations. Firstly, due to the relatively small sample size and effect sizes detected, no probe reached the multiple-testing levels of significance. As expected in longitudinal studies, methylation differences are moderate (~5%), and, while the directionality could be replicated using pyrosequencing in an extended cohort, significance could not be reached, likely due to the 5% sensitivity limit of such a locus-specific method [Citation66]. In addition, our discovery and replication cohorts were different in age (adolescents vs. adults). This limitation was taken into consideration by using statistical models adjusting for this factor. A strength of our study is our longitudinal, multi-tissue (blood and brain) and multi-layered (genetics, epigenetics, transcriptomics) approach affirming our findings from whole blood in the prefrontal brain samples, indicating that the association may be of relevance for regulatory pathways in the brain. Importantly, adolescents were free of medication with psychotropic effects, which may affect methylation signatures. Lastly, our psychiatric phenotype was assessed using two questionnaires, i.e. the MADRS-S and DAWBA depression band, increasing the sensitivity of analysis.
Conclusions
We present evidence that stable blood-based epigenetic changes are associated with risk for depression and susceptibility for suicidal behaviour in adolescence. The complementary epigenetic and genetic analyses may provide mechanistic support for downregulation of the HGF and MET genes in the hippocampus of depressed individuals. Our findings suggest an important pathogenic role of HGF/c-MET signalling in the pathophysiology of depression, partly characterized by impaired neuronal growth.
Methods
Study participants
Discovery dataset
The discovery cohort was a sample of a cohort of 786 unrelated Swedish adolescents aged 17–19, recruited between 2012 and 2017 in Uppsala, Sweden. This longitudinal study aims to investigate potential psychiatric risk factors in youth and followed up the subjects approximately 1 year after study enrolment. Exclusion criteria at recruitment included any severe cognitive impairment or medication for psychiatric disorders. Height, age and medication intake were self-reported. We measured body weight at the clinic and calculated for body mass index (BMI). Methylation analysis at baseline was available for 221 non-related adolescents, analysed in two batches [Citation29,Citation32]. Out of 130 adolescents analysed in the first batch, a subset of 61 came at the follow-up and therefore had extracted DNA available. From the second batch of 91 adolescents, 11 were selected out of the 34 adolescents who answered positively to the follow-up based on their very low/high psychiatric-related scores at the DAWBA general band. In total, longitudinal DNA methylation analyses were applied on a sample of 74 adolescents. The study was approved by the Regional Ethics Committee in Uppsala, corresponding to the Drnr 2011/446. All participants volunteered to participate in the study, and written informed consent has been obtained.
Psychiatric phenotype of depression and disease outcome
Participants were given a questionnaire at baseline and at follow-up to assess both their baseline psychiatric phenotype and any potential change in psychiatric health over the one-year period. The standardized DAWBA questionnaire assesses the probability that an adolescent (aged 5–17 years) displays anxiety disorders, depression, post-traumatic stress disorder, autism, separation anxiety disorder and obsessive compulsive disorder [Citation67]. The generated in silico scores include six band scores for risk, i.e. 0 (<0.1%), 1 (≈ 0.5%), 2 (≈ 3%), 3 (≈ 15%), 4 (≈ 50%) and 5 (>70%), based on Diagnostic and Statistical Manual of mental disorders (DSM-IV) and International Statistical Classification of Diseases and Related Health Problems (ICD-10) [Citation68]. The DAWBA depression band consists of questions relating to the occurrence of depression symptoms in the last 4 months, such as e.g. the level of sadness, irritability, sleep activity, wish to die and to what extent general mood is affected. Individuals with a score ≥3 were considered at high risk for depression [Citation69].
At follow-up, participants were given two additional questionnaires, in order to provide more support to the psychiatric-related phenotype. One of the most commonly used instruments for the assessment of depressive symptoms is the MADRS self-report questionnaire [Citation70]. The MADRS-S comprises nine questions assessing individuals’ mood, feelings of unease, sleep, appetite, ability to concentrate, initiative, emotional involvement, pessimism and zest for life. Items are rated on a 7-point Likert scale (from 0 to 6) leading to a total score ranging between 0 and 54. Study participants were instructed to rate symptom severity over the last three days. Individuals with a score ≥9 were broadly considered depressive [Citation71]. The MADRS-S questionnaire was available at follow-up only.
We further evaluated individual’s susceptibility for suicide or suicidal attempts with the SUicide Assessment Scale (SUAS). This questionnaire assesses suicidal symptoms such as despair, hostility, seclusion, loss of control, somatization, death wishes and suicidal thoughts and behaviour. The overall score ranges from 0 to 80.
Our study includes a population-based cohort of adolescents; therefore, the prevalence of psychiatric phenotypes is not that high, yet normal for a population-based study [Citation72,Citation73]. In order to increase the analysis power and sensitivity, both the DAWBA depression band and MADRS-S scores were transformed into a binary depressed/not-depressed variable and used in further analyses. Participants with depression band values ≥3 and MADRS-S scores ≥9 were categorized as ‘cases’, participants with depression band values <3 and MADRS-S scores <9 were categorized as ‘controls’. Subjects showing depression band values of ≥3 and MADRS-S scores <9 were assigned as ‘missing’ and omitted from the analysis. A total of 59 individuals were categorized as cases or controls, defining the ‘discovery dataset’.
Genome-wide DNA methylation profiling and processing
Blood was collected at two-time points (baseline and one-year follow-up). Baseline DNAm profiles were assessed with the Illumina 450K methylation Beadchip. Data preprocessing was performed as described in [Citation32,Citation69]. It should be noted that baseline methylomes were profiled in two different time batches within a time range of 1 year [Citation32]. This time difference in DNAm analyses at baseline will further be referred to as ‘batch’ and taken into consideration in the methylation analyses at baseline.
At follow-up, genomic DNA was extracted from EDTA blood and 250 ng of DNA was bisulphite-converted using the EZ DNA Methylation Kit (Zymo Research Product, Germany). DNA was eluted in 15μl buffer according to the manufacturer’s protocol, evaporated to a volume of <4 μl, and methylomes were assessed with the Illumina Methylation EPIC array. The results were analysed with GenomeStudio 2011.1 from Illumina Inc. A total of 74 samples had methylation data available for quality control procedures. The signal intensities from the methylated and unmethylated channels were normalized with the noob procedure in R [Citation74] and the DNA methylation level, called beta value, was calculated by the ratio of the methylated to the sum of methylated and unmethylated intensities. All samples successfully passed quality control (they had ≥75% probes with a detection p-value ≤5 × 10⁻⁵). Probes were filtered out based on the following criteria: 1) probes with ≤75% samples showing detection p-values ≤0.01; 2) probes located on the sex chromosomes; 3) probes not targeting CpG sites; 4) probes with common polymorphisms (MAF > 5% in European population). After filtering, 765,396 probes remained. Batch effects were corrected using the ComBat function [Citation75]. Relative proportions of white blood cell types, i.e. CD4+ and CD8 + T cells, monocytes (Mono), granulocytes (Gran), B cells (Bcell) and natural killer (NK) cells, were calculated using the Houseman algorithm [Citation76]. These proportions were included in linear regression models prior analyses. As analyses were based on both baseline and follow-up, only CpG-sites present on both chips were analysed. The expanded annotation table by Price et al. was used for CpG site annotation [Citation77], defining for each CpG site the associated gene and distance to the closest transcriptional start site (TSS). With the exception of miRNA genes, only probes that were within 2,000 base pairs down/upstream of the TSS of genes were taken into consideration, based on the assumption that DNA methylation and gene expression are closely related within this region [Citation78]. The two methylation data sets, i.e. at baseline and follow-up, were merged, resulting in 148,788 CpG sites to be analysed.
Genotyping and imputation
All study participants at baseline (n = 786) were genotyped using the Infinium Global Screening Array at the SNP&SEQ SciLife Platform at Uppsala University, interrogating a total of 700,078 genetic variants. Prior imputation, quality control steps were performed using Plink 1.9 [Citation79] as following: samples were excluded based on genotyping call rate (<95%), high heterozygosity >2 standard deviations (SD) and missingness rate >0.05 (n = 21 samples); probes were removed based on the minor allele frequency (MAF) (<1%), Hardy-Weinberg equilibrium (HWE) (<1e-6) and missing rate (>5%) (n = 203,774 probes). A total of 496,304 genotypes of 765 individuals were included in the pre-phasing approach implemented in SHAPEIT version 2.7 (r904) [Citation80] and then imputed using IMPUTE2 software (version 2.3.2) [Citation81], taking the 1000 Genome Project phase 3 integrated variant set as a reference (release October 2014). Data were further filtered using HWE cut-off of 0.01, imputation info score >0.3 and MAF >0.01. A cis analysis was performed for the 74 participants at follow-up who had measured both methylation and genetic data. Common single nucleotide polymorphisms (SNPs) within ±100kbp of the differentially methylated CpG site position in Human Reference Genome build 37 (hg19) were investigated with the genome browser [Citation82].
Replication dataset
We interrogated an already pre-processed, publically available dataset of 58 post-mortem cortical tissues from MDD-diagnosed individuals (n = 29) and 29 matched controls [Citation83]. In these samples, neuronal and glia cell proportions were determined by fluorescence-activated cell sorting (FACS). Methylation levels were separately measured in both cell types using Illumina 450K methylation Beadchip determining 480,492 methylation sites. The two methylation datasets are available under the GEO accession number GSE41826. To avoid confounding of methylation signal by ethnicity, only data from Caucasian individuals were included in further analyses (n = 45).
Methylation-expression dataset
To integrate the methylome with the transcriptome, a third independent open-access dataset (E-GEOD-56,047) was used, containing both transcriptome and methylome data from CD14+ samples derived from 1,202 participants (44–83 years-old) [Citation84]. The current cohort is part of a larger study that investigated cardiovascular diseases in a cohort of Caucasians, African Americans and Hispanics [Citation85]. The deposited data contained information about age, race/ethnicity, study site, sex, methylation/expression chip, B-cells, T-cells, neutrophils and natural killer cell proportions. For the purpose of our analyses, methylation data were filtered for outliers based on a graphical boxplot (n = 22 outliers removed). Methylomes were profiled with the Illumina 450K methylation Beadchip and transcriptomes were measured with the Illumina HumanHT-12 V4.0 expression Beadchip. Details about methylation data pre-processing and transcriptomic quality control can be found elsewhere [Citation84].
Expression cohort
Gene expression profiles in the dentate gyrus and CA1 subregions of the hippocampus were analysed in 15 patients diagnosed with MDD and 15 age-, sex- and race-matched controls using data from a publically available case/control study (ArrayExpress accession E-GEOD-24,095). Data were analysed using the cDNA hybridization to 48K human HEEBO whole-genome microarrays. Average expression values for all hybridizations were available for each individual [Citation86]. Data were normalized using linear-Log normalization to stabilize the variance of low expressing genes, and then spatial plus intensity based LOWESS to remove spatial and intensity related biases, using the MAANOVA library [Citation86].
Evaluation of genomic sites in brain and blood
The functional relevance of the differentially methylated DNA sites was further investigated in blood and brain, using chromatin state analysis [Citation87] and Spearman correlations [Citation63]. Based on the availability of chromatin state data as predicted with Hidden Markov Models (HMMs), seven brain tissues were analysed: brain angular gyrus (BrainAG), brain anterior caudate (BrainAC), brain cingulate gyrus (BrainCG), brain hippocampus (BrainHIPPO), brain inferior temporal lobe (BrainITL), brain substantia nigra (BrainSN), brain dorsolateral prefrontal cortex (BrainDLPC) and peripheral blood mononuclear primary cells (PBMC). Data were loaded from Roadmap Epigenomics Project of 37/hg19 version of human genome in WashU Epigenome Browser http://epigenomegateway.wustl.edu/legacy/. For easier visualization, the 18-state model for the production of the segmentations according to the gene regulatory role was reduced to five regions, i.e. active/flanking active/bivalent/poised transcription start site (TSS), active/bivalent/genic enhancer, flanking bivalent TSS/enhancer, active transcription and repressed polyComb state. We used Spearman correlations to assess DNA methylation correspondence between blood and three brain regions, i.e. Brodmann area (BA) 10 (prefrontal cortex), BA20 (temporal cortex) and BA7 (parietal cortex), using the online BECon tool https://redgar598.shinyapps.io/BECon/ [Citation63]. The cohort consisted of methylation data of 16 individuals. More details about the preprocessing of this DNA methylation dataset are available in [Citation63]. The transcription levels in different brain tissues and whole blood of the associated genes to the differentially methylated CpGs were investigated using GTEx https://gtexportal.org/home/ [Citation88]. Moreover, using a population sample in the GTEx Consortium, genotypes at genetic loci were included in linear regression models and the significance to the gene expression was measured [Citation88]. Thus, the identified genetic variants in the mQTL analysis were classified as eQTLs if they showed contribution to the gene expression using the quantitative trait loci (eQTL) mapping.
Statistical analysis
We investigated genome-wide methylation differences with depression risk in the discovery cohort of n = 59 adolescents, using a longitudinal approach. All statistical analyses were performed in R version 3.4.1. In order to reduce the unwanted variability in DNAm caused by intrinsic (age, sex) and environmental (baseline depression, batch effect) factors, DNAm profiles were first regressed against baseline depression DAWBA scores, age, sex and batch. The resulting residuals were then included as covariates in the following linear regression model: methylationfollow-up ~ residualsbaseline + depression-transformed variablefollow-up + agefollow-up + sex. The inflation factor lambda was calculated for the linear models at follow-up, by dividing the median of chi-squared test statistics with the expected median of chi-squared distribution. In the next step, methylation M-values at the most significant DNA loci were also regressed against the SUAS scores in linear regression models, adjusting for sex and age at follow-up. Unadjusted (raw) p-values <10−4 were considered significant.
In replication analyses using data from brain tissue, methylation levels of significant CpG sites from the discovery analysis were regressed against the yes/no depression diagnosis, adjusting for age and sex. Analyses were run separately for neurons and glia cells and FDR adjustment was applied to the raw p-values. Associations between methylation and RNA expression levels at the identified genes were tested in an independent cohort. Methylation data were firstly regressed against age, race, study site, gender, methylation chip and the sample contamination with non-targeted cells, i.e. non-monocytes. The resulting residuals were included in linear regression models as an independent variable, together with expression values as dependent variables. Covariates were age, race, study site, gender, expression chip and the sample contamination with non-targeted cells. Given that expression data was obtained as normalized log2 ratio representing MDD/control mRNA expression, quantitative analysis could not be performed. Expression data were analysed using a two-sided binomial test, assuming a 0.5 probability threshold.
Given the relatively small sample size (n = 72) having both genotype and methylation data in the discovery cohort, only SNPs in no linkage disequilibrium (r^2 < 0.8) and with MAF >0.3 were analysed. Linkage disequilibrium was calculated using LDlink web-tool [Citation89] and Haploview [Citation90]. The genotypes were coded as ‘0ʹ (wild-type individuals), ‘1ʹ (heterozygous of minor allele) and ‘2ʹ (homozygous of minor allele). The modulatory effect of genetic sequence variant was shown on the surrounding methylation levels [Citation32]. Methylation quantitative trait locus analysis (mQTL) was performed using likelihood ratio tests, adjusted for age and sex. The p-value of the SNP effect was calculated from the Chi-square distribution with 1 degree of freedom.
Pyrosequencing
Methylation levels at cg24627299 the CpG sites showing the highest DNA methylation difference were experimentally measured using pyrosequencing at baseline and follow-up. Out of the 786 adolescents recruited at the baseline, a subset of 203 was followed-up and had available extracted DNA. A total of 44 individuals were defined as ‘cases’ based on the DAWBA depression band ≥3 and MADRS-S scores ≥ 9 and 159 as ‘controls’. Primers were designed using PyroMark Design software (Qiagen) (Fwd: ATGATTGAATAATTGGTATGAGAGT, 5´-biotinylated Rev: AATTTAACCCTAAAAAAACTTCCATTT, sequencing: TTAATATAATTATTTTTAATAGAGT). Genomic DNA (500 ng) was bisulphite (BS)-converted using DNA methylation-Gold Bisulphite Kit (Zymo Research) and eluted in 25 µl of elution buffer. BS-DNA (~15 ng) was applied as a template in the PCR performed with the PyroMarks PCR kit (Qiagen) following manufacturer’s recommendations. To verify the efficiency and sensitivity of the PCR-pyrosequencing, we used Epitect unmethylated and methylated human BS-DNA samples (Qiagen) as controls. The entire PCR product, 4 pmol of the sequencing primer, and streptavidin sepharose high-performance beads (GR Healthcare) were used for pyrosequencing on the PSQ 96 system and PyroMark Gold 96 reagent kit (Qiagen). The PyroMark CpG software 1.0.11 (Qiagen) served for generating methylation levels. Technical covariates, i.e. bisulphite conversion batch, pyrosequencing plate and date of the pyrosequencing analysis were tested against methylation values, separately at baseline and follow-up. Methylation levels at baseline were firstly regressed against age, sex and technical covariates, and the resulting residuals were included in linear regression models at the follow-up. The following model was applied for the measured methylation levels at follow-up: methylation follow-up ~ residuals baseline + depression-transformed variable follow-up (0/1) + age follow-up + sex + technical covariates.
Authors’ contributions
DMC and HBS conceived and designed the study. DMC analyzed and interpreted the data and wrote the manuscript. JM interpreted the data and helped writing the manuscript. SV helped in analyzing and interpreting the results and writing the manuscript. LK and MJ performed the pyrosequencing analyses and helped writing the manuscript. NW recruited participants, gathered data and help writing the manuscript. JJ helped at interpretation of the results. HBS helped at the data interpretation.
Supplemental Material
Download MS Word (14.8 KB)Acknowledgments
Genotyping was performed by the SNP&SEQ Technology Platform in Uppsala. The platform is part of Science for Life Laboratory at Uppsala University and is supported as a national infrastructure by the Swedish Research Council. L.K was supported by a fellowship from the Margaretha af Ugglas Foundation.
Disclosure statement
No potential conflict of interest was reported by the authors.
Supplemental material
Supplemental data for this article can be accessed here.
Additional information
Funding
Related Research Data
References
- Fergusson DM, Boden JM, Horwood LJ. Recurrence of major depression in adolescence and early adulthood, and later mental health, educational and economic outcomes. Br J Psychiatry. 2007;191:335–342.
- Birmaher B, Arbelaez C, Brent D. Course and outcome of child and adolescent major depressive disorder. Child Adolesc Psychiatr Clin N Am. 2002;11(3): 619–637. x.
- Data WLC-i-P. World Health Organization Preventing suicide: a global imperative 2014.
- Mann JJ. Neurobiology of suicidal behaviour. Nat Rev Neurosci. 2003;4(10):819–828.
- Atkinson S, Thurman L, Ramaker S, et al. Safety, tolerability, and efficacy of desvenlafaxine in children and adolescents with major depressive disorder: results from two open-label extension trials. In: CNS Spectrums. 2019;24(5):496–506.
- Lopizzo N, Bocchio Chiavetto L, Cattane N, et al. Gene-environment interaction in major depression: focus on experience-dependent biological systems. Front Psychiatry. 2015;6:68.
- Unternaehrer E, Meyer AH, Burkhardt SCA, et al. Childhood maternal care is associated with DNA methylation of the genes for brain-derived neurotrophic factor (BDNF) and oxytocin receptor (OXTR) in peripheral blood cells in adult men and women. Stress. 2015;18(4):451–461.
- Hing B, Gardner C, Potash JB. Effects of negative stressors on DNA methylation in the brain: implications for mood and anxiety disorders. Am J Med Genet B Neuropsychiatr Genet. 2014;165B(7):541–554.
- Houtepen LC, Hardy R, Maddock J, et al. Childhood adversity and DNA methylation in two population-based cohorts. Transl Psychiatry. 2018;8(1):266.
- Rakyan VK, Blewitt ME, Druker R, et al. Metastable epialleles in mammals. Trends Genet. 2002;18(7):348–351.
- Klengel T, Pape J, Binder EB, et al. The role of DNA methylation in stress-related psychiatric disorders. Neuropharmacology. 2014;80:115–132.
- Bagot RC, Labonté B, Peña CJ, et al. Epigenetic signaling in psychiatric disorders: stress and depression. Dialogues Clin Neurosci. 2014;16(3):281–295.
- Januar V, Saffery R, Ryan J. Epigenetics and depressive disorders: a review of current progress and future directions. Int J Epidemiol. 2015;44(4):1364–1387.
- Lam D, Ancelin M-L, Ritchie K, et al. Genotype-dependent associations between serotonin transporter gene (SLC6A4) DNA methylation and late-life depression. BMC Psychiatry. 2018;18(1):282.
- Lokk K, Modhukur V, Rajashekar B, et al. DNA methylome profiling of human tissues identifies global and tissue-specific methylation patterns. Genome Biol. 2014;15(4):r54.
- Walton E, Hass J, Liu J, et al. Correspondence of DNA methylation between blood and brain tissue and its application to schizophrenia research. Schizophr Bull. 2016;42(2):406–414.
- Davies MN, Volta M, Pidsley R, et al. Functional annotation of the human brain methylome identifies tissue-specific epigenetic variation across brain and blood. Genome Biol. 2012;13(6):R43.
- Hannon E, Lunnon K, Schalkwyk L, et al. Interindividual methylomic variation across blood, cortex, and cerebellum: implications for epigenetic studies of neurological and neuropsychiatric phenotypes. Epigenetics. 2015;10(11):1024–1032.
- Kuan PF, Waszczuk MA, Kotov R, et al. An epigenome-wide DNA methylation study of PTSD and depression in World Trade Center responders. Transl Psychiatry. 2017;7:e1158.
- Byrne EM, Carrillo-Roa T, Henders AK, et al. Monozygotic twins affected with major depressive disorder have greater variance in methylation than their unaffected co-twin. Transl Psychiatry. 2013;3:e269.
- Davies MN, Krause L, Bell JT, et al. Hypermethylation in the ZBTB20 gene is associated with major depressive disorder. Genome Biol. 2014;15(4):R56.
- Cordova-Palomera A, Fatjo-Vilas M, Gasto C, et al. Genome-wide methylation study on depression: differential methylation and variable methylation in monozygotic twins. Transl Psychiatry. 2015;5:e557.
- Córdova-Palomera A, Palma-Gudiel H, Forés-Martos J, et al. Epigenetic outlier profiles in depression: A genome-wide DNA methylation analysis of monozygotic twins. Plos One. 2018;13(11):e0207754.
- Nagy C, Suderman M, Yang J, et al. Astrocytic abnormalities and global DNA methylation patterns in depression and suicide. Mol Psychiatry. 2015;20(3):320–328.
- Sabunciyan S, Aryee MJ, Irizarry RA, et al. Genome-wide DNA methylation scan in major depressive disorder. Plos One. 2012;7(4):e34451.
- Weder N, Zhang H, Jensen K, et al. Child abuse, depression, and methylation in genes involved with stress, neural plasticity, and brain circuitry. J Am Acad Child Adolesc Psychiatry. 2014;53(4):417–24.e5.
- Levesque ML, Casey KF, Szyf M, et al. Genome-wide DNA methylation variability in adolescent monozygotic twins followed since birth. Epigenetics. 2014;9(10):1410–1421.
- Jones MJ, Goodman SJ, Kobor MS. DNA methylation and healthy human aging. Aging Cell. 2015;14(6):924–932.
- Bostrom AE, Ciuculete DM, Attwood M, et al. A MIR4646 associated methylation locus is hypomethylated in adolescent depression. J Affect Disord. 2017;220:117–128.
- Dempster EL, Wong CC, Lester KJ, et al. Genome-wide methylomic analysis of monozygotic twins discordant for adolescent depression. Biol Psychiatry. 2014;76(12):977–983.
- Pérez RF, Santamarina P, Tejedor JR, et al. Longitudinal genome-wide DNA methylation analysis uncovers persistent early-life DNA methylation changes. J Transl Med. 2019;17(1):15.
- Ciuculete DM, Bostrom AE, Voisin S, et al. A methylome-wide mQTL analysis reveals associations of methylation sites with GAD1 and HDAC3 SNPs and a general psychiatric risk score. Transl Psychiatry. 2017;7(1):e1002.
- Voisin S, Almen MS, Zheleznyakova GY, et al. Many obesity-associated SNPs strongly associate with DNA methylation changes at proximal promoters and enhancers. Genome Med. 2015;7:103.
- Shastry BS. SNPs: impact on gene function and phenotype. Methods Mol Biol. 2009;578:3–22.
- Seol DW, Chen Q, Smith ML, et al. Regulation of the c-met proto-oncogene promoter by p53. J Biol Chem. 1999;274(6):3565–3572.
- Morozov VM, Massoll NA, Vladimirova OV, et al. Regulation of c-met expression by transcription repressor Daxx. Oncogene. 2008;27(15):2177–2186.
- Ogunwobi OO, Puszyk W, Dong H-J LC. Epigenetic upregulation of HGF and c-Met drives metastasis in hepatocellular carcinoma. PloS One. 2013;8(5):e63765–e.
- Powell EM, Mars WM, Levitt P. Hepatocyte growth factor/scatter factor is a motogen for interneurons migrating from the ventral to dorsal telencephalon. Neuron. 2001;30(1):79–89.
- Levitt P, Eagleson KL, Powell EM. Regulation of neocortical interneuron development and the implications for neurodevelopmental disorders. Trends Neurosci. 2004;27(7):400–406.
- Sousa I, Clark TG, Toma C, et al. MET and autism susceptibility: family and case-control studies. Eur J Human Genet. 2009;17(6):749–758.
- Poulter MO, Du L, Weaver IC, et al. GABAA receptor promoter hypermethylation in suicide brain: implications for the involvement of epigenetic processes. Biol Psychiatry. 2008;64(8):645–652.
- Murphy TM, Crawford B, Dempster EL, et al. Methylomic profiling of cortex samples from completed suicide cases implicates a role for PSORS1C3 in major depression and suicide. Transl Psychiatry. 2017;7(1):e989.
- Haghighi F, Galfalvy H, Chen S, et al. DNA methylation perturbations in genes involved in polyunsaturated fatty acid biosynthesis associated with depression and suicide risk. Front Neurol. 2015;6:92.
- Campbell DB, Sutcliffe JS, Ebert PJ, et al. A genetic variant that disrupts MET transcription is associated with autism. Proc Natl Acad Sci U S A. 2006;103(45):16834–16839.
- Campbell DB, D’Oronzio R, Garbett K, et al. Disruption of cerebral cortex MET signaling in autism spectrum disorder. Ann Neurol. 2007;62(3):243–250.
- Ursini G, Cavalleri T, Fazio L, et al. BDNF rs6265 methylation and genotype interact on risk for schizophrenia. Epigenetics. 2016;11(1):11–23.
- MacQueen G, Frodl T. The hippocampus in major depression: evidence for the convergence of the bench and bedside in psychiatric research? Mol Psychiatry. 2010;16:252.
- Kim JJ, Diamond DM. The stressed hippocampus, synaptic plasticity and lost memories. Nat Rev Neurosci. 2002;3:453.
- Jay TM, Burette F, Laroche S. NMDA receptor-dependent long-term potentiation in the hippocampal afferent fibre system to the prefrontal cortex in the rat. Eur J Neurosci. 1995;7(2):247–250.
- Thompson SM, Kallarackal AJ, Kvarta MD, et al. An excitatory synapse hypothesis of depression. Trends Neurosci. 2015;38(5):279–294.
- Achim CL, Katyal S, Wiley CA, et al. Expression of HGF and cMet in the developing and adult brain. Brain Res Dev Brain Res. 1997;102(2):299–303.
- Tyndall SJ, Walikonis RS. The receptor tyrosine kinase Met and its ligand hepatocyte growth factor are clustered at excitatory synapses and can enhance clustering of synaptic proteins. Cell Cycle. 2006;5(14):1560–1568.
- Russo AJ, Pietsch SC. Decreased Hepatocyte Growth Factor (HGF) and Gamma Aminobutyric Acid (GABA) in Individuals with Obsessive-Compulsive Disorder (OCD). Biomark Insights. 2013;8:107–114.
- Russo AJ. Decreased serum Hepatocyte Growth Factor (HGF) in individuals with bipolar disorder normalizes after zinc and anti-oxidant therapy. Nutr Metab Insights. 2010;3:49–55.
- Russo AJ. Decreased serum hepatocyte growth factor (HGF) in individuals with depression correlates with severity of disease. Biomark Insights. 2010;5:63–67.
- Yang X-M, Toma JG, Bamji SX, et al. Autocrine hepatocyte growth factor provides a local mechanism for promoting axonal growth. J Neurosci. 1998;18(20):8369–8381.
- Qiu S, Lu Z, Levitt P. MET receptor tyrosine kinase controls dendritic complexity, spine morphogenesis, and glutamatergic synapse maturation in the hippocampus. J Neurosci. 2014;34(49):16166–16179.
- Kempermann G, Kronenberg G. Depressed new neurons–adult hippocampal neurogenesis and a cellular plasticity hypothesis of major depression. Biol Psychiatry. 2003;54(5):499–503.
- Remondes M, Schuman EM. Role for a cortical input to hippocampal area CA1 in the consolidation of a long-term memory. Nature. 2004;431(7009):699–703.
- Hajszan T, MacLusky NJ, Leranth C. Short-term treatment with the antidepressant fluoxetine triggers pyramidal dendritic spine synapse formation in rat hippocampus. Eur J Neurosci. 2005;21(5):1299–1303.
- Cai X, Kallarackal AJ, Kvarta MD, et al. Local potentiation of excitatory synapses by serotonin and its alteration in rodent models of depression. Nat Neurosci. 2013;16(4):464–472.
- Chen F, Madsen TM, Wegener G, et al. Changes in rat hippocampal CA1 synapses following imipramine treatment. Hippocampus. 2008;18(7):631–639.
- Edgar RD, Jones MJ, Meaney MJ, et al. BECon: a tool for interpreting DNA methylation findings from blood in the context of brain. Transl Psychiatry. 2017;7(8):e1187.
- Braun PR, Han S, Hing B, et al. Genome-wide DNA methylation comparison between live human brain and peripheral tissues within individuals. Transl Psychiatry. 2019;9(1):47.
- Kozlenkov A, Jaffe AE, Timashpolsky A, et al. DNA methylation profiling of human prefrontal cortex neurons in heroin users shows significant difference between genomic contexts of hyper- and hypomethylation and a younger epigenetic age. Genes (Basel). 2017;8(6):152.
- Ogino S, Nosho K, Kirkner GJ, et al. A cohort study of tumoral LINE-1 hypomethylation and prognosis in colon cancer. J Natl Cancer Inst. 2008;100(23):1734–1738.
- Goodman R, Ford T, Richards H, et al. and Well-Being Assessment: description and initial validation of an integrated assessment of child and adolescent psychopathology. J Child Psychol Psychiatry. 2000;41(5):645–655.
- Goodman A, Heiervang E, Collishaw S, et al. ‘DAWBA bands’ as an ordered-categorical measure of child mental health: description and validation in British and Norwegian samples. Soc Psychiatry Psychiatr Epidemiol. 2011;46(6):521–532.
- Ciuculete DM, Bostrom AE, Tuunainen A-K, et al. Changes in methylation within the STK32B promoter are associated with an increased risk for generalized anxiety disorder in adolescents. J Psychiatr Res. 2018;102:44–51.
- Zunszain PA, Hepgul N, Pariante CM. Inflammation and depression. Curr Top Behav Neurosci. 2013;14:135–151.
- Zimmerman M, Chelminski I, Posternak M. A review of studies of the Montgomery-Asberg depression rating scale in controls: implications for the definition of remission in treatment studies of depression. Int Clin Psychopharmacol. 2004;19(1):1–7.
- Viner RM, Booy R, Johnson H, et al. Outcomes of invasive meningococcal serogroup B disease in children and adolescents (MOSAIC): a case-control study. Lancet Neurol. 2012;11(9):774–783.
- Jesmin A, Rahman KM, Muntasir MM. Psychiatric disorders in children and adolescents attending pediatric out patient departments of tertiary hospitals. Oman Med J. 2016;31(4):258–262.
- Liu J, Siegmund KD. An evaluation of processing methods for HumanMethylation450 BeadChip data. BMC Genomics. 2016;17(1):469.
- Leek JT, Johnson WE, Parker HS, et al. The sva package for removing batch effects and other unwanted variation in high-throughput experiments. Bioinformatics. 2012;28(6):882–883.
- Houseman EA, Accomando WP, Koestler DC, et al. DNA methylation arrays as surrogate measures of cell mixture distribution. BMC Bioinformatics. 2012;13(1):86.
- Price ME, Cotton AM, Lam LL, et al. Additional annotation enhances potential for biologically-relevant analysis of the Illumina Infinium HumanMethylation450 BeadChip array. Epigenetics Chromatin. 2013;6(1):4.
- Wagner JR, Busche S, Ge B, et al. The relationship between DNA methylation, genetic and expression inter-individual variation in untransformed human fibroblasts. Genome Biol. 2014;15(2):R37.
- Purcell S, Neale B, Todd-Brown K, et al. PLINK: a tool set for whole-genome association and population-based linkage analyses. Am J Hum Genet. 2007;81(3):559–575.
- Delaneau O, Zagury J-F MJ. Improved whole-chromosome phasing for disease and population genetic studies. Nat Methods. 2012;10:5.
- Howie BN, Donnelly P, Marchini J, et al. Accurate genotype imputation method for the next generation of genome-wide association studies. PLoS Genet. 2009;5(6):e1000529.
- ÅK H, Zilmer M, Sundström J, et al. DNA methylation patterns associated with oxidative stress in an ageing population. BMC Med Genomics. 2016;9(1):72.
- Guintivano J, Aryee MJ, Kaminsky ZA. A cell epigenotype specific model for the correction of brain cellular heterogeneity bias and its application to age, brain region and major depression. Epigenetics. 2013;8(3):290–302.
- Reynolds LM, Taylor JR, Ding J, et al. Age-related variations in the methylome associated with gene expression in human monocytes and T cells. Nat Commun. 2014;5:5366.
- Bild DE, Bluemke DA, Burke GL, et al. Multi-ethnic study of atherosclerosis: objectives and design. Am J Epidemiol. 2002;156(9):871–881.
- Duric V, Banasr M, Stockmeier CA, et al. Altered expression of synapse and glutamate related genes in post-mortem hippocampus of depressed subjects. Int J Neuropsychopharmacol. 2013;16(1):69–82.
- The EPC. An integrated encyclopedia of DNA elements in the human genome. Nature. 2012;489(7414):57–74.
- Consortium GT, Aguet F, Brown AA, et al. Genetic effects on gene expression across human tissues. Nature. 2017;550:204.
- Machiela MJ, Chanock SJ. LDlink: a web-based application for exploring population-specific haplotype structure and linking correlated alleles of possible functional variants. Bioinformatics. 2015;31(21):3555–3557.
- Barrett JC, Fry B, Maller J, et al. Haploview: analysis and visualization of LD and haplotype maps. Bioinformatics. 2005;21(2):263–265.