
 ?Mathematical formulae have been encoded as MathML and are displayed in this HTML version using MathJax in order to improve their display. Uncheck the box to turn MathJax off. This feature requires Javascript. Click on a formula to zoom.
ABSTRACT
SIRT1, a NAD+-dependent deacetylase, is the most well-studied member of class III histone deacetylases. Due to its wide range of activities and substrate targets, this enzyme has emerged as a major regulator of different physiological processes. However, SIRT1-mediated alterations are also implicated in the pathogenesis of several conditions, including metabolic and neurodegenerative disorders, and cancer. Current evidence highlights the potential role of SIRT1 as an attractive therapeutic target for disease prevention and treatment strategies, thus propelling the development of new pharmacological agents. By high-throughput screening of a large library of compounds, we identified SCIC2 as an effective SIRT1 activator. This small molecule showed enzymatic activity of 135.8% at 10 μM, an AC50 value of 50 ± 1.8 µM, and bound SIRT1 with a KD of 26.4 ± 0.6 μM. In order to potentiate its SIRT1-activating ability, SCIC2 was subjected to modelling studies, leading to the identification of a more potent derivative, SCIC2.1. SCIC2.1 displayed higher SIRT1 activity (175%; AC50 = 36.83 ± 2.23 µM), stronger binding to SIRT1, and greater cell permeability than SCIC2. At cellular level, both molecules did not alter the cell cycle progression of cancer cells and normal cells, and were able to strengthen SIRT1-mediated effects in stress response. Finally, SCIC2 and SCIC2.1 attenuated induction of senescence by reducing senescence-associated β-galactosidase activity. Our findings warrant further investigation of these two novel SIRT1 activators in in vivo and human studies.
Introduction
Silent information regulator 2 (Sir2) proteins, also known as sirtuins (SIRTs), constitute class III of the histone deacetylase (HDAC) family. Their catalytic activity requires nicotinamide adenine dinucleotide (NAD+) as cofactor [Citation1].
Following its discovery in Saccharomyces cerevisiae as mating-type regulator 1 (MAR1), Sir2 was found to play an important role in suppressing ribosomal DNA recombination and gene silencing [Citation2–Citation4]. Its yeast homologs with high sequence similarity Hst1-4p are involved in silencing at the mating-type loci and telomeres, cell cycle progression, chromosomal stability, and longevity [Citation5,Citation6]. SIR2 homologs were subsequently identified in a variety of organisms, from prokaryotes to eukaryotes [Citation7]. Mammals have seven SIRTs (SIRT1–7), which differ in the sequence of the catalytic domain (CD), length of the N/C-terminal domains, cellular localization, and catalytic action [Citation8].
The biochemical activity of SIRTs is not restricted to deacetylation but includes other reactions: ADP-ribosylation (SIRT4/6), deacylation (SIRT6), desuccinylation (SIRT5/7), deglutarylation (SIRT5), demalonylation (SIRT5), demyristoylation, and depalmitoylation (SIRT6) [Citation9,Citation10]. Although all SIRTs are regulated at DNA, RNA, and protein level, they are mainly controlled by dynamic changes in NAD+ levels and the NAD/NADH ratio [Citation7,Citation11]. Besides histones, a multitude of non-histone proteins such as transcription factors (p53, NF-kB, PGC1α) and DNA repair proteins (Ku70, PARP1) [Citation12] are recognized as SIRT targets. Through their numerous substrates, SIRTs control different molecular pathways including energy metabolism, cell survival, DNA repair, tissue regeneration, inflammation, neuronal signalling, and even circadian rhythms [Citation13,Citation14]. SIRT1, the most well-studied member of the SIRT family [Citation15], has a role in all these processes. Depending on the availability of its cofactor NAD+, SIRT1 is involved in different metabolic pathways regulating the energetic state of the cell. A growing body of evidence indicates that NAD+ up-regulation or SIRT1 overexpression simulates conditions of calorie restriction leading to beneficial effects, including enhanced mitochondrial biogenesis, insulin sensitivity, and a lower incidence of age-related diseases [Citation16]. The acetylation state of SIRT1 substrates is therefore implicated in the pathogenesis of several conditions such as cancer, inflammation, cardiovascular and neurodegenerative diseases, diabetes, and ageing [Citation17].
In light of its involvement in a number of human diseases as well as its health benefits, SIRT1 has emerged as an attractive drug target for the treatment of various disorders [Citation13]. In recent years, several studies adopting different approaches including high-throughput screening (HTS), computer- or fragment-based screenings, focused library screening in combination with extensive structure-activity relationship studies, and in vitro and in vivo tests have identified and characterized small molecules able to modulate SIRT1 activity [Citation18].
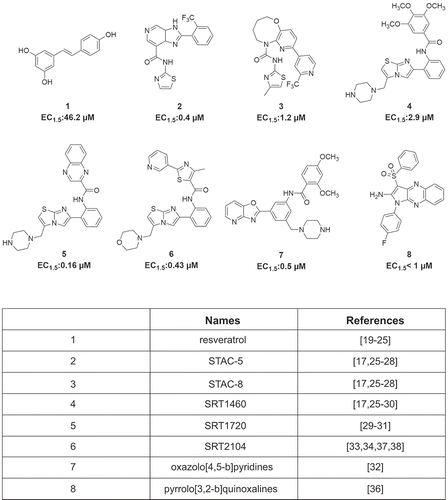
The first identified SIRT1 activator was resveratrol, currently used in the treatment of various diseases [Citation19–Citation24]. Recent efforts have focused on discovering new synthetic SIRT1-activating compounds (STACs) [Citation25,Citation26]. Of these, STAC-1 (or SRT1460), STAC-5, and STAC-8 are able to modulate SIRT activity more potently than resveratrol [Citation17,Citation25,Citation27,Citation28]. Some SIRT1 activators were found to exhibit beneficial effects: SRT1460, SRT1720 [Citation29–Citation31], some oxazolo(4,5-b)pyridines [Citation32], and SRT2104 [Citation33–Citation35] show antidiabetic action, while pyrrolo(3,2-b)quinoxalines [Citation36] exert anti-inflammatory activity (). SRT2104 (or GSK2245840) was in fact tested in 14 Phase 1 and 2 clinical trials (see https://clinicaltrials.gov/ct2/results?cond=SRT2104) [Citation37,Citation38].
Figure 1. Some known natural and synthetic STACs. Structures and concentrations required to increase SIRT1 activity by 50% above control (EC1.5) of the small molecules indicated.
SIRT activity can also be inhibited by several SIRT inhibitors (SIRTi) [Citation25]. The most potent and selective SIRT1i is EX-527 (selisistat or SEN0014196) [Citation39], which displayed robust neuroprotective activity in in vitro and in vivo models of Huntington’s disease [Citation40]. It was used in four clinical trials for this brain disorder and proved to be safe and well tolerated in patients (https://clinicaltrials.gov/ct2/results?cond=&term=SEN0014196) [Citation41].
Despite these encouraging results, few STACs have been identified to date, and no SIRTi have as yet been approved for clinical use [Citation42].
Given the therapeutic potential of SIRT1 and the limitations of known SIRT1-modulating molecules, identifying novel selective SIRT modulators, particularly activators, may contribute to designing more effective pharmaceutical drugs.
STACs exhibit better therapeutic efficacy than SIRTi and could improve health outcomes, extending the human lifespan [Citation14]. By binding the CD or a regulatory region outside the protein, SIRT activators present more target specificity. However, activators mimicking the natural mechanism of SIRTs may cause side effects [Citation14]. Hence, there is a pressing need to intensify drug discovery programmes to find more potent and selective compounds.
Here, using an HTS approach we identified and characterized a promising novel SIRT1 activator (named SCIC2). SCIC2 is able to activate SIRT1, with enzymatic activity of 135.8% at 10 μM and an AC50 value of 50 ± 1.8 μM. It directly binds the enzyme with an equilibrium dissociation constant (KD) of 26.4 ± 0.6 μM. Its optimization led to the identification of a more potent derivative (SCIC2.1) displaying increased activity (175% at 10 μM) and enhanced cellular target engagement, as evaluated by cellular thermal shift assay (CETSA). Both compounds showed no cytotoxicity and did not alter cell growth. In cancer and normal cell systems, SCIC2 and SCIC2.1 enhanced SIRT1-mediated effects in genotoxic response, making them promising agents for various therapeutic applications.
Results
Identification of new STACs by HTS
To identify novel SIRT modulators, an in-house library of 30,000 natural and synthetic compounds was screened. An in vitro fluorescence assay developed by our laboratory was optimized for HTS using a TECAN robotic station. This assay correlates SIRT1 deacetylase activity with production (and quantification) of ammonia by coupling two reactions catalysed by SIRT1 and nicotinamidase (NMase). The screened in-house library was compiled using various computational methods such as the study of a 3D pharmacophore and 2D fingerprinting.
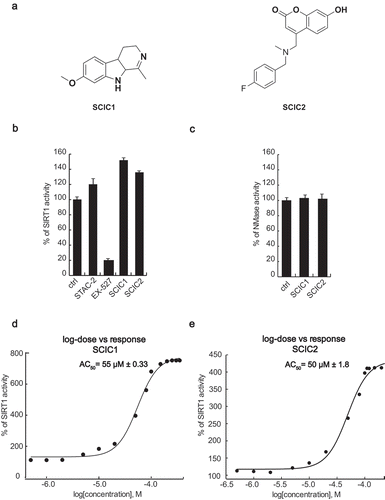
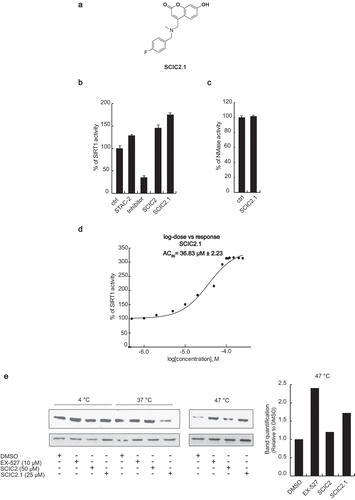
All the 30,000 compounds were first tested at 10 µM concentration and about 150 molecules were pre-selected (data not shown). A compound was considered to be a SIRT1 activator when, at the tested concentration, it increased enzymatic activity to ≥ 120% and a SIRT1 inhibitor when the resulting enzymatic activity was ≤ 70%. Having confirmed its effect, each hit was subjected to intrinsic fluorescence (to exclude false positives) and counter-screening (to exclude NMase modulators) assays. Around 30 compounds were consequently selected as true SIRT1 modulators and a concentration-response curve for AC50/IC50 determination was performed for each one. The entire screening process identified SCIC1 and SCIC2 as promising SIRT1 activators ()). Both compounds showed higher enzymatic activity on SIRT1 than the reference activator (STAC2) [Citation27] (with enzymatic activity resulting 151.8% and 135.8% for SCIC1 and SCIC2, respectively; )). No NMase modulation was observed for either compound ()). SCIC1 and SCIC2 activities were detected, with AC50 values of 55 ± 0.33 μM and 50 ± 1.8 μM, respectively (). Subsequent investigations into SCIC2 were based on these data.
Figure 2. In vitro identification and characterization of SCIC1 and SCIC2. (a) Chemical structures. (b) SIRT1 assay for SCIC1 and SCIC2 at 10 μM. STAC2 and EX-527 (at 10 μM) were used as enzymatic controls. (c) NMase assay for SCIC and SCIC2. (d-e) Dose-response curve determining AC50 of SCIC1 (d) and SCIC2 (e). Values are mean ± SD; experiments were performed in triplicate.
Characterization of SIRT1-molecule interaction
To assess whether SCIC1/2-mediated SIRT1 activation was due to a direct enzyme/compound interaction, a surface plasmon resonance (SPR) analysis was performed (). Full-length recombinant SIRT1 was immobilized on a sensor chip with carboxymethylated dextran covalently attached to a gold surface, which was then exposed to the two molecules in flow phase. Compound binding induced a change in the refractive index on the sensor surface. The ability of the drugs to bind SIRT1 was defined by its KD value [Citation43].
Figure 3. Surface plasmon resonance study on interaction of SCIC1 and SCIC2 with SIRT1. Binding affinity was measured as equilibrium dissociation constant (KD). EX-527 was used as positive control.
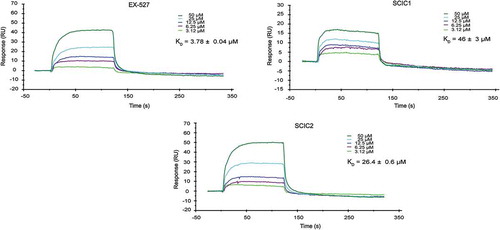
SPR response data were obtained for a series of SCIC1/2 injections from 50 μM to 3.12 μM concentration (). The kinetic affinity constants of the molecules were compared to the KD values of EX-527, used as a positive control [Citation44] due to its direct binding properties at the SIRT1 CD.
Our findings show that both molecules were able to bind SIRT1, but SCIC2 binding was stronger than that of SCIC1, with a KD of 26.4 ± 0.6 μM vs 46 ± 3 μM.
Molecular modelling calculation of binding between compounds and SIRT1
To gain a greater insight into the binding interactions between SCIC2 and the SIRT1 target enzyme, molecular modelling calculations were performed. The crystal structure of human SIRT1 in complex with a STAC was recently reported [Citation45]. Given the intrinsic difficulties in crystallizing full-length SIRT1, in the above-referenced study the authors developed a less flexible construct (mini-SIRT1) containing the minimal structural elements required for maintaining the enzymatic activity of the wild-type enzyme as well as the capability of being inhibited and activated by small molecules. With this protein model, the authors demonstrated that the co-crystal STAC is able to make direct contact with the N-terminal domain (NTD) of the enzyme. In this position, the ligand occupies a shallow pocket where hydrophobic and polar contacts mediate ligand-protein recognition. Of note, the NTD in this structure is distant from the CD.
In another structural study [Citation46], the 3D conformation of a SIRT1 construct in complex with the resveratrol ligand and a 7-amino-4-methylcoumarin (AMC)-containing peptide was solved. Here, resveratrol was sandwiched between the AMC moiety and the NTD domain, which is now located close to the rest of the protein. Regardless of the different experimental conformations as well as protein constructs used, both these studies [Citation45,Citation46] propose a shared mechanism of action for SIRT1 activation in which the ligand induces a conformational transition bringing the NTD and CD close to each other, thereby enhancing binding to the enzyme substrate. We therefore speculated whether our most active compound, SCIC2, might be able to positively interact with the SIRT1 allosteric binding site and induce such a transition. To this end, molecular docking simulations were performed using both the above-described X-ray structures with PDB codes 4ZZH (open and inactive state [Citation45] and 5BTR (closed and activated state [Citation46]).
Analysis of the docking results obtained using the inactive state structure revealed that SCIC2 is able to make several contacts with residues lining the NTD shallow pocket of SIRT1 ()). Specifically, the coumarin core structure is able to engage in H-bond interactions with the N226 side chain and several hydrophobic contacts with I223 and I227 ()). Interestingly, the negatively charged oxygen atom in position 7 of the coumarin scaffold points towards the E230 residue. This residue is reported to be critical for SIRT1 allosteric activation [Citation27] mediated by many STACs. Noteworthy, analysis of the X-ray structure reveals that the co-crystal STAC also places an aromatic electron-rich ring (oxazole) in proximity to the negatively charged E230 residue, while the pendant benzyl(methyl)aminomethyl chain in position 4 of the coumarin core makes favourable contact with L106, P211, and L215 chains.
Figure 4. Molecular modelling of recognition between SCIC2 and SIRT1. (a) Binding mode of SCIC2 to SIRT1 open conformation structure. Protein surface is coloured orange (NTD) and cyan (CD), and ligand is represented by grey spheres. (b) Close-up view of SCIC2 binding mode as predicted by docking calculations. Protein is shown as orange stick and ribbons, and ligand as grey sticks. (c) Binding mode of SCIC2 to SIRT1 closed conformation structure. Protein surface is coloured orange (NTD) and cyan (CD), and ligand is represented by grey spheres. (d) Close-up view of SCIC2 binding mode as predicted by docking calculations. Protein is shown as orange stick and ribbons, and ligand as grey sticks. (e) X-ray binding mode of resveratrol (green sticks) superimposed on the theoretical one of SCIC2 (grey sticks). Protein is shown as orange and cyan ribbons.
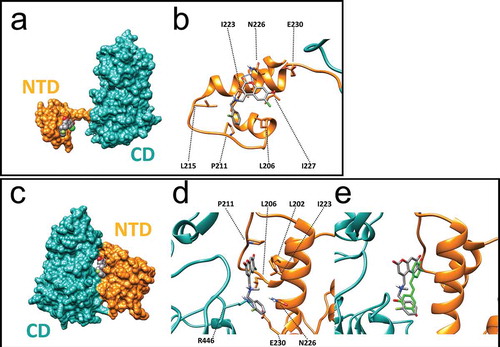
When docking was attempted on the activated state structure (5BTR), SCIC2 was predicted to interact at the interface between NTD and CD regions ()). In the activated SIRT1 conformation, the ligand makes contact with the hydrophobic residues of the NTD (L202, L206, and I223), while the benzyl moiety points towards the E230 side chain ()). Of note, in this conformation, the latter residue forms an ionic interaction with the R446 side chain belonging to the SIRT1 CD. Importantly, such an interaction was postulated to stabilize the activated conformation of SIRT1. Comparison of the achieved binding pose with the crystal structure of SIRT1 and resveratrol shows that the two ligands occupy the same enzyme region, supporting the idea that both ligands might activate the enzyme through the same mechanism of action ()).
Taken together, molecular modelling studies suggest that the NTD/SCIC2 recognition event may trigger stabilization of a closed/activated conformation of SIRT1, which is more conducive to enzymatic catalysis.
SCIC2 lead optimization
In an attempt to potentiate the promising capacity of SCIC2 to activate SIRT1, additional molecular modelling studies were carried out. SCIC2 has a coumarin scaffold. Coumarin is a natural chemotype present in several compounds with different pharmacological activities (anticoagulant, CNS-active, anti-HIV, antitumor, and anti-inflammatory) [Citation47]. Because of the number of its documented pharmacological activities and its amenability to combinatorial chemistry, the coumarin scaffold is a privileged structure in medicinal chemistry.
Given the high synthetic accessibility of coumarins, we first searched for SCIC2 structural analogues in commercial molecular databases. This strategy has the benefit of quickly delivering a database of structural congeners of the lead compound with relative cost-efficiency. Next, the simple pairwise Tanimoto similarity score [Citation48] was computed between SCIC2 and the compounds in the Mcule Purchasable (In Stock) database (∼9 million compounds) using a 70% similarity threshold. This resulted in 2,500 compounds that were docked into the SIRT1 closed structure employing the same protocol used to dock SCIC2. The best compounds in terms of predicted binding affinity were subsequently purchased as pure substances and analysed by enzymatic assay in HTS mode. From this screening, SCIC2.1 was identified as an active SCIC2 derivative ()). SCIC2.1 strongly activated SIRT1, inducing higher enzymatic activity than SCIC2 (175% vs 135.8%; )). No NMase modulation was observed ()). SCIC2.1 activity was detected, with an AC50 value of 36.83 ± 2.23 μM ()).
Figure 5. In vitro identification of SCIC2.1. (a) Chemical structure. (b) SIRT1 assay for SCIC2.1. STAC2, EX-527, and SCIC2 (at 10 μM) were used as enzymatic controls. (c) NMase assay for SCIC2.1. (d) Dose-response curve determining AC50 of SCIC2.1. (e) Western blot analysis for SIRT1 and relative quantization based on CETSA. Values are mean ± SD; experiments were performed in triplicate.
SCIC2 and SCIC2.1 directly bind SIRT1 in cells
To further support the molecular modelling calculations and to investigate the interaction between the compounds and SIRT1 in a physiological cellular environment, CETSA was performed in hepatocellular carcinoma HepG2 cells. Compared to the control (DMSO), both SCIC2 and SCIC2.1 protected SIRT1 from thermal degradation in protein extract of HepG2 cells treated with the drugs. SIRT1 signal remained at the highest temperature of 47°C, while no signal was detected in the control extract ()). Of note, SCIC2.1 protected SIRT1 better than SCIC2.
These results confirm a physical interaction between the two drugs and SIRT1.
SCIC2 and SCIC2.1 are stable drugs and cross cell membrane
Cell permeability and stability are major concerns for drug candidates interacting with cytoplasmic targets, in many cases hampering their full biological capitalization. We therefore investigated SCIC2 and SCIC2.1 cell permeability in the intestinal cancer Caco-2 cell line and metabolic stability in both HepG2 cell lysate and human serum. Cell-based studies were used to highlight potential drawbacks of SCIC2 and SCIC2.1, including low cytoplasmic penetration and/or stability that could lead to misinterpretation of the outcome of subsequent cellular experiments. We also preliminarily assessed the serum stability of SCIC2 and SCIC2.1 to obtain data useful for setting up future in vivo experiments. For the cell permeability assay we exploited the Caco-2 cell line, which under specific culture conditions becomes differentiated and polarized, resembling epithelial cells of human intestine and representing a suitable in vitro model to study drug permeability [Citation49,Citation50].
Our results show that both compounds were able to cross the Caco-2 cell monolayer. Specifically, after three hours of treatment, SCIC2 and SCIC2.1 showed a 18% and 24.5% increase in permeability, respectively ().
Table 1. In vitro evaluation of SCIC2 and SCIC2.1 permeability.
Stability experiments in cell medium and human serum were then carried out by modifying a protocol previously described [Citation51]. Briefly, a 5 mM water solution (3% DMSO) of SCIC2 and SCIC2.1 was diluted with 90% HepG2 cell medium, and at different time intervals aliquots of the mixture were collected, treated with 0.1% trifluoroacetic acid (TFA) acetonitrile solution to precipitate the proteins, and analysed by reversed-phase high-performance liquid chromatography electrospray ionization (RP-HPLC-ESI). SCIC2.1 and its parent analogue SCIC2 remained substantially unaltered up to 180 min (maximum time of observation) in both HepG2 cell medium and human serum ().
Table 2. HepG2 cell medium and human serum (HS) stability profiles of SCIC2 and SCIC2.1 after different intervals of incubation. Relative concentrations and identity of the compounds were determined by integration of the A220 peaks from RP-HPLC-ESI.
Taken together, these results supported the use of the compounds in all subsequent cell-based experiments aimed at investigating the effects of the interaction between SCIC2/SCIC2.1 and SIRT1.
SCIC2 and SCIC2.1 do not affect cell growth
After molecular characterization, the cytotoxic effects of the two compounds were tested in both normal and cancer cell lines. Cardiomyoblast H9c2 cells and HepG2 cells were left untreated or treated for 24 h with SCIC2 (50 μM), SCIC2.1 (25 μM), or the well-characterized SIRTi EX-527 (10 μM). After incubation, cell cycle progression was determined by FACS analysis. Compared to untreated cells, both compounds did not significantly affect cell distribution over cell cycle phases (). Furthermore, neither molecule was able to induce cell death, expressed as a percentage of cells in pre-G1 phase ().
Figure 6. SCIC2 and SCIC2.1 do not affect cell cycle of HepG2 and H9c2 cell lines. (a−b) FACS analysis showing cell cycle progression of HepG2 (a) and H9c2 (b) cells. (c−d) Cell death analysis of HepG2 (c) and H9c2 (d) cells. Values are mean ± SD; experiments were performed in triplicate.
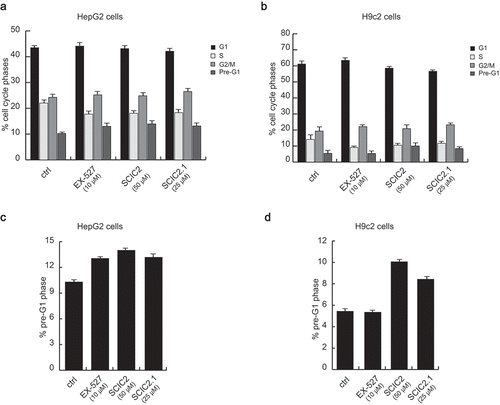
These results show that SCIC2 and SCIC2.1 did not affect cancer and normal cell growth.
SCIC2 and SCIC2.1 potentiate SIRT1-mediated effects in stress response
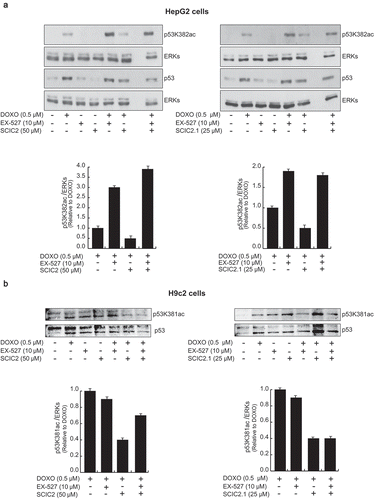
Many genotoxic stresses are reported to enhance acetylation of p53 in its C-terminal region, increasing its activity and leading to cell growth arrest. SIRT1 is able to deacetylate p53, attenuating p53 transcription-dependent apoptosis upon DNA damage and oxidative stress. To study the role of SCIC2 and SCIC2.1 in modulating SIRT1-mediated functions in stress responses, the deacetylation activity of SIRT1 on p53 was investigated. Western blotting analyses were performed on HepG2 cells pre-treated with the genotoxic drug doxorubicin (DOXO) at 0.5 μM for 12 h, and then with SCIC2 or SCIC2.1 at 50 µM and 25 µM and/or with EX-527 at 10 μM for 6 h. The effect of the molecules on SIRT1-deacetylating activity was monitored by following the signal of p53 acetylated at K382 (p53K382ac; )). The data confirmed that SCIC2 and SCIC2.1 played an opposite role to EX-527 on acetylation status of p53 in regulating DNA damage. Specifically, SCIC2 and SCIC2.1 decreased DOXO-mediated p53K382ac, suggesting their potential role in enhancing SIRT1-dependent p53 deacetylation. Interestingly, both drugs, though SCIC2.1 more effectively, competed with EX-527 in binding to SIRT1, as shown in cells treated with all three compounds. Via SIRT1 activation, the two drugs strongly attenuated the effects of DNA damage. In the same experimental conditions, p53K381ac resulted decreased in H9c2 cells, corroborating this hypothesis. EX-527-mediated SIRT1 inactivation exerted the opposite effect, increasing p53 acetylation. This EX-527-induced effect was again attenuated by the co-presence of SCIC2 and SCIC2.1 ()).
Figure 7. Effects of SCIC2 and SCIC2.1 on p53 acetylation. (a−b) Western blot analyses for p53 and p53K382/381ac from whole extracts of HepG2 and H9c2 cells treated with indicated compounds at indicated doses and times. Band quantification was performed using ImageJ software. Values are mean ± SD; experiments were performed in triplicate.
Further investigations will be required to understand which pathways are involved in this response.
SCIC2 and SCIC2.1 attenuate cellular senescence
Increasing evidence correlates senescence with SIRTs. Specifically, down-regulation of SIRTs induces early cell senescence and accelerates ageing processes [Citation52].
Senescence-associated β-galactosidase (SA β-gal) activity was therefore investigated to assess the effect of SCIC2 and SCIC2.1 in HepG2 and H9c2 cell lines. Briefly, the cells were induced to senescence by co-treatment with DOXO at 0.5 μM, and SCIC2/SCIC2.1 at 50 µM and 25 µM, respectively. After 48 h, the percentage of SA β-gal-positive cells was quantified for each condition. The presence of DOXO induced about 60% of SA β-gal-positive HepG2 cells and 35% of H9c2 cells (). The addition of SCIC2 and SCIC2.1 led to a reduction of ~20% and ~15% in the number of SA β-gal-positive HepG2 and H9c2 cells, respectively. Given that it is a good SIRT1i, EX-527 did not affect levels of SA β-gal.
Figure 8. Effect of SCIC2 and SCIC2.1 on senescence in HepG2 and H9c2 cell systems. (a-b) Analysis of senescence-associated β-galactosidase (SA-β-gal) activity in HepG2 (a) and H9c2 (b) cells. Panels represent the ratio between positive (green) cells and total cells. Values are mean ± SD; experiments were performed in triplicate.
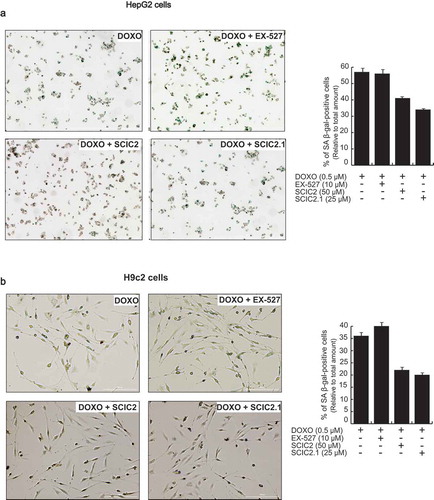
Taken together, these data show that SCIC2 and SCIC2.1 may attenuate the induction of senescence.
Discussion
A growing body of evidence suggests that SIRTs play a key role in modulating several signalling pathways [Citation18]. The acetylation state of numerous SIRT substrates is associated with lifespan-related diseases such as diabetes, metabolic syndrome, cancer, inflammation, and neurodegenerative disorders [Citation53,Citation54].
Major efforts are currently focusing on SIRT1, the most studied SIRT [Citation55], which is involved in regulating metabolic homoeostasis in several tissues [Citation11], in various cell processes such as stress response [Citation56], apoptosis [Citation57], and gene stability [Citation58], and in human diseases including neurodegenerative disorders, cancer, and cardiovascular disease [Citation59,Citation60].
SIRT1 has been suggested as an anti-ageing protein and its up-regulation leads to health benefits in different organisms [Citation61]. Scientific interest is therefore increasingly focused on SIRT1 as a potential therapeutic target. Several pharmacological interventions are aimed at increasing SIRT1 activity to delay the onset of ageing and age-associated diseases. Although resveratrol remains the most well-characterized first-generation STAC, its therapeutic role in degenerative and metabolic diseases is still controversial. Hence, the scientific challenge is to discover and characterize novel STACs to improve quality of life, reduce age-associated diseases, and extend lifespan [Citation13].
Here, by HTS of a large library of compounds, we identified SCIC2 as a potent SIRT1 activator. This small molecule showed enzymatic activity of 135.8%, an AC50 value of 50 ± 1.8 µM, and bound SIRT1 with a KD of 26.4 ± 0.6 μM. Molecular modelling studies showed that the NTD/SCIC2 recognition event should trigger the stabilization of a closed/activated conformation of SIRT1, which is more conducive to enzymatic catalysis. It is also tempting to speculate that the unfavourable electrostatic interactions between SCIC2 and the adjacent E230 residue, detected in our theoretical model, might shift the protein conformational equilibrium to the closed state in which the E230-R446 ionic interaction anchors NTD and CD in close proximity. Here, like resveratrol, the ligand should be able to stabilize enzyme/substrate interactions, thereby enhancing SIRT1 processivity ().
In order to potentiate its SIRT1-activating capability, SCIC2 was subjected to modelling studies, leading to the identification of a more potent derivative, SCIC2.1. SCIC2.1 displayed higher SIRT1 activity (175%; AC50 = 36.83 ± 2.23 µM) and stronger binding to SIRT1 than SCIC2. SCIC2.1 also showed greater cell permeability than SCIC2, probably due to the presence of different groups, as the absence of a chlorine atom makes SCIC2.1 negatively charged and not a zwitterion like SCIC2. At cellular level, both molecules did not alter the cell cycle progression of cancer cells and normal cells () and potentiated SIRT1-mediated effects in stress response (). Finally, SCIC2 and SCIC2.1 attenuated senescence induction by reducing SA β-gal activity ().
Taken together, our results identify SCIC2 and SCIC2.1 as promising SIRT1 activators. Further studies will be necessary to better optimize the molecules and to understand their molecular mechanism(s) of action. It will thus be possible to determine which genes and signalling pathways are responsible for the observed SCIC2/SCIC2.1-induced effects.
Materials and methods
Enzyme purification
SIRT1-GST enzyme (glutathione S-transferase) was purified by Escherichia coli BL21 bacteria after transfection with pGEX-SIRT1 (Addgene) plasmid. One selected bacterial colony was grown in LB broth medium (Lennox) supplemented with antibiotics (100 μg/mL ampicillin) in a shaking incubator overnight. When optical density was in a range between 0.6 and 0.8, protein expression was induced by isopropyl-β-D-1-thiogalactopyranoside (IPTG; AppliChem) at 200 μM concentration for 5 h. The bacteria were centrifuged at 3000 rpm (Beckman centrifuge) for 20 min and the pellet was then lysed by sonication (Bioruptor; Diagenode) in lysis buffer containing phosphate buffered saline (PBS), 1 mM dithiothreitol (DTT; Applichem), 0.5 mM phenylmethylsulfonyl fluoride (AppliChem), and 1 tablet of mini protease inhibitor cocktail (PIC; Roche) for each 10 mL. Sonication was performed for 10 cycles of 45 sec at 14,000 MHz with intervals of 30 sec between each sonication. Then, Triton X100 0.1% (Acros) was added and the solution was incubated for 15 min in ice. The sonicate was then centrifuged at 13,000 rpm for 30 min and filtered with a filter of 0.45 μm pore size. The enzyme was purified using GSTrap 4B columns (GE Healthcare Life Sciences). The columns were equilibrated with 20 mL lysis buffer. Next, the lysate was loaded onto columns and subsequently they were washed with the lysis buffer. The elution was carried out with 20 mL elution buffer composed of 50 mM Tris-HCl pH 8.0, 1 mM DTT, 20 mM L-glutathione reduced (AppliChem), and ddH2O. SIRT1-GST protein was detected using colorimetric methods (Bradford protein assay; Biorad). The purified human SIRT1 recombinant was dialysed in water solution (50 mM Tris-HCl pH 8.0, 100 mM NaCl, 1 mM DTT, 1 PIC tablet/10mL) overnight at 4 °C. The following day, the samples were cryopreserved in 20% glycerol (Sigma-Aldrich).
NMase-histidine tag enzyme was expressed in E. coli BL21 bacteria. Bacteria were grown in LB broth medium supplemented with antibiotics (100 μg/mL ampicillin) in a shaking incubator overnight at 37°C. When optical density was 0.7, IPTG was added at 1 mM concentration for 5 h. The bacteria were centrifuged at 3000 rpm for 20 min and the pellet was then lysed using lysis buffer A composed of 50 mM NaH2PO4 pH 8.0, 300 mM NaCl, 10 mM imidazole (Applichem), 100 mg/50 mL lysozyme (Applichem), and 1 tablet of PIC for each 10 mL. The bacterial lysate was incubated in ice for 30 min and then sonicated for 10 cycles of 45 sec at 14,000 MHz with intervals of 30 sec between each sonication. The lysate was then filtered with a filter of 0.45 μm pore size and incubated for 3 h at 4°C with 1 mL nickel-NTA agarose resin (ABT) pre-equilibrated with equilibration buffer (EQ; 50 mM NaH2PO4 pH 8.0, 300 mM NaCl, 20 mM imidazole in ddH2O). Subsequently, the column was washed with EQ and the enzyme was eluted with a buffer composed of 50 mM NaH2PO4 pH 8.0, 300 mM NaCl, 250 mM imidazole, and 1 tablet of PIC for each 10 mL, and the samples were cryopreserved in 20% glycerol.
SIRT1 fluorescence assay in HST mode
Fluorescence assay was performed in 384-well plates (Corning 384 flat bottom black polystyrene) with a reaction volume of 15 μL. Plates were pre-loaded with the reaction controls, STAC2 as activator, and EX-527 (Selisistat; Sigma) as inhibitor, in the upper left and bottom right side wells with a D300 Digital Dispenser (TECAN) using HP’s Direct Digital Dispensing technology, and for each plate 160 compounds were tested. All compounds were dissolved in DMSO (Sigma-Aldrich).
The reaction buffer (PBS, 1mM DTT, and 0.6% DMS), compounds at 10 mM, SIRT1 at a dilution of 1 mg/mL, and Nmase enzyme mix (NMase-purified enzyme, β-NAD intermediate dilution at 1 mM, and acetylated peptide p53K382 intermediate dilution at 250 μM, synthesized by INBIOS), were placed in the automated dispenser.
Firstly, the automated platform generated compound dilutions (from 10 mM to 10 μM) and added the mixture of the SIRT1-purified enzyme to the whole plate except for the negative control wells. After incubation for 15 min at 37°C, the NMase enzyme mix was added and incubated for 40 min at 37°C, after which the buffer developer (70% PBS, 30% ethanol, 10 mM DTT, and 10 mM o-phthalaldehyde [Acros]) was added and incubated for 30 min in the dark. Fluorescence reading was performed using an Infinite M1000 microplate reader (TECAN) at 420/460 nm.
The HTS platform allowed us to obtain highly reproducible data in terms of z’ and standard deviation. The compound was identified as a SIRT1 activator when its activity was ≥ 120% and as a SIRT1 inhibitor when its activity was ≤ 70%.
Counter-screening for NMase
The compounds were tested by fluorescence assay in the presence of NMase enzyme only. The assay was carried out in a 96-well plate with the same positive and negative reaction controls as the SIRT1 fluorescence assay. Each compound was always tested at 10 μM and therefore 5 μL of intermediate compound dilution (50 μM) was added to 5 μL reaction buffer that simulated SIRT1 enzyme and to NMase enzyme mix (NMase-purified enzyme, 1 mM intermediate nicotinammide dilution and peptide p53 acetylated at K382). After 40 min incubation at 37°C, the developer buffer was added and the plate was again incubated in the dark for 30 min at 37°C. Fluorescence was read at 420/460 nm using an Infinite M1000 reader.
Evaluation of intrinsic fluorescence
The compounds, resuspended in the reaction buffer, were placed in a 96-well black plate and incubated for 40 min at 37°C. Fluorescence was read at 420/460 nm using an Infinite M1000 reader.
AC50/IC50 evaluation
The compounds were loaded (from 0.01 μM to 100 μM) into a 96-well plate using HP D300 Digital Dispenser technology. The assay was conducted following the same conditions as the SIRT1 fluorescence assay. AC50/IC50 values were calculated using GraphPad Prism software (GraphPad Software).
Surface plasmon resonance
SPR analyses were performed on a Biacore 3000 optical biosensor equipped with research-grade CM5 sensor chips (Biacore). Recombinat SIRT1-GST enzyme was immobilized (30 μg/mL in 10 mM sodium acetate pH 4.5) at a flow rate of 10 μL/min using standard amine-coupling protocols to obtain densities of 8 − 9 kRU. All compounds were dissolved in DMSO (100%) to obtain 50 mM solutions and diluted in HBS-P (10 mM HEPES pH 7.4, 0.15 M NaCl, 0.005% surfactant P20), always maintaining a final 0.2% DMSO concentration. Binding experiments were performed as previously described [Citation62].
Molecular modelling methods
SIRT1 enzyme structures (PDB ID: 4ZZH and 5BTR) were retrieved from the PDB. These structures were prepared for docking calculations with the Protein Preparation Wizard utility in Schrödinger’s Maestro suite. Specifically, using the ‘preprocess and analyze structure’ tool, hydrogen atoms were added, every water molecule was removed, and bond orders and disulphide bonds were calculated. The Epik 2.0 program predicted the side chain hetero group ionization and tautomeric states while ‘H-Bond assignment’ was used to optimize the hydrogen bonds. Lastly, minimization of the hydrogen atoms was carried out with the ‘impref utility’, while restraining the heavy atoms in place.
Subsequently, the structure of SCIC2 was constructed using the 2D Sketcher tool in Schrödinger’s Maestro suite. For the SCIC2 analogs, the .sdf file of the Mcule database was downloaded from the vendor’s website and then ligands were prepared with ‘LigPrep’, another Schrödinger utility. Specifically, every hydrogen atom was added and the tautomeric and ionization states were generated. Subsequently, the obtained ligands underwent minimization with the OPLS-2005 force field. Then, the pairwise Tanimoto similarity between this database and SCIC2 was calculated using the ‘Canvas Similarity and Clustering’ utility in Schrödinger’s Maestro suite.
Subsequently, the latest version of the docking software AutoDock 4.2 (AD4) [Citation63] in conjunction with the graphical user interface AutoDockTools (ADT) [Citation63] was used to perform docking calculations.
Afterwards, both the ligand and the receptor were converted to the PDBQT format. This format is very similar to a standard PDB file but includes ‘Q’ (partial charges) and ‘T’ atom types. Each atom has one line, and special keywords are used if some are required to be flexible in the docking calculations. Preparing the structures involves ensuring that its atoms are assigned the correct atom types, adding Gasteiger charges if necessary, merging non-polar hydrogens, detecting aromatic carbons, and setting up the ‘torsion tree’ in the case of ligands. Therefore, the python scripts prepare_receptor4.py and prepare_ligand4.py, part of ADT, were adopted applying the standard settings.
The docking area was centred on the enzyme active site. A set of grids of 60 Å × 60 Å × 60 Å with 0.375 Å spacing was calculated around the docking area for all the ligand atom types using AutoGrid4. For SCIC2 and SCIC2.1, 100 independent docking runs were calculated. Each docking run consisted of 10 million energy evaluations employing the Lamarckian genetic algorithm local search (GALS) method. This method creates a random population of feasible docking solutions and keeps the most successful individuals from each generation into the subsequent generation of feasible solutions. A low-frequency local search according to the method of Solis and Wets was applied to docking attempts to guarantee that the final solution represents a local minimum. All dockings were performed with a population size of 250, and 300 rounds of Solis and Wets local search were employed with a probability of 0.06. A mutation rate of 0.02 and a crossover rate of 0.8 were employed to create new docking attempts for following generations, and the best individual from each generation was propagated over the next generation. The docking results from each of the 100 calculations were clustered together on the basis of root-mean-square deviation (rmsd); (solutions differing by less than 2.0 Å) between the Cartesian coordinates of the atoms and were ranked on the basis of the calculated free energy of binding (ΔGAD4).
Cellular and human serum stability
The reaction solutions were prepared by mixing 10 µL water solution (30% DMSO for SCIC1 and SCIC2, 10% for SCIC2.1) of each compound (5 mM) and 90 µL cellular extract of HepG2 (at 0.5 mM concentration, 90% HepG2 cellular extract, 3% DMSO for SCIC 1 and SCIC2, 1% DMSO for SCIC2.1) or 90 μL human serum (at 0.5 mM concentration, 90% serum, 3% DMSO for SCIC1 and SCIC2, 1% DMSO for SCIC2.1) and incubated at 37°C. 10 μL aliquots were collected at different times (0, 15 min, 30 min, 60 min, 90 min, and 180 min), subjected to precipitation by addition of 20 µL acetonitrile/0.1% trifluoracetic acid (TFA) solution, and then centrifuged (12,000 rpm, 15 min, 4°C). The supernatant was recovered and analysed by RP-HPLC-ESI (LCMS 2020; Shimadzu) equipped with a Phenomenex Kinetex column (C18, 150 mm × 4.6 mm, 5 μm, 100 Å) with a flow rate of 1 mL/min, using a linear elution gradient from 10% to 90% acetonitrile/0.1% TFA in water in 20 min. The experiments were performed in triplicate.
Cell lines
Human hepatocellular carcinoma cells (HepG2; HB-8065) and rat cardiomyoblasts (H9c2; CRL-1446) were purchased from the American Type Culture Collection (ATCC). Cell lines were tested and authenticated following the supplier’s instructions. All cell lines were maintained in an incubator at 37°C and 5% CO2. The cells were grown in Dulbecco’s Modified Eagle’s Medium (DMEM; Euroclone) supplemented with 10% heat-inactivated foetal bovine serum (FBS; Sigma-Aldrich) and antibiotics (100 U/mL penicillin, 100 mg/mL streptomycin, 250 mg/mL amphotericin-B). HepG2 and H9c2 cells were incubated with DMSO or DOXO for 12 h. Then, cells were treated with or without SCIC2, SCIC2.1 and/or EX-527 for 3 h.
Reagents
SCIC2 and SCIC2.1 (Enamine) were used at 50 μM and 25 μM, respectively. DOXO (Adriblastina; Pfizer) was used at 0.5 μM and EX-527 (E7034; Sigma-Aldrich) at 10 μM.
Protein extraction and Western blotting
Cells were dissolved in lysis buffer containing protease inhibitors (10 mM Tris HCl pH 8.0, 150 mM NaCl, 10 mM NaF, 1% NP40, 1 mM PMSF). The proteins were then subjected to 10% sodium dodecyl sulphate-polyacrylamide gel electrophoresis (SDS-PAGE) and transferred to 0.22 μm polyvinylidene fluoride membranes. The membranes were blocked with 5% non-fat milk in Tris buffer pH 8.0/0.15% Tween 20 (TBS-T) at room temperature for 1 h and then incubated with primary antibodies diluted in TBS-T, including antibodies against p53 (Santa Cruz), p53K382ac (Abcam), SIRT1 (Abcam), p53K381ac (Abcam), and ERK (Santa Cruz), overnight at 4°C. After three washes in TBS-T, the membranes were incubated with corresponding secondary antibodies, horseradish peroxidase-conjugated anti-rabbit IgG (GE Healthcare) and horseradish peroxidase-conjugated anti-mouse IgG (GE Healthcare), for 1 h at room temperature. Immunocomplexes were visualized using Amersham EC Western Blotting Detection Reagents (GE Healthcare). The molecular weight of proteins was estimated with pre-stained protein markers (Fermentas). Densitometry analysis was performed using ImageJ software.
CETSA assay
HepG2 cells were harvested and washed with PBS after treatment with SCIC2 or SCIC2.1 and an equal amount of DMSO, as control, for 1 hour. The samples were suspended in PBS (1.5 mL), divided into aliquots (100 mL), and heated at different temperatures (4°C, 37°C, 47°C, 54°C, 57°C, and 58°C) for 3 min by Thermo Mixer (Eppendorf), followed by cooling for 3 min at 4°C. After incubation, lysis buffer (100 mL) was added to the samples and incubated for 15 min. The samples were then centrifuged at 13,000 rpm for 30 min at 4°C, the supernatant was removed, and protein concentration was determined by Bradford assay (Bio-Rad). Of the total protein extract, 30 μg was loaded onto 10% SDS-PAGE, and Western blot analysis was performed. SIRT1 (Abcam) was used as antibody. Densitometry analysis was performed using ImageJ software.
Permeability assay
Caco-2 cells (ATCC) were cultured in DMEM containing 10% FBS, 1% nonessential amino acids (Euroclone), 100 U/mL penicillin-streptomycin, and 2 mM L-glutamine. Cells were pre-incubated with culture medium for 1 h at 37°C and then 20,000 cells were resuspended in 100 µL of complete DMEM and placed in the upper chamber (0.33 cm2 per insert) on Transwell permeable inserts. Then, 600 µL of medium was added to the lower chamber of the Transwell system. The medium was changed only 24 h after seeding and then 3 times per week. Caco-2 monolayers were cultured for 21 days before use. When the monolayer was ready, cells were washed with PBS solution. Compounds SCIC2 and SCIC2.1 at 100 μg/ml, 100 μM Lucifer yellow (Sigma-Aldrich), negative control and propranolol both at 100 μg/ml were solubilized in PBS and 0.1% DMSO. Lucifer yellow is a fluorescent marker used to verify tight junction integrity during the assay. Transport assays were performed using 200 μL of apical donor solution and 600 μL of basolateral PBS acceptor solution. All compounds were tested in three replicate monolayers. Monolayers were incubated with all compounds at room temperature, shaking for 2 h. Concentration of Lucifer yellow was evaluated by Infinite M200 (TECAN) at 480/530 nm.
The other compound concentrations were evaluated by HPLC. Fluorescence was determined without any fluorescence interference. The permeability coefficient (Pa) of the compound after 2 h of incubation was calculated by the following equation:
where ‘Vd’ and ‘Vr’ are the donor (0.2 cm3) and acceptor (0.6 cm3) volume, respectively. ‘A’ is the area of membrane (0.33 cm2), ‘t’ is the time of compound incubation, expressed in sec, and ‘r’ is the ratio between the compound area in donor chamber and the compound area at equilibrium. The permeability percentage (P%) of molecules was calculated as:
Experiments were performed in triplicate.
Cell cycle
For cell cycle analyses, cells were plated (2 × 10⁵ cells/mL) and after stimulation were harvested, centrifuged at 1200 rpm for 5 min and resuspended in 500 μL of a hypotonic solution containing 1X PBS, 0.1% sodium citrate, 0.1% NP-40, and 50 mg/mL propidium iodide (PI). After 30 min at room temperature in the dark, samples were acquired by FACS-Calibur (BD Biosciences) using Cell Quest Pro software (BD Biosciences). The percentage in different phases of the cell cycle was determined by ModFit LT v3 software (Verity). Cell death was measured as a percentage of cells in pre-G1 phase. All experiments were performed in triplicate.
Senescence assay
Senescence was assessed by β-gal staining. HepG2 and H9c2 cells were incubated with DOXO for 48 h and single compounds were administered every 24 h. β-gal senescence assay was performed using Senescence Cells Histochemical Staining Kit (CS0030; Sigma) according to the manufacturer’s instructions. Staining was visualized and captured using an optical microscope (Carl Zeiss).
Statistical analysis
Data are presented as the mean ± SD of biological triplicates. Differences between the treatment groups and controls were compared using one-way analysis of variance (ANOVA) and Dunnett’s multiple-comparison test. Differences between groups were considered significant at a p value ≤ 0.05. Statistical analyses were performed using GraphPad Prism 6.0 software (GraphPad Software).
Availability of data and materials
All original data are available from the authors upon request.
Authors’ contributions
LA and AN: conception of the work. LS, FS, VC: experimental study, data analysis, and interpretation. SC and SDM: molecular modeling and human serum stability studies. LC and AdA: H9c2 cell studies. GS and AF: SPR and stability experiments. LA, AN and LS: writing of the manuscript. All authors read and approved the final manuscript.
Consent for publication
No parts of this manuscript are being considered for publication elsewhere.
Acknowledgments
The authors thank Alfonso Ciotta for help with compound screening and Catherine Fisher for language editing.
Disclosure statement
No potential conflict of interest was reported by the authors.
Additional information
Funding
References
- Imai S, Armstrong CM, Kaeberlein M, et al. Transcriptional silencing and longevity protein SIR2 is an NAD-dependent histone deacetylase. Nature. 2000 Feb 17;403(6771):795–800.
- Klar AJ, Fogel S, Radin DN. Switching of a mating-type a mutant allele in budding yeast Saccharomyces cerevisiae. Genetics. 1979 Jul;92(3):759–776.
- Ivy JM, Klar AJ, Hicks JB. Cloning and characterization of four SIR genes of Saccharomyces cerevisiae. Mol Cell Biol. 1986 Feb;6(2):688–702.
- Rine J, Herskowitz I. Four genes responsible for a position effect on expression from HML and HMR in Saccharomyces cerevisiae. Genetics. 1987 May;116(1):9–22.
- Brachmann CB, Sherman JM, Devine SE, et al. The SIR2 gene family, conserved from bacteria to humans, functions in silencing, cell cycle progression, and chromosome stability. Genes Dev. 1995 Dec 1;9(23):2888–2902.
- Derbyshire MK, Weinstock KG, Strathern JN. HST1, a new member of the SIR2 family of genes. Yeast. 1996 Jun 15;12(7):631–640.
- Grabowska W, Sikora E, Bielak-Zmijewska A. Sirtuins, a promising target in slowing down the ageing process. Biogerontology. 2017 Aug;18(4):447–476.
- Michan S, Sinclair D. Sirtuins in mammals: insights into their biological function. Biochem J. 2007 May 15;404(1):1–13.
- Sauve AA. Sirtuins. Biochim Biophys Acta. 2010 Aug;1804(8):1565–1566.
- Kupis W, Palyga J, Tomal E, et al. The role of sirtuins in cellular homeostasis. J Physiol Biochem. 2016 Sep;72(3):371–380.
- Cohen HY, Miller C, Bitterman KJ, et al. Calorie restriction promotes mammalian cell survival by inducing the SIRT1 deacetylase. Science. 2004 Jul 16;305(5682):390–392.
- Bonkowski MS, Sinclair DA. Slowing ageing by design: the rise of NAD(+) and sirtuin-activating compounds. Nat Rev Mol Cell Biol. 2016 Nov;17(11):679–690.
- Wang Y, He J, Liao M, et al. An overview of sirtuins as potential therapeutic target: structure, function and modulators. Eur J Med Chem. 2019 Jan 1;161:48–77.
- Dai H, Sinclair DA, Ellis JL, et al. Sirtuin activators and inhibitors: promises, achievements, and challenges. Pharmacol Ther. 2018;188:140–154.
- Morris BJ. Seven sirtuins for seven deadly diseases of aging. Free Radic Biol Med. 2013 Mar;56:133–171.
- Bordone L, Cohen D, Robinson A, et al. SIRT1 transgenic mice show phenotypes resembling calorie restriction. Aging Cell. 2007 Dec;6(6):759–767.
- Hubbard BP, Sinclair DA. Small molecule SIRT1 activators for the treatment of aging and age-related diseases. Trends Pharmacol Sci. 2014 Mar;35(3):146–154.
- Schiedel M, Robaa D, Rumpf T, et al. The current state of NAD(+) -dependent histone deacetylases (Sirtuins) as novel therapeutic targets. Med Res Rev. 2018 Jan;38(1):147–200.
- Baur JA, Sinclair DA. Therapeutic potential of resveratrol: the in vivo evidence. Nat Rev Drug Discov. 2006 Jun;5(6):493–506.
- Rascon B, Hubbard BP, Sinclair DA, et al. The lifespan extension effects of resveratrol are conserved in the honey bee and may be driven by a mechanism related to caloric restriction. Aging (Albany NY). 2012 Jul;4(7):499–508.
- Berman AY, Motechin RA, Wiesenfeld MY, et al. The therapeutic potential of resveratrol: a review of clinical trials. NPJ Precis Oncol. 2017;1:1–9.
- Borra MT, Smith BC, Denu JM. Mechanism of human SIRT1 activation by resveratrol. J Biol Chem. 2005 Apr 29;280(17):17187–17195.
- Dyck GJB, Raj P, Zieroth S, et al. The effects of resveratrol in patients with cardiovascular disease and heart failure: a narrative review. Int J Mol Sci. 2019 Feb 19;20(4):904.
- Lagouge M, Argmann C, Gerhart-Hines Z, et al. Resveratrol improves mitochondrial function and protects against metabolic disease by activating SIRT1 and PGC-1alpha. Cell. 2006 Dec 15;127(6):1109–1122.
- Carafa V, Rotili D, Forgione M, et al. Sirtuin functions and modulation: from chemistry to the clinic. Clin Epigenetics. 2016;8:61.
- Valente S, Mellini P, Spallotta F, et al. 1,4-dihydropyridines active on the SIRT1/AMPK pathway ameliorate skin repair and mitochondrial function and exhibit inhibition of proliferation in cancer cells. J Med Chem. 2016 Feb 25;59(4):1471–1491.
- Hubbard BP, Gomes AP, Dai H, et al. Evidence for a common mechanism of SIRT1 regulation by allosteric activators. Science. 2013 Mar 8;339(6124):1216–1219.
- Sinclair DA, Guarente L. Small-molecule allosteric activators of sirtuins. Annu Rev Pharmacol Toxicol. 2014;54:363–380.
- Vu CB, Bemis JE, Disch JS, et al. Discovery of imidazo[1,2-b]thiazole derivatives as novel SIRT1 activators. J Med Chem. 2009 Mar 12;52(5):1275–1283.
- Pacholec M, Bleasdale JE, Chrunyk B, et al. SRT1720, SRT2183, SRT1460, and resveratrol are not direct activators of SIRT1. J Biol Chem. 2010 Mar 12;285(11):8340–8351.
- Ren Y, Du C, Shi Y, et al. The SIRT1 activator, SRT1720, attenuates renal fibrosis by inhibiting CTGF and oxidative stress. Int J Mol Med. 2017 May;39(5):1317–1324.
- Bemis JE, Vu CB, Xie R, et al. Discovery of oxazolo[4,5-b]pyridines and related heterocyclic analogs as novel SIRT1 activators. Bioorg Med Chem Lett. 2009 Apr 15;19(8):2350–2353.
- van der Meer AJ, Scicluna BP, Moerland PD, et al. The selective sirtuin 1 activator SRT2104 reduces endotoxin-induced cytokine release and coagulation activation in humans. Crit Care Med. 2015 Jun;43(6):e199–202.
- Jiao D, Zhang H, Jiang Z, et al. MicroRNA-34a targets sirtuin 1 and leads to diabetes-induced testicular apoptotic cell death. J Mol Med. 2018 Sep;96(9):939–949.
- Wu H, Wu J, Zhou S, et al. SRT2104 attenuates diabetes-induced aortic endothelial dysfunction via inhibition of P53. J Endocrinol. 2018 Apr;237(1):1–14.
- Nayagam VM, Wang X, Tan YC, et al. SIRT1 modulating compounds from high-throughput screening as anti-inflammatory and insulin-sensitizing agents. J Biomol Screen. 2006 Dec;11(8):959–967.
- Hoffmann E, Wald J, Lavu S, et al. Pharmacokinetics and tolerability of SRT2104, a first-in-class small molecule activator of SIRT1, after single and repeated oral administration in man. Br J Clin Pharmacol. 2013 Jan;75(1):186–196.
- Ma F, Wu J, Jiang Z, et al. P53/NRF2 mediates SIRT1’s protective effect on diabetic nephropathy. Biochim Biophys Acta Mol Cell Res. 2019 Aug;1866(8):1272–1281.
- Napper AD, Hixon J, McDonagh T, et al. Discovery of indoles as potent and selective inhibitors of the deacetylase SIRT1. J Med Chem. 2005 Dec 15;48(25):8045–8054.
- Smith MR, Syed A, Lukacsovich T, et al. A potent and selective sirtuin 1 inhibitor alleviates pathology in multiple animal and cell models of Huntington’s disease. Hum Mol Genet. 2014 Jun 1;23(11):2995–3007.
- Sussmuth SD, Haider S, Landwehrmeyer GB, et al. An exploratory double-blind, randomized clinical trial with selisistat, a SIRT1 inhibitor, in patients with Huntington’s disease. Br J Clin Pharmacol. 2015 Mar;79(3):465–476.
- Zhou Z, Ma T, Zhu Q, et al. Recent advances in inhibitors of sirtuin1/2: an update and perspective. Future Med Chem. 2018 Apr 1;10(8):907–934.
- Nunez S, Venhorst J, Kruse CG. Target-drug interactions: first principles and their application to drug discovery. Drug Discov Today. 2012 Jan;17(1–2):10–22.
- Zhao X, Allison D, Condon B, et al. The 2.5 A crystal structure of the SIRT1 catalytic domain bound to nicotinamide adenine dinucleotide (NAD+) and an indole (EX527 analogue) reveals a novel mechanism of histone deacetylase inhibition. J Med Chem. 2013 Feb 14;56(3):963–969.
- Dai H, Case AW, Riera TV, et al. Crystallographic structure of a small molecule SIRT1 activator-enzyme complex. Nat Commun. 2015 Jul 2;6:7645.
- Cao D, Wang M, Qiu X, et al. Structural basis for allosteric, substrate-dependent stimulation of SIRT1 activity by resveratrol. Genes Dev. 2015 Jun 15;29(12):1316–1325.
- Borges F, Roleira F, Milhazes N, et al. Simple coumarins and analogues in medicinal chemistry: occurrence, synthesis and biological activity. Curr Med Chem. 2005;12(8):887–916.
- Bajusz D, Racz A, Heberger K. Why is Tanimoto index an appropriate choice for fingerprint-based similarity calculations? J Cheminform. 2015;7:20.
- Hidalgo IJ, Raub TJ, Borchardt RT. Characterization of the human colon carcinoma cell line (Caco-2) as a model system for intestinal epithelial permeability. Gastroenterology. 1989 Mar;96(3):736–749.
- Artursson P. Epithelial transport of drugs in cell culture. I: a model for studying the passive diffusion of drugs over intestinal absorptive (Caco-2) cells. J Pharm Sci. 1990 Jun;79(6):476–482.
- Mansfeld FM, Synthesis IT. Plasma stability of disulfide-bridged cyclic endomorphin-1 derivatives. Int J Org Chem. 2012 Mar;2(1):1–6.
- Ghosh S, Zhou Z. SIRTain regulators of premature senescence and accelerated aging. Protein Cell. 2015 May;6(5):322–333.
- Kaeberlein M, McVey M, Guarente L. The SIR2/3/4 complex and SIR2 alone promote longevity in Saccharomyces cerevisiae by two different mechanisms. Genes Dev. 1999 Oct 1;13(19):2570–2580.
- Rogina B, Helfand SL. SIR2 mediates longevity in the fly through a pathway related to calorie restriction. Proc Natl Acad Sci USA. 2004 Nov 9;101(45):15998–16003.
- Kumar A, Chauhan S. How much successful are the medicinal chemists in modulation of SIRT1: a critical review. Eur J Med Chem. 2016 Aug 25;119:45–69.
- McBurney MW, Clark-Knowles KV, Caron AZ, et al. SIRT1 is a highly networked protein that mediates the adaptation to chronic physiological stress. Genes Cancer. 2013 Mar;4(3–4):125–134.
- Luo J, Nikolaev AY, Imai S, et al. Negative control of p53 by SIR2alpha promotes cell survival under stress. Cell. 2001 Oct 19;107(2):137–148.
- Wang RH, Sengupta K, Li C, et al. Impaired DNA damage response, genome instability, and tumorigenesis in SIRT1 mutant mice. Cancer Cell. 2008 Oct 7;14(4):312–323.
- Gan L, Mucke L. Paths of convergence: sirtuins in aging and neurodegeneration. Neuron. 2008 Apr 10;58(1):10–14.
- Potente M, Ghaeni L, Baldessari D, et al. SIRT1 controls endothelial angiogenic functions during vascular growth. Genes Dev. 2007 Oct 15;21(20):2644–2658.
- Chang HC, Guarente L. SIRT1 and other sirtuins in metabolism. Trends Endocrinol Metab. 2014 Mar;25(3):138–145.
- Milite C, Feoli A, Horton JR, et al. Discovery of a novel chemotype of histone lysine methyltransferase EHMT1/2 (GLP/G9a) inhibitors: rational design, synthesis, biological evaluation, and co-crystal structure. J Med Chem. 2019 Mar 14;62(5):2666–2689.
- Morris GM, Huey R, Lindstrom W, et al. AutoDock4 and AutoDockTools4: automated docking with selective receptor flexibility. J Comput Chem. 2009 Dec;30(16):2785–2791.