
ABSTRACT
The aim of our study was to explore the relationship between the methylation status of the alpha-1A adrenergic receptor (ADRA1A) gene and hepatocellular carcinoma (HCC). We combined our in-house data-set with the Cancer Genome Atlas (TCGA) data-set to screen and identify the methylation status and expression of adrenergic receptor (AR) genes in HCC. Immunohistochemistry and western blot were performed to assess the expression of ADRA1A in HCC cell lines and tissues. We further evaluated the methylation levels of the ADRA1A promoter region in 160 HCC patients using the Sequenom MassARRAY® platform and investigated the association between methylation of ADRA1A and clinical characteristics. The expression levels of ADRA1A mRNA and protein were significantly decreased in HCC tissues. Compared with that in paired normal tissues, the mean methylation level of the ADRA1A promoter region was significantly increased in tumour tissues from 160 HCC patients (25.2% vs. 17.0%, P < 0.0001). We found that a DNA methyltransferase inhibitor (decitabine) could increase the expression of ADRA1A mRNA in HCC cell lines. Moreover, hypermethylation of the ADRA1A gene in HCC samples was associated with clinical characteristics, including alcohol intake (P = 0.0097) and alpha-fetoprotein (P = 0.0411). Receiver operator characteristic (ROC) curve analysis demonstrated that the mean methylation levels of ADRA1A could discriminate between HCC tissues and adjacent non-cancerous tissues (AUC = 0.700, P < 0.0001). mRNA sequencing indicated that the main enriched pathways were pathways in cancer, cytokine-cytokine receptor interaction and metabolic pathways (P < 0.01). ADRA1A gene hypermethylation might contribute to HCC initiation and is a promising biomarker for the diagnosis of HCC.
Introduction
Liver cancer was the sixth most commonly diagnosed cancer and the fourth leading cause of cancer deaths worldwide in 2018 [Citation1]. Hepatocellular carcinoma (HCC), the most common type of primary liver cancer, accounts for 75–85% of liver cancers. Moreover, the incidence of HCC is increasing in the United States and other countries, especially in eastern Asia [Citation2]. Therefore, it is imperative to perform more research to find an effective biomarker for HCC.
Adrenergic receptors (ARs) are a class of G protein-coupled receptors that stimulate the sympathetic nervous system (SNS) by binding catecholamines [Citation3]. There are two main classes of adrenoreceptors, alpha adrenoreceptors (ADRA1A, ADRA1B, ADRA1D, ADRA2A, ADRA2B, and ADRA2C) and beta adrenoreceptors (ADRB1, ADRB2, and ADRB3). The activation of ARs can induce glycogenolysis and gluconeogenesis in the liver. Additionally, the SNS is known to modulate liver regeneration, hepatic fibrogenesis, and liver injury [Citation4]. Under normal physiology, there are two main ARs, namely alpha-1 and beta-2 receptors in the liver. Sympathetic denervation or blocking of alpha1-ARs was shown to decrease the incidence of diethylnitrosamine-induced HCC and tumour development [Citation5]. Of note, ADRA1A (alpha-1A adrenergic receptor), also known as ADRA1C, is one alpha-1 adrenergic receptor subtype whose ligands are catecholamines [Citation6]. The ADRA1A receptor belongs to the Gq/11 family of G-proteins. Numerous physiological and pathological events in the innervated liver are regulated by the autonomic nervous system [Citation7]. However, whether and how ADRA1A plays a role in HCC remain obscure.
Epigenetics plays critical roles in regulating tumorigenesis, metastasis, and therapeutic responses [Citation8]. As an essential modification in epigenetics, DNA methylation, which is a direct chemical modification of DNA primarily at CpG dinucleotide sites, is believed to involve mostly the hypermethylation of tumour suppressor genes and hypomethylation of oncogenes in cancer [Citation9,Citation10]. DNA methylation changes are common in human cancers, but whether ARs are regulated by DNA methylation has not been explored in detail.
Here, by analysing an in-house RNA-seq data-set [Citation11] and an RNA-seq data-set from the Cancer Genome Atlas (TCGA), we show that the expression levels of ADRA1A in patient tumour tissues were significantly decreased. Then, we confirm that expression of the ADRA1A gene was significantly decreased in 20 paired HCC samples and HCC cell lines. Moreover, we utilized the Sequenom MassARRAY® platform to verify the methylation changes in the ADRA1A gene in 160 HCC patients and further analysed the relationship between theses ADRA1A methylation patterns and clinicopathological features.
Results
Patient characteristics
The clinical characteristics of 160 HCC patients are summarized in . The median age of the patients at diagnosis was 55 years. There were 55 patients who consumed alcohol habitually (≥50 mg/day), and 53 patients were alpha-fetoprotein (AFP) positive. Regarding clinicopathological characteristics, 15 patients had multiple tumours. Tumour thrombus was detected in 29 patients. According to TNM staging, there were 121 patients classified as stage I-II in our study.
Table 1. Patients characteristics.
ADRA1A gene is the only one that regulated by DNA methylation among the nine ARs in HCC
As depicted by the flow chart (), we screened and identified ADRA1A as the only gene among all nine ARs regulated by DNA methylation. First, to investigate the expression of ARs in HCC tissues, we analysed the data from our in-house RNA-seq data-set that included 11 HCC patients [Citation11] and the TCGA data-set. The expression levels of four types of ARs (ADRA1A, ADRA1B, ADRA2B, and ADRB2) in HCC tissues were significantly lower than those in adjacent non-cancerous tissues (ANT) in both data-sets (P < 0.05, ). The expression of ADRA1A in ANT was thirteen times higher than that in HCC tissues in our in-house data-set (normal vs. HCC tissues: 13.34 vs. 1.01 fragments per kilobase million (FPKM), P < 0.0001) (Supplementary Table 1) and approximately two times higher in the TCGA data-set (normal vs. HCC tissues: 9.38 vs. 4.98 FPKM, P < 0.0001) (Supplementary Table 1).
Figure 1. The flow diagram of ARs screening.
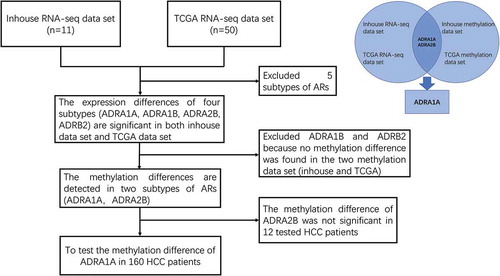
Figure 2. The expression and methylation levels of adrenoreceptors (ARs) in HCC from inhouse and TCGA data-set. (a) The expression levels of ARs from our inhouse data-set. (b) The expression levels of ARs from TCGA data-set. (c) The methylation levels of ADRA1A from inhouse data-set. (d) The methylation levels of ADRA1A from TCGA data-set. (e) The methylation levels of ADRA2B from inhouse data-set. (f) The methylation levels of ADRA2B from TCGA data-set. FPKM: fragments per kilobase million; *P < 0.05, **P < 0.001, ***P < 0.0001, NS: not significant.
Moreover, in terms of the methylation levels of the four receptors, we overlapped the inhouse and TCGA methylation data-sets and observed that the methylation differences (ANT vs. HCC) in ADRA1A and ADRA2B were significant (), whereas those in ADRA1B and ADRB2 were not (Supplementary Figure 1). In addition, we found that the methylation levels of all seven sites (cg09557462, cg02409177, cg21230493, cg07645844, cg17963840, cg23008606, and cg20303399) in the promoter region of ADRA1A were significantly higher in HCC tissues than in ANT in both data-sets (P < 0.05, ). Finally, we verified that the ADRA1A methylation difference between HCC tissues and ANT was significant in 12 HCC patients using the Sequenom MassARRAY® platform, but we failed to observe a difference in ADRA2B (Supplementary Figure 2). Meanwhile, we also identified the methylation level of ADRA1A in melanoma and colon cancer by analysing the data from TCGA date set, but we failed to detect significant difference (Supplementary Figure 3). Therefore, we speculated that the methylation alteration of ADRA1A was specific in HCC.
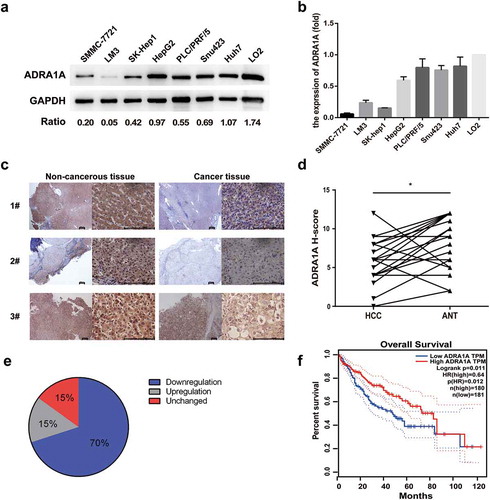
Figure 3. The expression levels of ADRA1A in HCC cell lines and tissues. (a) The expression levels of ADRA1A protein in HCC and LO2 cell lines; Ratio refers to the result of the grey values ADRA1A bands and GAPDH bands. (b) The mRNA expression levels of ADRA1A in HCC and LO2 cell lines. (c) The representative immunohistochemical results of ADRA1A in HCC tissue and paired non-cancerous tissue. Scale bars = 200μm. (d) The score of immunohistochemical results in all 20 paired HCC samples. (e) The proportion of ADRA1A expression regulation in all 20 paired HCC samples. (f) The overall survival (OS) data of ADRA1A from the Gene Expression Profiling Interactive Analysis website (http://gepia.cancer-pku.cn), a network analysing TCGA data online. *P < 0.05.
Expression levels of ADRA1A are significantly decreased in HCC cell lines and tissues
Considering the mRNA expression data of the two RNA-seq data-sets, we further investigated the expression levels of ADRA1A protein in eight selected cell lines including seven HCC cell lines and one normal hepatic cell line (LO2). The western blot results show that ADRA1A was expressed at low levels in all seven HCC cell lines, but it was highly expressed in LO2 (). Likewise, the mRNA expression levels of ADRA1A in the seven HCC cell lines were lower than that in LO2, as assessed by RT-qPCR ().
With respect to HCC tissues, ADRA1A immunohistochemistry of 20 paired HCC samples was performed to discriminate expression differences. Similar to that found with cultured cells, the expression of ADRA1A was lower in the cancer tissues than in the paired non-cancer tissues (). The German immunoreacted score [Citation12] in HCC tissues was significantly lower than that in ANT (P = 0.0099, )). Of the 20 paired HCC samples, downregulation of ADRA1A expression occurred in 70% of the HCC tissues and upregulation occurred in 15% of them ()).
Moreover, we used the Gene Expression Profiling Interactive Analysis (GEPIA) website to analyse the correlation between the expression of ADRA1A and the overall survival rate. We found that high expression of ADRA1A predicted a significantly better overall survival outcome in the patients (hazard ratio (HR) = 0.64, P = 0.012) ()).
Identification of a candidate CpG island with high transcriptional activity
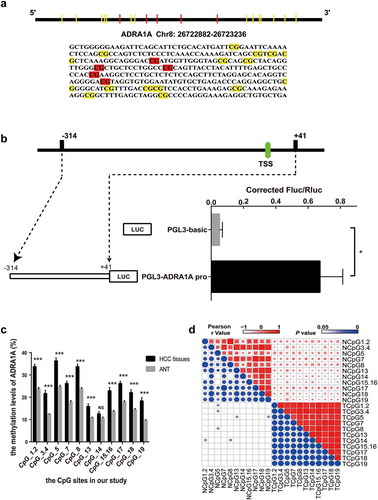
To verify the altered methylation of ADRA1A, we first identified a 355 bp sequence as our candidate amplicon using the CpG Island Finder component of DBCAT software ()). This amplicon contained the transcription start site (TSS) and was located on chr8:26722882–26723236. To confirm the transcriptional activity of the selected amplicon, we ligated this DNA fragment into the vector pGL3-Basic. Intriguingly, the luciferase expression from the resulting plasmid (pGL3-ADRA1A-pro) was significantly higher than that from the parent vector (pGL3-Basic) in transfected 293T cells (P = 0.0374, )).
Figure 4. The identification of transcriptional activity and correlation of CpG sites in ADRA1A promoter. (a) The schematic diagram and sequence of CpG sites of ADRA1A promoter amplicon. (b) The verification of transcriptional activity in selected amplicon via luciferase assay. (c) The methylation levels of all CpG sites in ADRA1A promoter region from our study. (d) Heatmap of correlation analysis between the methylation levels of different CpG sites in ADRA1A. Upper-right triangle: Heat map of Pearson r values. Lower-left triangle: Heat map of P values. *P < 0.05, ***P < 0.0001, NS: not significant.
Hypermethylated ADRA1A promoter occurs in HCC tissues
Nineteen CpG sites were included in our candidate amplicon, and fourteen of these (CpG1.2, CpG3.4, CpG5, CpG7, CpG8, CpG13, CpG14, CpG15.16, CpG17, CpG18, and CpG19) were eventually genotyped successfully ()). CpG1 and CpG2 were genotyped together as CpG1.2 because they were very close to each other. For the same reason, CpG3.4 and CpG15.16 were also genotyped together.
Hypermethylation of ADRA1A was detected in HCC tissues in all of the CpG sites, except CpG14 ()). The mean methylation level of ADRA1A in HCC tissues was 25.2%, which was significantly higher than that in ANT (17.0%, , P < 0.001). The methylation differences in ADRA1A between HCC tissues and their paired normal tissues ranged from −1.9% to −11.3%. Furthermore, we found that the methylation levels of all CpG sites, except CpG14, in hepatitis B virus (HBV)-related HCC tissues were significantly increased over the corresponding methylation levels in ANT (). Correlation analysis indicated that the methylation levels at different CpG sites were significantly correlated with each other ()).
Table 2. Methylation status (%) of ADRA1A in hepatocellular carcinoma patients.
Expression of ADRA1A is downregulated by promoter hypermethylation
Based on the expression and methylation results, we speculated that the low expression of ADRA1A in HCC tissues was mainly attributed to the hypermethylation status of its promoter. Therefore, a correlation analysis was performed to explore further the correlation between the methylation status and expression levels of ADRA1A. In our inhouse data-set, the expression levels of ADRA1A were negatively correlated with the methylation levels of ADRA1A at all seven CpG sites, which were close to our amplicon (Supplementary Table 2). The Pearson r value of ADRA1A in cg09557462 and cg02409177 was −0.60 (P = 0.0033) and −0.57 (P = 0.0058), respectively (). In the 231 HCC samples from the TCGA data-set, we found that the expression levels and methylation levels showed significant negative correlations at the seven CpG sites (Supplementary Table 2). The Pearson r value of ADRA1A in cg20303399 and cg07645844 was −0.44 (P < 0.0001) and −0.52 (P < 0.0001), respectively ().
Figure 5. The correlation between methylation status and expression levels of ADRA1A from inhouse and TCGA data-set and the expression levels of ADRA1A for DAC treatment. (a) The correlation between the methylation of cg09557462 and ADRA1A gene expression from inhouse data-set. (b) The correlation between the methylation of cg02409177 and ADRA1A gene expression from inhouse data-set. (c) The correlation between the methylation of cg20303399 and ADRA1A gene expression from the TCGA data-set. (d) The correlation between the methylation of cg07645844 and ADRA1A gene expression from the TCGA data-set. (e) The mRNA expression levels of ADRA1A in LM3 and SMMC-7721 cell lines with different DAC concentration treatment. (f) Gel image of ADRA1A promoter Methylation specific PCR (MSP). M: methylated; U: unmethylated.
To functionally evaluate the correlation between the methylation and expression levels of ADRA1A, HCC cell lines (LM3 and SMMC-7721) were treated with 5-aza-2′-deoxycytidine (decitabine, DAC). The expression levels of ADRA1A increased in both cell lines after DAC treatment, with the expression levels of ADRA1A increasing with increasing concentrations of DAC ()). Moreover, methylation specific PCR (MSP) were performed to detect the methylation changes of HCC cell lines with DAC (10 µM) or DMSO treatment in ADRA1A promoter. We could not detect the methylated bands in both SMMC-7721 and LM3 cell lines after DAC treatment ()).
Correlation between methylation levels of the ADRA1A gene and clinical characteristics of HCC patients
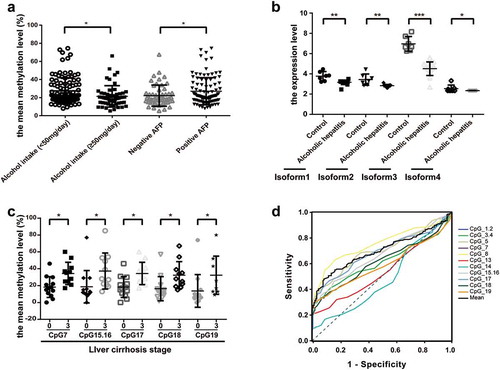
To determine the role of ADRA1A as a potential biomarker of HCC, we further evaluated the correlation between its methylation levels and multiple clinical characteristics of HCC patients. Among all clinicopathological parameters in HCC, we found that CpG1.2, CpG3.4, CpG7, CpG8, CpG13, CpG15.16, CpG17, and the mean methylation levels of the ADRA1A promoter were significantly associated with alcohol intake (Supplementary Table 3). Moreover, the mean methylation level of ADRA1A in HCC patients with high alcohol intake (≥50 mg/day) was 21.37% and significantly lower than that in HCC patients with low alcohol intake (27.38%, <50 mg/day) (P = 0.0061, )), but we failed to observe the difference in ANT (Supplementary Figure 4(a)). In addition, the methylation levels of seven CpG sites (CpG3.4, CpG7, CpG13, CpG17, CpG18, and CpG19) and the mean methylation levels of ADRA1A were significantly correlated with serum AFP (Supplementary Table 3). The mean methylation level of ADRA1A in AFP-positive HCC patients was 27.02%, which was significantly higher than the mean methylation in AFP-negative HCC patients (22.15%, P = 0.0280, )). To further verify the potential association between alcohol consumption and ADRA1A expression, we downloaded the RNA-seq data of alcoholic hepatitis and normal liver tissues from the Gene Expression Omnibus (GEO) database. Intriguingly, we found that the expression of different isoforms of ADRA1A in alcoholic hepatitis tissues were all significantly lower than those in normal liver tissues and isoform 3 expression was most significant ()). Interestingly, isoform 3 had the highest expression in the four isoforms (Supplementary Figure 4(b)). In addition, we found that the methylation levels at six CpG sites (CpG7, CpG15.16, CpG17, CpG18, and CpG19) in HCC patients with stage 3 liver cirrhosis were significantly higher than those without liver cirrhosis (), Supplementary Table 3), but we did not detect the significant difference among the different TNM stage patients (Supplementary Figure 4(c)).
Figure 6. The association between the methylation levels of ADRA1A and clinicopathological features. (a) The association between the mean methylation levels of ADRA1A and alcohol intake or AFP. (b) The expression difference of four isoforms of ADRA1A between normal and alcohol hepatitis patients. (c) The association between the methylation levels of CpG sites and liver cirrhosis stage. (d) The ROC curves of methylation levels in 14 CpG sites of ADRA1A promoter between HCC tissues and ANT. *P < 0.05, **P < 0.001, ***P < 0.0001.
Receiver operator characteristic (ROC) curve analysis of methylation levels in HCC tissues and ANT
To further evaluate whether the methylation status of ADRA1A could be a useful biomarker in HCC, we calculated the area under the curve (AUC) of ROC curves. Among the 15 CpG sites, we found that the mean methylation level of the ADRA1A promoter could discriminate HCC tissues from normal tissues (AUC = 0.70, P < 0.0001, )). The most powerful site to discriminate HCC tissues from normal tissues was CpG1.2 (AUC = 0.75, P < 0.0001). However, there was no significant discrimination with CpG13 (AUC = 0.54, P = 0.2173) and CpG14 (AUC = 0.48, P = 0.5875) from the ADRA1A promoter (), Supplementary Table 4). Moreover, we also conducted different subgroup analyses. The mean AUC area in the analysis of AFP negative and positive subgroup was 0.65 (P = 0.0084) and 0.73 (P < 0.0001), respectively (Supplementary Figure 5(a-b), Supplementary Table 4). Additionally, the mean AUC area in the analysis of alcohol intake negative was 0.76 (P < 0.0001), but in positive subgroup, the mean AUC area was 0.59 (P = 0.1103). The most powerful site to discriminate HCC tissues in alcohol intake negative subgroup was CpG1.2 (AUC = 0.82, P < 0.0001) (Supplementary Figure 5(c-d), Supplementary Table 4).
ADRA1A knockdown in HCC cell lines might be involved in tumorigenesis via regulating cytokine-cytokine receptor interaction and metabolic pathways in cancer
To identify the effect of ADRA1A in HCC, we knocked down ADRA1A in PLC/PRF/5 and Huh7 cell lines ()). In MTS assays, we did not observe the difference between shADRA1A group and shCtrl group in cell proliferation for Huh7 or PLC/PRF/5 cell lines ()). For a more comprehensive analysis of ADAR1A in HCC, mRNA sequencing for PLC/PRF/5-shADRA1A and PLC/PRF/5-shCtrl cell lines were conducted. The top 20 enrichment of signalling pathway were presented in . The most interesting enriched pathways were pathways in cancer, cytokine-cytokine receptor interaction and metabolic pathways, including retinol metabolism, drug metabolism-cytochrome P450, ascorbate and aldarate metabolism and metabolism of xenobiotics by cytochrome P450.
Figure 7. Differential gene expression between ADRA1A knockdown group and control group in HCC cell lines by RNA-sequencing. (a) Representative western blot of ADRA1A in PLC/PRF/5 and LM3; Ratio refers to the result of the grey values ADRA1A bands and GAPDH bands. (b) Detection of cell proliferation for shADRA1A and shCtrl in two HCC cell lines. (c) Top 20 signalling pathways obtained by RNA-sequencing between PLC/PRF/5-shADRA1A and PLC/PRF/5-shCtrl (n = 3). (d, e, f) Heat map of differentially expressed genes for pathways in caner (d), cytokine-cytokine receptor interaction pathway (e) and drug metabolism-cytochrome P450 pathway (f).
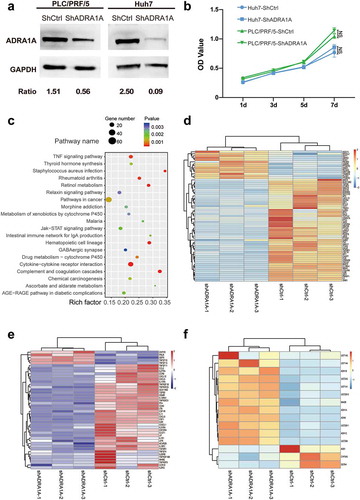
As for pathways in cancer, most of genes (78.46%) were down-regulated after knocking down ADRA1A. Interestingly, parts of genes were identified tumour suppressor genes in HCC, such as APC, Notch3. Additionally, some oncogenes for HCC were up-regulated, such as NFE2L2 ()). In cytokine-cytokine receptor interaction, these genes (n = 44) in the pathways globally presented down-regulation and most of them were tumour necrosis factor (TNF), interleukin (IL) and interleukin receptor (ILR) (), Supplementary Figure 6(a-c)). We also proceeded to the data (the correlated genes which their Spearman R values are >0.55) from cBioPortal (http://www.cbioportal.org/) and conducted the Kyoto Encyclopaedia of Genes and Genomes (KEGG) pathway and Gene Ontology (GO) analysis. Similarly, the result from mRNA sequencing was also enriched in metabolic pathways (Supplementary Figure 7(a-b)). As for drug metabolism-cytochrome P450 pathway, the expression levels of most genes were up-regulated in ADRA1A knock-down cell line ()), it suggested that silencing ADRA1A might help to establish the metabolic patterns which is suitable for cancer cells.
Discussion
Extensive perturbations of DNA methylation have been noted in cancer, causing changes in gene regulation that promote oncogenesis, and CpG methylation is an epigenetic regulator of gene expression that usually results in gene silencing [Citation13,Citation14]. According to previous studies, promoters are typically hypermethylated in liver cancer, which is inversely correlated with gene expression [Citation15]. Our study showed the methylation status of an ADRA1A gene promoter region in 160 paired HCC samples. The expression level of ADRA1A was significantly decreased in HCC, and hypermethylation of the ADRA1A promoter region was detected in HCC tissues from both inhouse and TCGA data-sets. Furthermore, the expression of ADRA1A was verified to be downregulated by hypermethylation of its promoter. Finally, we found that the methylation status of the ADRA1A promoter was significantly associated with alcohol intake, AFP, and liver cirrhosis.
ARs play an important role in regulating human tissue homoeostasis and are associated with many diseases [Citation16,Citation17]. Sympathetic nervous system regulation of cancer cell biology has clarified the molecular basis of the long-suspected relationship between stress and cancer progression [Citation18]. ADRA1A, as a subtype of the alpha ARs, is activated by catecholamines from local sympathetic nerve fibres and circulating blood. Lower α1-AR expression in breast cancer feed arteries was detected in a previous study, and this lowered receptor expression could increase tumour perfusion and provide more nutrients for the cancer cells by decreasing feed artery constriction [Citation19]. ADRA1A is the predominant subtype of α1-AR in the normal liver [Citation20]. In a previous study, the membrane density of α1-ARs was found to be lower in HCC than in non-carcinoma livers, without obvious alteration in receptor affinity [Citation21]. Corroborating those data, we also found that the expression of the ADRA1A gene was lower in HCC tissues than in ANT. Thus, we speculate that a similar mechanism which affect the arterial constriction might also be involved in HCC progression.
Adrenergic signalling is an important regulator of liver repair, innate immunity, and fibrosis [Citation18,Citation22]. The stress of psychosocial factors can modulate tumour growth and progression by inducing the release of neurotransmitters or hormones in mice [Citation23]. In ovarian carcinoma, beta-adrenergic activation of the 3′,5′-cyclicadenosine monophosphate (cAMP)-protein kinase A (PKA) signalling pathway can enhance tumour angiogenesis, and blocking ADRB could diminish the numbers and weight of tumours in stressed mice [Citation24]. A recent study indicated that the signalling of ADRB2, which is enriched in liver, accelerates HCC progression by suppressing autophagic degradation of hypoxia-inducible factor 1-alpha (HIF-1α) [Citation25]. Noradrenaline/epinephrine (NE/E)-induced cell invasion can be mediated by both ADRA1A and ADRAB2 via cAMP-PKA and epidermal growth factor receptor (EGFR) signalling in HCC [Citation26]. However, our study showed that the expression of ADRA1A is downregulated in HCC. This paradox could be explained by the potential differences in biological function of ADRA1A with or without stress. Lamkin et al. found that phentolamine, an α-adrenergic blocker, could promote breast cancer cell proliferation and distant metastasis under non-stress conditions, whereas it could inhibit the proliferation and distant metastasis induced by chronic stress [Citation27]. The current results encourage us to explore further the complicated impacts of ADRA1A on HCC in future research.
Plenty of researches reported that tumour microenvironment (TME) was closely associated with tumour formation and progression [Citation28,Citation29]. In most of cancers including liver cancer, infiltrating immune cells (IICs) play an important role in multifactorial fields, including avoiding immune destruction, activating invasion and metastasis, and inducing angiogenesis [Citation16,Citation28]. Our study indicated that silencing ADRA1A mediated the down-regulation for most of IICs, especially TNF, IL. It could be increased activity of tumour metastasis and invasion. Additionally, we found that ADRA1A could regulated activation of oncogenes (such as NFE2L2) and inhabitation of tumour suppressor genes (such as APC, Notch3) in liver cancer. APC, Notch3 and NFE2L2 are important genes in primary liver cancer for tumorigenesis and metastasis [Citation30,Citation31]. ADRA1A might take a main effect in the related pathways. Moreover, White, Thomas A. et al reported that Monoamine oxidase A (MAOA) expression was negatively associated with progression of prostate cancer [Citation32]. Our study found that Monoamine oxidase B (MAOB), whose function is similar to MAOA as the degrading enzyme of catecholamine neurotransmitter, was up-regulated after knocking down ADRA1A, it might also mediate production of amine catabolism including reactive oxygen species (ROS) to promote progression for liver cancer.
The aberrant DNA methylation involved in hepatocarcinogenesis is related to liver cirrhosis and alcohol intake [Citation33]. In our study, the methylation levels of ADRA1A were significantly higher in HCC patients who consumed alcohol than in those who did not. To verify the potential correlation between alcohol intake and ADRA1A gene transcription, we analysed the GEO dataset and found that the expression levels of different isoforms of ADRA1A were significantly lower in alcoholic hepatitis tissues when compared to the levels in normal liver tissues, especially the levels of isoform 3 ()). Therefore, we speculated that long-term alcohol consumption could affect the methylation status of the ADRA1A promoter and further change the expression of this gene in liver cancer. In addition, we found that the hypermethylation of ADRA1A was associated with high AFP. AFP is a common clinical marker for HCC and is related to hepatic stem cell-like HCC [Citation34]. High serum AFP levels are commonly found in young HCC patients. Wang et al. compared the transcriptome profiles between young HCC patients and elderly HCC patients. Low levels of ADRA1A, which is one of the two most downregulated genes, are also found in young HCC patients [Citation35]. This finding implicates the underlying connections between AFP and the ADRA1A gene.
Aberrant methylation has recently received increasing attention because these alterations are relatively stable but potentially reversible therapeutically [Citation36]. Abundant genome-wide studies have investigated the usefulness of CpG methylation as markers of HCC prognosis [Citation37,Citation38]. Circulating tumour DNA methylation is emerging as a promising biomarker for multiple indications in HCC, including diagnosis, prognosis, and monitoring [Citation39,Citation40]. Our findings showed that the expression levels of ADRA1A are negatively correlated with the methylation of its promoter, which adds to the existing knowledge provided by previous studies. We analysed the capacity to discriminate between HCC and normal tissues, and the AUC of the mean methylation levels of ADRA1A was found to be 0.700 (P < 0.0001). This indicates that the methylation status of this gene could be a biomarker for HCC diagnosis.
In summary, we observed low expression levels and hypermethylation of ADRA1A in HCC. ADRA1A is the only gene that is regulated by DNA methylation among the nine ARs. The methylation status of ADRA1A was associated with several clinicopathological features, such as alcohol consumption, and it could be a diagnostic biomarker for HCC.
Materials and methods
Patient samples and clinical data collection
Between July 2008 and February 2014, 160 patients from Sir Run Run Shaw Hospital and Zhejiang Cancer hospital were diagnosed with HCC and received curative resection. One hundred and thirty-one male patients and 29 female patients were included in our study. The median age was 55 years old. HCC samples and adjacent noncancerous tissues (ANT) were collected and stored at −80°C for DNA extraction. Pathological characteristics were assessed independently by two pathologists according to the TNM staging system of the American Joint Committee on Cancer (AJCC 8th edition). All related data, including personal information, family history, clinical testing data, and pathology data were collected.
This research was approved and supervised by the Ethics Committee of Sir Run Run Shaw Hospital and the Ethics Committee of Zhejiang Cancer hospital. All patients were informed.
Gene bioinformatics and primer design
Detailed information about the ADRA1A gene was obtained from the University of California Santa Cruz (UCSC) genome database (http://genome.ucsc.edu/). To explore whether expression was regulated by its methylation status, we also queried the methylation and expression data of ADRA1A from the TCGA dataset. Three online public data analysing networks, cBioPortal (www.cbioportal.org/), Gene Expression Omnibus (https://www.ncbi.nlm.nih.gov/geo/), and GEPIA (http://gepia.cancer-pku.cn/), were used to obtain more information. We used the CpG Island Finder program in DBCAT software (http://dbcat.cgm.ntu.edu.tw/) to scan the sequence from 5000 bp upstream to 5000 bp downstream of the TSS of ADRA1A and further identified a candidate CpG island that was close to the TSS. The amplicon studied in our research is located on chr8:26722882–26723236. The ADRA1A primers used for PCR amplification in the Sequenom MassARRAY® platform were: forward primer 5′-aggaagagagGTTGGGGGAAGATTTAGTATTTTGT-3′ and reverse primer 5′-cagtaatacgactcactatagggagaaggctTCAACACAACCTCTTTCCCTAAAAC-3′. Nineteen CpG sites were included in our selected amplicon.
Cell lines and cell culture
Seven human HCC cell lines, namely SMMC-7721, LM3, SK-Hep1, HepG2, PLC/PRF/5, Snu423, and Huh7, and one normal hepatic cell line (LO2) were selected in our study. SK-Hep1 and Snu423 were purchased from ATCC; the others were gifts from the Cang Lab of Zhejiang University. All cell lines were cultured in DMEM containing 10% foetal bovine serum and 1% penicillin-streptomycin at 37°C in an atmosphere of 5% CO2. DAC (Targetmol, CAT #T1508), a DNA methyltransferase inhibitor, was diluted in dimethyl sulphoxide (DMSO) (Sigma, CAT #D2650). LM3 and SMMC-7721 cells were treated for 72 h with 5 μM or 10 μM DAC and the control group was treated with the same volume of DMSO. The medium was refreshed every day. The DAC treatment experiments were repeated three times for each HCC cell line.
Western blotting
Total protein was extracted from the cell lines using RIPA peptide lysis buffer (Beyotime Biotechnology, Jiangsu, China) containing 1% protease inhibitors (Pierce). The protein concentration was measured using a bicinchoninic acid (BCA) kit (Meilunbio, CAT #MA0082). For immunoblotting, 20 μg total protein was separated by SDS-PAGE and subsequently electrotransferred to PVDF membrane (Millipore). The membrane was treated with blocking buffer (5% non-fat milk in TBST) for 1 h at room temperature (25ºC) and then incubated with ADRA1A (1:1000, Abcam, CAT #ab137123) or glyceraldehyde-3-phosphate dehydrogenase (GAPDH, 1:1000, Abcam, CAT #ab181602) antibody overnight at 4ºC. After washing with PBS, a horseradish peroxidase-conjugated anti-rabbit secondary antibody (1:10,000, Abcam, CAT #ab6721) was incubated with the membrane for 1 h at room temperature. Signals were detected using the FDbio-Femto ECL kit (CAT #FD8030). The bands of western blot were quantified using the Image-Pro Plus version 6.0 software.
Immunohistochemistry
Three-micrometre-thick sections from 10% neutral formalin-fixed, paraffin-embedded tissues were used for immunohistochemistry. For staining, the sections were deparaffinized in xylene, rehydrated using graded ethanol concentrations, and washed in water. Antigen retrieval was performed using citrate buffer under high temperature and pressure for 5 min. Then, the sections were treated with a mixture of 3% hydrogen peroxide and methanol for 10 min and incubated with 10% normal serum to block non-specific antibody binding. The slides were further incubated overnight with ADRA1A antibody (1:200) at 4°C and then incubated with biotinylated secondary antibodies for 30 min at room temperature. After light counterstaining with haematoxylin (Meilunbio, CAT #MB9897) for 2 min, the slides were dehydrated, mounted with a coverslip, and observed under a microscope (Nikon Eclipse 80i). The immunostaining was scored according to the German immunoreacted score [Citation12].
Plasmid construction
The primer sequences for the ADRA1A promoter in the Huh7 cell line were: forward primer 5′-cagctagcTCAGCACAGCCTCTTTCCCT-3′ and reverse primer 5′-cactcgagGCTGGGGGAAGATTCAGCAT-3′. The pGL3-Basic vector was digested with NheI and XhoI restriction endonucleases and ligated with the ADRA1A promoter sequence using T4 DNA ligase (Thermo Fisher, CAT #EL0011). The sequence of the constructed plasmid was verified using Sanger sequencing and the plasmid was named pGL3-ADRA1A-pro. The original vector (pGL3-Basic) was used as a control.
The sequence of lentivirus shADRA1A was obtained from the website (https://www.sigmaaldrich.com/): forward, 5ʹ- CCGGCCTTTCAGAATGTCTTGAGAATTCAAGAGATTCTCAAGACATTCTGAAAGGTTTTTTGGTACC-3ʹ and reverse, 5ʹ- AATTGGTACCAAAAAACCTTTCAGAATGTCTTGAGAATCTCTTGAATTCTCAAGACATTCTGAAAGG-3ʹ. The shADRA1A sequence was inserted to the pLKO.1-pruo (Sigma, CAT #SHC001) which was digested with AgeI and EcoRI. The shADRA1A plasmid was constructed. Plasmid pLKO.1-pruo was used as control, namely shCtrl.
Transfection and luciferase assay
Human HEK293T cells were cultured as described above. For luciferase assays, the cells were cultured to 70–80% confluence in a 24-well plate and then transfected with a Renilla luciferase plasmid and either pGL3-ADRA1A-pro or pGL3-Basic (0.8 μg total, at a ratio of 1:1) using Lipofectamine 2000 (Invitrogen, CAT #11668019). The medium was replaced with fresh culture medium 6 h after transfection. Forty-eight hours post-transfection, the cells were lysed using 1× passive lysis buffer (PLB) at 4ºC for 30 min according to the manufacturer’s instructions (Promega, CAT #E1910). The supernatant was collected and 20 μl per well was added to 96-well solid white polystyrene microplates (Corning, CAT#3912) with 100 μl luciferase assay substrate II (LAR II). Firefly luciferase (FLU) was initially read using a luminometer (M5, Molecular Devices). Then, after adding 100 μl 1 × Stop & Glo® reagent (SGO), Renilla luciferase (RLU) was quantified using the same luminometer. The final normalized values were calculated as the ratio of FLU/RLU.
DNA extraction, bisulphite conversion, and mass array quantitative methylation analysis
According to the manufacturer’s procedure, genomic DNA was extracted from HCC tissues and ANT using the QIAamp® DNA Mini Kit (QIAGEN). The extracted genomic DNA (500 ng–1 µg) was further converted with sodium bisulphite using the EpiTect Fast DNA Bisulphite Kit (QIAGEN, Hilden, Germany). Then, the products were subjected to 3 steps, specifically PCR amplification, SAP cleanup, and T cleavage. The converted genomic DNA was stored at −20ºC until used with a SpectroCHIP® array and analysed on the MassARRAY® Analyser 4 instrument.
RNA extraction, cDNA synthesis, and real-time PCR (qPCR)
Total RNA was extracted from the 8 cell lines using Trizol Reagent (Invitrogen, CAT# 15596026) and treated with RNase-free DNase I (Takara). cDNA synthesis was conducted using the Hifair™ III 1st Strand cDNA Synthesis Kit according to the manufacturer’s instructions (Yeasen, Shanghai, China, CAT #11123ES10). qPCR was performed using the Hifair™ qPCR SYBR Green Master Mix (Yeasen, CAT #11201ES08). The ADRA1A primer sequences were as follows: forward, 5′-CGCTACCCAACCATCGTCAC-3′ and reverse, 5′-GAACAGGGGTCCAATGGATATG-3′; The GAPDH primer sequences were as follows: forward, 5′-GTGAAGCAGGCGTCGGA-3′ and reverse, 5′-AGCCCCAGCGTCAAAGG-3′. Each sample was tested in triplicate. The data were analysed using the 2−ΔΔCT calculation method.
Methylation specific PCR
LM3 and SMMC-7721 cell lines were treated by DAC (10 μM) or DMSO for 72 h, and the culture medium was refreshed every other day. Cells were harvested 72h after transfection at a speed of 2,000 × G for 5 min. After DNA extraction and bisulphite conversion, 20 μl mixture with 2 μl bisulphite converted DNA, 1.5 μl forward primer, 1.5 μl reverse primer, 10 μl ZymoTaq™ PreMix (Zymo Research, CAT# E2004) and 3 μl ddH20 were amplified using PCR. The primers were as follows: methylated (M) forward, 5ʹ-ATGATTCGGAATTTAAAATTTTAGC-3ʹ, methylated (M) reverse, 5ʹ-AAATAACTACGAACCAAAAACAACG-3ʹ; Unmethylated (U) forward, 5ʹ-TGATTTGGAATTTAAAATTTTAGTGT-3ʹ, Unmethylated (U) reverse, 5ʹ-ATAACTACAAACCAAAAACAACACC-3ʹ. Then PCR products were evaluated by 1.5% agarose gel electrophoresis. The bands of DNA fragments were detected by the automatic gel imaging analysis system (P&Q Science&Technology, CAT# JS-2000).
Lentivirus transfection and mRNA sequencing
Human HEK293T was transfected using Lipofectamine 2000 to produce lentivirus with constructed shADRA1A plasmid (or shCtrl), pMD2.G (Addgene, CAT# 12259) and psPAX2 (Addgene, CAT #12260) at a ratio of 5.7: 1.8: 4.5. The medium was replaced with 10% FBS fresh culture medium after 8h. Then lentivirus was harvested 72h after transfection. PLC/PRF/5 and Huh7 cell lines were chosen to infect shADRA1A and shCtrl lentivirus. Twenty-four hours after infection, the medium was replaced with 1μg/ml puromycin (Thermo Fisher, CAT# A1113802) culture medium to screen positive cells. The harvested cells were prepared to do downstream experiments or were dissolved in Trizol Reagent (Invitrogen, CAT# 15,596,026) to conduct mRNA sequencing. Paired-end sequencing on an IlluminaHiseq4000 was performed at the (LC Sciences, USA) following the vendor’s recommended protocol.
MTS assays
A total of 800 cells for PLC/PRF/5 or 1 × 10³ cells for Hunh7 lines which were both infected by shADRA1A and shCtrl were seeded in 96-well plates. Five mg/ml MTS (Promega, CAT# G3582) was added to measure optical density (OD) value at 1d, 3d, 5d and 7d using a wavelength of 490nm through by SpectraMax M5 devices.
Statistical analysis
Paired two-tailed Student’s t-tests were conducted to compare the methylation differences and expression differences of ADRA1A between HCC tissues and ANTs. Independent sample t-tests were used to investigate the associations between ADRA1A promoter methylation and clinicopathological features. Pearson correlation analysis was used to determine the significance of correlation between ADRA1A methylation status and expression. The correlation between the methylation at each CpG site was also assessed by Pearson correlation. ROC curves were utilized to evaluate the methylation level of ADRA1A as a predictive biomarker. The differentially expressed genes were selected with log2 (fold change) >1 or log2 (fold change) <-1 and with statistical significance (P value<0.05) by RStudio version 1.2 software using R package. An AUC of >0.5 was considered predictive. A P value of <0.05 was considered significant. All data were analysed using SPSS version 21.0.
Supplemental Material
Download MS Word (2.1 MB)Disclosure statement
No potential conflict of interest was reported by the authors.
Supplementary material
Supplemental data for this article can be accessed here.
Additional information
Funding
References
- Bray F, Ferlay J, Soerjomataram I, et al. Global cancer statistics 2018: GLOBOCAN estimates of incidence and mortality worldwide for 36 cancers in 185 countries. CA Cancer J Clin. 2018;68(6):394–424. PMID: 30207593.
- Marengo A, Rosso C, Bugianesi E. Liver cancer: connections with obesity, fatty liver, and cirrhosis. Annu Rev Med. 2016;67:103–117. PMID: 26473416.
- Bevilacqua M, Norbiato G, Chebat E, et al. Changes in alpha-1 and beta-2 adrenoceptor density in human hepatocellular carcinoma. Cancer. 1991;67(10):2543–2551. PMID: 1849789.
- Oben JA, Roskams T, Yang S, et al. Sympathetic nervous system inhibition increases hepatic progenitors and reduces liver injury. Hepatology. 2003;38(3):664–673. PMID: 12939593.
- Huan HB, Wen XD, Chen XJ, et al. Sympathetic nervous system promotes hepatocarcinogenesis by modulating inflammation through activation of alpha1-adrenergic receptors of Kupffer cells. Brain Behav Immun. 2017;59:118–134. PMID: 27585737.
- Martinez-Salas SG, Campos-Peralta JM, Pares-Hipolito J, et al. Alpha1A-adrenoceptors predominate in the control of blood pressure in mouse mesenteric vascular bed. Auton Autacoid Pharmacol. 2007;27(3):137–142. PMID: 17584443.
- Jensen KJ, Alpini G, Glaser S. Hepatic nervous system and neurobiology of the liver. Compr Physiol. 2013;3(2):655–666. PMID: 23720325.
- Wong CC, Li W, Chan B, et al. Epigenomic biomarkers for prognostication and diagnosis of gastrointestinal cancers. Semin Cancer Biol. 2019;55:90–105. PMID: 29665409.
- Li L, Li C, Mao H, et al. Epigenetic inactivation of the CpG demethylase TET1 as a DNA methylation feedback loop in human cancers. Sci Rep. 2016;6:26591. PMID: 27225590.
- Robertson KD. DNA methylation and human disease. Nat Rev Genet. 2005;6(8):597–610. PMID: 16136652.
- Zhang H, Ye J, Weng X, et al. Comparative transcriptome analysis reveals that the extracellular matrix receptor interaction contributes to the venous metastases of hepatocellular carcinoma. Cancer Genet. 2015;208(10):482–491. PMID: 26271415.
- Tang L, Tan YX, Jiang BG, et al. The prognostic significance and therapeutic potential of hedgehog signaling in intrahepatic cholangiocellular carcinoma. Clin Cancer Res. 2013;19(8):2014–2024. PMID: 23493353.
- Herman JG, Baylin SB. Gene silencing in cancer in association with promoter hypermethylation. N Engl J Med. 2003;349(21):2042–2054. PMID: 14627790.
- Jaenisch R, Bird A. Epigenetic regulation of gene expression: how the genome integrates intrinsic and environmental signals. Nat Genet. 2003;33(Suppl):245–254. PMID: 12610534.
- Hao X, Luo H, Krawczyk M, et al. DNA methylation markers for diagnosis and prognosis of common cancers. Proc Natl Acad Sci U S A. 2017;114(28):7414–7419. PMID: 28652331.
- Cole SW, Sood AK. Molecular pathways: beta-adrenergic signaling in cancer. Clin Cancer Res. 2012;18(5):1201–1206. PMID: 22186256.
- Luo DL, Gao J, Fan LL, et al. Receptor subtype involved in alpha 1-adrenergic receptor-mediated Ca2+ signaling in cardiomyocytes. Acta Pharmacol Sin. 2007;28(7):968–974. PMID: 17588332.
- Eng JW, Kokolus KM, Reed CB, et al. A nervous tumor microenvironment: the impact of adrenergic stress on cancer cells, immunosuppression, and immunotherapeutic response. Cancer Immunol Immunother. 2014;63(11):1115–1128. PMID: 25307152.
- Froelunde AS, Ohlenbusch M, Hansen KB, et al. Murine breast cancer feed arteries are thin-walled with reduced alpha1A-adrenoceptor expression and attenuated sympathetic vasocontraction. Breast Cancer Res. 2018;20(1):20. PMID: 29566737.
- Kavelaars A. Regulated expression of alpha-1 adrenergic receptors in the immune system. Brain Behav Immun. 2002;16(6):799–807. PMID: 12480508.
- Kassahun WT, Gunl B, Jonas S, et al. Altered liver alpha1-adrenoceptor density and phospholipase C activity in the human hepatocellular carcinoma. Eur J Pharmacol. 2011;670(1):92–95. PMID: 21910987.
- Soeda J, Mouralidarane A, Ray S, et al. The beta-adrenoceptor agonist isoproterenol rescues acetaminophen-injured livers through increasing progenitor numbers by Wnt in mice. Hepatology. 2014;60(3):1023–1034. PMID: 24923719.
- Hassan S, Karpova Y, Baiz D, et al. Behavioral stress accelerates prostate cancer development in mice. J Clin Invest. 2013;123(2):874–886. PMID: 23348742.
- Thaker PH, Han LY, Kamat AA, et al. Chronic stress promotes tumor growth and angiogenesis in a mouse model of ovarian carcinoma. Nat Med. 2006;12(8):939–944. PMID: 16862152.
- Wu FQ, Fang T, Yu LX, et al. ADRB2 signaling promotes HCC progression and sorafenib resistance by inhibiting autophagic degradation of HIF1alpha. J Hepatol. 2016;65(2):314–324. PMID: 27154061.
- Li J, Yang XM, Wang YH, et al. Monoamine oxidase A suppresses hepatocellular carcinoma metastasis by inhibiting the adrenergic system and its transactivation of EGFR signaling. J Hepatol. 2014;60(6):1225–1234. PMID: 24607627.
- Lamkin DM, Sung HY, Yang GS, et al. alpha2-Adrenergic blockade mimics the enhancing effect of chronic stress on breast cancer progression. Psychoneuroendocrinology. 2015;51:262–270. PMID: 25462899.
- Hanahan D, Coussens LM. Accessories to the crime: functions of cells recruited to the tumor microenvironment. Cancer Cell. 2012;21(3):309–322. PMID: 22439926.
- Quail DF, Joyce JA. Microenvironmental regulation of tumor progression and metastasis. Nat Med. 2013;19(11):1423–1437. PMID: 24202395.
- Campbell PJ, Getz G, Stuart JM, et al. Pan-cancer analysis of whole genomes. bioRxiv. 2017:162784. DOI:10.1101/162784 PMID.
- Priestley P, Baber J, Lolkema MP, et al. Pan-cancer whole-genome analyses of metastatic solid tumours. Nature. 2019;575:210–216. PMID: 31645765.
- White TA, Kwon EM, Fu R, et al. The Monoamine Oxidase A gene promoter repeat and prostate cancer risk. Prostate. 2012;72(15):1622–1627. PMID.
- Lambert MP, Paliwal A, Vaissiere T, et al. Aberrant DNA methylation distinguishes hepatocellular carcinoma associated with HBV and HCV infection and alcohol intake. J Hepatol. 2011;54(4):705–715. PMID: 21146512.
- Yamashita T, Ji J, Budhu A, et al. EpCAM-positive hepatocellular carcinoma cells are tumor-initiating cells with stem/progenitor cell features. Gastroenterology. 2009;136(3):1012–1024. PMID: 19150350.
- Wang HW, Hsieh TH, Huang SY, et al. Forfeited hepatogenesis program and increased embryonic stem cell traits in young hepatocellular carcinoma (HCC) comparing to elderly HCC. BMC Genomics. 2013;14:736. PMID: 24160375.
- Pan Y, Liu G, Zhou F, et al. DNA methylation profiles in cancer diagnosis and therapeutics. Clin Exp Med. 2018;18(1):1–14. PMID: 28752221.
- Villanueva A, Portela A, Sayols S, et al. DNA methylation-based prognosis and epidrivers in hepatocellular carcinoma. Hepatology. 2015;61(6):1945–1956. PMID: 25645722.
- Qiu J, Peng B, Tang Y, et al. CpG methylation signature predicts recurrence in early-stage hepatocellular carcinoma: results from a multicenter study. J Clin Oncol. 2017;35(7):734–742. PMID: 28068175.
- Xu RH, Wei W, Krawczyk M, et al. Circulating tumour DNA methylation markers for diagnosis and prognosis of hepatocellular carcinoma. Nat Mater. 2017;16(11):1155–1161. PMID: 29035356.
- Bronkhorst AJ, Ungerer V, Holdenrieder S. The emerging role of cell-free DNA as a molecular marker for cancer management. Biomol Detect Quantif. 2019;17:100087. PMID: 30923679.