
ABSTRACT
Background: Liquid biopsies offer significant potential for informing on cancer progression and therapeutic resistance via minimally invasive serial monitoring of genetic alterations. Although the cancer epigenome is a central driving force in most neoplasia, the accuracy of monitoring the tumor methylome using liquid biopsies remains relatively unknown. Objectives: to investigate how well two types of liquid biopsy (urine and blood) capture the prostate cancer methylome, and may thus serve as a non-invasive surrogate for studying the tumor epigenome. Methods: A cohort of four metastatic treatment naïve prostate cancer (PCa) patients was selected. Matched biopsy cores (tumor and histologically matched-normal), post-DRE, pre-biopsy urine, and peripheral blood plasma were available for each subject. DNA methylation was profiled utilizing the Infinium® MethylationEPIC BeadChip (Illumina) and analysed using the RnBeads software. Significantly (FDR adjusted P < 0.05) differentially methylated probes (DMPs) between tumor and MN were identified and examined in the liquids (done at a grouped and individual subject level). Results: DNA methylation analysis of urine and blood in men with metastatic PCa showed highly correlated patterns between the different liquid types (ρ = 0.93, P < 0.0001), with large contributions from non-tumor sources. DNA methylation profiles of liquids were more similar between subjects, than intra-individual liquid-tumor correlations. Overall, both urine and plasma are viable surrogates for tumor tissue biopsies, capturing up to 39.40% and 64.14% of tumor-specific methylation alterations, respectively. Conclusion: We conclude that both urine and blood plasma are easily accessible and sensitive biofluids for the study of PCa epigenomic alterations.
Introduction
Prostate cancer (PCa) is the most common non-cutaneous malignancy and third leading cause of cancer-related deaths in men in the Western world. With approximately 1.1 million new cases diagnosed in 2012, PCa remains a major cause of morbidity and mortality throughout the world [Citation1]. Despite the widespread use of prostate-specific antigen (PSA) as an early detection biomarker and advances in new endocrine therapies, the emergence of castration resistance in patients with the metastatic disease still represents a major cause of death from this disease [Citation2].
Epigenetic modifications are known to be centrally involved in PCa initiation and progression [Citation3]. In fact, DNA hypermethylation of tumor suppressor genes (such as APC and RASSF1) is observed to be amongst the earliest and most frequent of aberrations in PCa, surpassing conventional mechanisms of gene inactivation. Yet, despite advances in our understanding of the epigenetics of PCa, a major deficit exists in our knowledge of how these events unfold and interplay in the progression to the lethal castration-resistant phenotype. One reason for this knowledge-gap is the inherent difficulty in accessing metastatic tumor deposits for study.
The advent of ‘liquid biopsies’ has brought a viable alternative that can potentially overcome many of the challenges of sequential tissue/bone/bone-marrow biopsies. Analysis of tumor alterations via blood, urine, or saliva (amongst others) is fast emerging as a useful minimally invasive tool to study tumor biology, particularly in the context of advanced stage cancers [Citation4,Citation5]. Several studies have detailed the utility of circulating tumor DNA (ctDNA) or RNA [Citation6,Citation7], circulating tumor cells [Citation8,Citation9] or extracellular microvesicles [Citation10] for serial monitoring of tumor aberrations, typically point mutations identified first in the primary tumor. However, until recently, studies of epigenetic alterations in blood plasma/serum were surprisingly lacking [Citation11–Citation14]. The anatomical location of the prostate gland around the urethra makes urine a particularly relevant biofluid for the study of PCa. Indeed, several biomarker studies harnessed urine as a readily accessible source of prostate tumor cells [Citation15,Citation16].
The aim of this study was to explore how accurately the methylation patterns of liquid biopsies reflect those of the primary tumor. In a matched analysis of urine and plasma from four men with advanced stage PCa, we demonstrate that liquid biopsies (urine sediment and circulating cell-free (cfDNA) in peripheral blood plasma) enable sensitive measures of tumor-related DNA methylation.
Results
The study cohort
The study cohort consisted of four men who each presented with de novo, treatment-naïve metastatic PCa, evident by histological evaluation of transrectal ultrasound-guided (TRUS)-biopsy cores and radiographic imaging (pelvic MRI and/or bone scan; Supplemental Table 1). Age at diagnosis ranged from 58 to 76 years, and PSA from 10.9 to 1,400 ng/ml. Each man had bilateral high-grade disease (≥ Gleason grade 4), with 100% of cores positive for tumr in the left and/or right side of the gland. All four men demonstrated biochemical evidence of remission (PSA decline) after commencing hormone therapy, with a duration of responses ≥ 14 months (Supplemental Fig. 2).
Quality control of the cohort methylation data by principal component analysis revealed the largest source of variation derived from whether the samples were prostate (tissues) or non-prostate (liquids), followed by whether they were tumor or non-tumor (Supplemental Fig. 1C). Whilst three of the four patients showed this pattern, subject 1 was distinct. The youngest man in the study, with a grossly elevated PSA (1,400 ng/ml); he was remarkable in that his ‘matched normal’ (MN) prostate DNA methylation profile was more tumor-like than normal. Due to this gross difference, his MN sample was removed from further analysis. Additionally, both his urine and plasma appeared more prostate-like than liquid, potentially due to a higher-burden disease and thus a presumably greater contribution to the pool of cfDNA.
Histologically normal prostate tissue adjacent to tumor is epigenetically benign
We first considered whether histologically normal tissue was epigenetically distinct from matched tumor. To do this, we compared the mean DNA methylation values for the tumor (n = 4) and MN (n = 3) groups. Of 694,923 MethylationEPIC probes, almost 5% (32,452) were differentially methylated between tumor and MN (FDR P < 0.05; Supplemental Fig. 3). The majority of these (74.44%) DMPs were hypermethylated in prostate tumor.
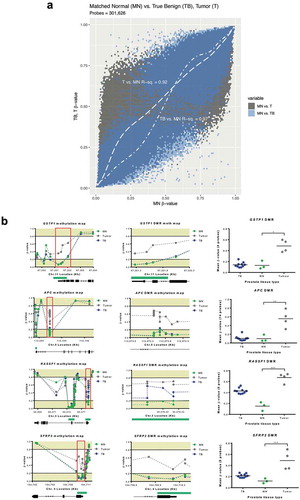
To further explore how well the MN samples represented benign prostate tissue, we compared DNA methylation between the MN group and a cohort of ‘true benign’ (TB) men who underwent radical cystoprostatectomy for bladder cancer and whom had no evidence of PCa. MN tissue demonstrated a higher correlation with TB (R2 = 0.97) than tumor tissue (R2 = 0.92), indicating more similarity with the DNA methylation profile of benign tissue. Additionally, tumor tissue showed increased methylation, pronounced at the most hypomethylated MN probes ()). We also considered several individual genes (GSTP1, APC, SFRP2, and RASSF1), for which hypermethylation and inactivation are considered hallmarks of PCa [Citation17]. Each of these genes demonstrated grossly distorted methylation patterns in tumors, compared to MN ()).
Figure 1. Matched normal tissue is epigenetically benign. (a), generalized additive model indicates that tumor group had increased methylation at probes hypomethylated in MN, whereas TB had a near-linear relationship with MN. (b), Schematic methylation maps for GSTP1, APC, SFRP2 and RASSF1 genes and DMRs (tumor versus MN). Gene structure and CpG islands (green) are indicated below the graphs. DMRs are indicated in the red boxes and show probes contained within the rank cut-off identified through the RnBeads differential methylation analysis. For comparative purposes, the β-values (extracted from a HM450K platform) for a cohort of TB prostate tissues from men with no evidence of PCa are also indicated. EPIC/HM450K probe β-values are indicated by filled circles. Statistical analysis was carried out using a Kruskal–Wallis and Dunn’s multiple comparison tests. P-values are as follow: *P≤ 0.05, ** P≤ 0.01, *** P≤ 0.001. Abbreviations: MN: matched normal, TB: true benign, DMRs: differentially methylated regions.
So, despite the high disease-volume in these patients, significant epigenetic differences were observed between tumor and MN tissues. We thus concluded that the MN samples were an appropriate control for evaluating tumor-related alterations in DNA methylation in the liquid biopsies.
Comparison of DNA methylation patterns between tissue and liquid biopsies
To assess the performance of the liquid biopsies at capturing the DNA methylation patterns of the tumor, we first examined the DNA methylation profiles of each biopsy type and how similar they were to each other. To do this, methylation of the 32,452 DMPs (between tumor and MN) was calculated for each sample type (n = 4, except MN, which included subjects 2–4).
The most striking observation was the high similarity between the liquid biopsies (ρ = 0.93; )). Comparing the methylation profiles of the liquids with the tissue biopsies, it was notable that both plasma and urine sediment (US) were more similar to MN than they were to tumor (ρ = 0.81, 0.87 vs 0.57, 0.50). We repeated this analysis within each individual subject’s liquid biopsies (Supplemental Fig. 4). US from the majority of subjects (3/4) showed similar weak correlations in DNA methylation with their matched tumor (range ρ = 0.32–0.35, P < 0.0001), with subject 3 displaying a higher correlation (ρ = 0.77, P < 0.0001). However, greater variability was observed for plasma cfDNA, with subject 1 and 3 displaying a higher correlation (range ρ = 0.61–0.70, P < 0.0001) with their respective tumor, when compared with subjects 2 and 4 (range ρ = 0.31–0.39, P < 0.0001), which were similar to the urines. DNA methylation profiles of liquids were more similar between the four subjects, than intra-individual liquid-tumor correlations.
Figure 2. Analysis of DNA methylation profiles between tissue and liquid biopsies. (a), Spearman’s correlation matrix showing DNA methylation profiles of tissue and liquid biopsies at the DMPs level (n = 32,452). Probe methylation values scatter-plot (lower panel), overall methylation distribution per sample (middle panel) and Spearman’s correlation values (upper panel) are depicted. All values are statistically significant (P < 0.001). (b), Deconvolution results for all 16 matched samples from the subjects included in the study. A reference methylation atlas was used to quantify the contribution of each cell type to the tissue and liquid biopsy samples, using the methylation data from the EPIC array. Only cell types that contribute > 1% are shown. (c), Proportion of prostate tissue detected across sample types. Each group of connected dots represents a subject, as indicated by the numbers displayed on the far left of the graph. (d), Heatmap with unsupervised clustering showing the methylation levels of the top 25% most DMPs between tumor and MN. This is shown for the hyper- (left) and hypomethylated (right) datasets (hyper and hypo correspond to a higher or lower, respectively, methylation seen in tumor vs MN). Colour key pertains to the level of methylation observed (0 – hypomethylated; 1 – hypermethylated). Columns indicate different samples, with a mean of several subjects being displayed for tumor (n = 4) and MN (n = 3). Rows indicate hyper- (6,040) and hypomethylated (2,074) DMPs. E, Schematic methylation map for RASSF1 DMR using selected DMPs from top 25% analysis. Gene structure and CpG islands (green) are indicated. Mean value was calculated based on the number of probes in the DMR, and all probes are consecutive in the chromosome. Subjects methylation values are shown as a group in MN and tumor, and individually for Plasma and US. Abbreviations: DMP – Differentially methylated probe; DMR – Differentially methylated region; MN – Matched normal; P – Plasma; US – Urine Sediment.
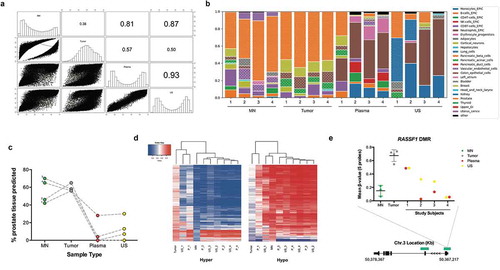
Collectively, these findings suggest that the majority of DNA methylation detectable in liquid biopsies does not originate from tumor DNA, despite the fact that each subject had advanced stage metastatic prostate cancer. This finding was confirmed utilizing the recently developed human cell-type DNA methylation atlas [Citation18], which showed detectable amounts of prostate DNA in the liquids, with large contributions from other sources, including haematopoietic origin ()), as previously reported for this tool. Urine sediments appeared to show more prostate content than plasma, and also contained a strong kidney and bladder signature (). As indicated by the methylation findings on the EPIC array, subject 1 demonstrated the highest percentage prostate in both his liquid biopsies.
Hierarchical clustering analysis of the liquid biopsies using the top 25% most differentially methylated sites between tumor and MN; 6,040 tumor-hyper DMPs and 2,074 tumor-hypo DMPs corroborated these findings ()). Subject 1’s plasma clustered with tumora in both hyper- and hypo-datasets, while all of the other subject’s liquid biopsies were more closely related to MN. The same patterns were observed when looking at the methylation profile of specific PCa-associated genes, such as RASSF1 ().
Annotation of DNA methylation
To understand the biological relevance of the PCa DMPs we searched for clusters of DMPs, herein referred to as DMRs, and defined by ≥ 3 hyper- or hypo-methylated probes within 2kb of each other. The 24,158 hypermethylated DMPs resulted in 1,690 DMRs, whilst the 8,294 hypomethylated DMPs were found not to produce any regions. Hypermethylated DMRs were relatively uniformly distributed across all autosomes and more than three-quarters of these were located within 5ʹ-regulatory regions and CpG islands ()).
Figure 3. Annotation of DMRs. (a), Distribution of tumor-specific DMRs detected in liquid biopsies, by chromosome, genetic and epigenetic domains. (b), Functional enrichment analysis of DMGs in the hypermethylated dataset. GO biological process terms were ranked by FDR corrected P-value and the top 100 (P < 0.05) were selected for the descriptive analysis. Each enriched component shows the percentage of genes (grey bar) and percentage of biological processes (blue bar) involved. Abbreviations: DMR – Differentially methylated region; BPs – Biological processes; DMGs – Differentially methylated genes; MN – Matched normal; US – Urine Sediment.
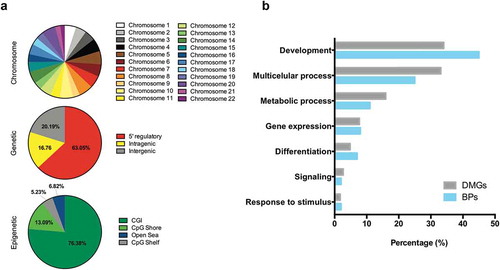
Additionally, we studied the genes that DMRs overlapped (differentially methylated genes, DMGs) to investigate the enrichment of biological processes using the PANTHER over-representation test of molecular function [Citation19]. Identified DMRs mapped to 1,038 annotated genes across the human genome, and these were involved in over 900 biological processes. Studying the most significantly represented processes (top 100, FDR-adjusted P < 0.05), we observed that a high percentage of DMGs (~70%) were ascribed to development and multicellular processes()). Other enriched biological processes included metabolism, differentiation, and gene expression. Notably, among the DMGs identified through this process, we could observe known genes that have previously been implicated in PCa carcinogenesis, including GSTP1, APC, RASSF1, SFRP2, RARB, and ZMIZ1.
Detection of cancer-associated DNA methylation in liquid biopsies
Finally, we ascertained the sensitivity of each subject’s liquid biopsies to detect tumor-specific differential methylation. To do this, we calculated the standard deviation (SD) for each tumor-DMP, across all tumors (n = 4). We then investigated whether the β-value methylation of each DMP in an individual’s tumor was detected in their matched plasma cfDNA and US, within two SD (of the value observed for the tumor).
Detection of tumor-DMPs ranged from 7.19% to 64.14% in plasma and 6.98% to 39.40% in US (). Subject 1 showed a higher detection of tumor-DMPs than the other three men, with plasma being more sensitive than US. Subject 3, however, showed a different trend, with the US detecting more DMPs than plasma. No differences were observed for subjects 2 and 4, with plasma and US capturing approximately 8–9% of tumor-DMPs. Notably, these tumor-DMPs detected in the liquids were not present in an independent cohort of aged self-reported healthy male controls.
Table 1. Sensitivity of tumor-DMP detection by liquid biopsies.
Tumor-DMPs (and their associated genes) detected in the liquids of all subjects (for both hyper and hypo-methylated datasets) are shown in Supplemental Table 2A (hypermethylated) and 2B (hypomethylated). Interestingly, one of these is located in ZMIZ1, which has previously been implicated in PCa carcinogenesis (Supplemental Fig. 5) [Citation13].
Discussion
In this study, we employed an array-based approach to interrogate the methylomes of two types of liquid biopsy, namely peripheral blood plasma and urine, to assess their performance at accurately reflecting the tumor methylome, in a non-invasive and thus potentially highly valuable way. Collectively we find that advanced stage prostate tumors have relatively more gains than losses in DNA methylation, and that these epigenetic alterations are captured by urine and plasma, to variable degrees between individuals.
DNA hypermethylation at promoter regions of tumor suppressor and regulatory genes is a widespread phenomenon in most human cancers [Citation20,Citation21]. Advancing technologies (such as cfMeDip-Seq) are now enabling DNA methylome analysis in plasma from cancer patients, showing that DNA methylation patterns can be used to detect and classify several different tumor types [Citation12]. However, until this state of the art publication by Shen et al. [Citation12], studies almost exclusively focused on small sets of individual genes, describing their utility as potential biomarkers [Citation11,Citation12,Citation14,Citation22–Citation24]. For PCa, the best characterized methylation biomarkers in liquids are typically APC, GSTP1, RASSF1A, and RARB. Because of the small sample size of our study, we did not attempt to investigate the presence of previously reported PCa methylated genes in the liquids, as to do so, may be an over interpretation of the data. Instead we show that liquids can be used in future larger studies to investigate methylomic alterations for diagnostic, prognostic, and therapeutic purposes. To the best of our knowledge, this is the first genome-wide DNA methylation discovery-based comparison between tumor and different types of liquid biopsies.
One prior study that analysed DNA methylation of four genes in matched urine and plasma from 142 patients referred for prostate biopsy, reported greater sensitivity in urine (47–74%) than plasma (17–37%) for all four markers [Citation25]. Studying epigenome-wide differential tumor methylation, our sensitives in urine and blood were generally lower than those previously reported for specific gene promoters. Furthermore, we could not show that epigenome-wide alterations in DNA methylation of the primary tumor are detected with greater sensitivity in urine than in plasma, albeit a small cohort. This is despite the fact that the urines used in this study were collected following a DRE, as it has been shown that this procedure is imperative for sensitive detection of tumor-related molecular aberrations [Citation26].
We suggest that a factor for the lower sensitivities of tumor-DMP detection in the liquid biopsies may relate to the technology platform. This study was carried out using the recently developed Illumina MethylationEPIC BeadChip microarray, which features probes targeting 866,830 individual CpG sites in the human genome. This represents an ~50% increase over earlier array-based platforms, such as the HM450K, reflected by inclusion of additional probes within gene bodies, intergenic and non-CpG island regions, thus increasing the coverage of distal regulatory elements [Citation27]. Previous studies demonstrated an excellent correlation with the HM450K array and whole genome bisulfite sequencing [Citation28]. Array-based technologies such as EPIC are appealing for their ease of use and low-cost compared with many sequencing-based approaches. However, methylation arrays output an average methylation value (β-value) at any given CpG site. A consideration in using methylation arrays in a non-invasive epigenetic study [Citation12,Citation29] is the knowledge that although our cells are genetically identical, different cell types possess different epigenomes. Despite evidence that cfDNA levels rise in patients with high burden disease, ctDNA is only a fraction of this, with other sources contributing towards the total amount of cfDNA. Indeed, detectable levels of ctDNA in prostate cancer are at the lower end of the cancer spectrum [Citation7]. Therefore, ctDNA methylation alterations may be masked by the cfDNA methylation patterns present from other sources. DNA sequencing and PCR applications enable the selective quantification of specific methylation patterns, which may ultimately allow for a more sensitive measure of tumor epigenetic alterations. This is also true for the US. In fact, in our study, tumor-specific changes showed a correlation of only 0.50–0.57 with both liquid biopsies. This was supported by the PCA analysis, where all of the liquids clustered together, roughly mid-way between tumor and non-tumor, indicating DNA methylation features from non-tumor sources. Similarly, the application of the human cell-type DNA methylation atlas showed detectable, albeit low levels of prostate DNA in the liquids, at comparable levels to those previously reported for metastatic PCa [Citation7,Citation13,Citation18,Citation30]. Interestingly, higher amounts of prostate DNA were evident in urine than plasma, which might be explained by the post-digital rectal examination (DRE) collection. This is the first description of the methylation atlas on urine, which shows comparable high haematopoietic contribution (also seen in blood) and a sizable kidney contribution in two of the subjects.
A recent analysis of DNA methylation changes in cfDNA from men with metastatic PCa, reported that DNA methylation patterns could predict sensitivity to abiraterone [Citation13]. Methylation of ZMIZ1, an androgen receptor transcriptional co-activator, was elevated in patients demonstrating resistance to abiraterone, suggesting its utility as a predictive marker of drug response. ZMIZ1 was also found to be hypermethylated in our study, detected in the plasma of all four men and the urine of three, which indicates that it could serve as an important predictive therapeutic marker. This finding, together with the high frequency of aberrant DNA methylation aberrations in tumor progression, suggests that non-invasive monitoring of DNA methylation could be an important application for liquid biopsies in clinical and translational medicine.
We acknowledge the small size of our study cohort and the limitations this brings. Small sample size can increase the chance of both false positives and false negatives from statistical analysis. However, the use of matched tissue and liquid biopsies controls for the effect of unwanted variables and make the data less susceptible to inter-individual variability. Various calculations have attempted to estimate the required sample size to adequately power differential methylation analysis with the EPIC array [Citation31,Citation32]. For example, it has been proposed that a sample size in the order of 200 subjects (100 cases and 100 controls) would be required to detect a 5% methylation change. Although this points towards our study being underpowered, such a largeclinical cohort of matched tissue and liquid biopsies would be extremely challenging to acquire. Metastatic treatment naïve prostate cancer presents an important opportunity for genomic/epigenomic analysis of this lethal disease, before any potential drug effects may influence the interpretation of data. However, the availability of matched tissues and different types of liquid biopsies from these men is extremely rare, and thus this is an understudied stage of disease. This type of analysis is important for precision medicine and the study of subsets of the population. Thus, we propose that further research, using an independent, powered cohort, is needed in order to generalize the results from this discovery cohort. Another important aspect of epigenome-wide studies is the large number of variables (i.e. probes) being considered. The more inferences are made, the more likely errors are to occur. To account for this, we used FDR-adjusted P-value thresholds to make our decisions about the changes that were called as ‘significant’. However, any small biological changes are likely to be missed when this stringent threshold is applied. One way to overcome these false discovery penalties is to filter probes prior to data analysis, such as probes that are located in areas of the genome more likely to change (i.e. promoters). The use of fewer variables implies a weaker correction for multiple testing, thus improving statistical power [Citation33,Citation34]. Such a decision would require careful consideration, in order not to introduce any analysis or statistical biases. Additionally, all subjects in this study presented with metastatic disease; however, the comparison between the liquid biopsies was made using methylation patterns of the primary tumor. Further work to profile the methylomes of metastatic deposits would need to be carried out in order to address how wellliquid biopsies capture epigenomic alterations of metastatic aberrations.
Conclusions
In conclusion, how representative different types of liquid biopsies are of the primary tumor methylome has not been addressed previously. In this discovery study, we have shown that both urine and plasma serve as excellent surrogates for detecting tumor-related epigenomic alterations. Given the central role of the epigenome in cancer progression and metastases, coupled with the value of liquid biopsies for sequential monitoring, this study indicates the use of these sample types for studying the dynamics of DNA methylation in tumor evolution.
Materials and methods
Clinical specimens
Four patients were recruited through an institutional review board-approved, prospective study, which enrolled men scheduled for TRUS-biopsy due to an elevated and/or rising PSA and/or a suspicious DRE. For each patient, formalin-fixed paraffin-embedded (FFPE) TRUS-biopsy cores, peripheral blood (≤ 9 ml) and post-DRE, pre-biopsy urine (≤ 50 ml) were collected. Peripheral blood and urine samples were processed within 3 h of collection from patients, by centrifugation at 1,500xg for 10 min, and 2,000xg for 10 min, respectively. Plasma (≤ 3 × 1 ml aliquots) and US were stored at −80⁰C, until being thawed for nucleic acid isolation. H&E stained sections of the biopsy cores were reviewed by a qualified histopathologist to identify tumor and MN tissue.
FFPE tissues from a cohort (n = 10) of men who underwent radical cystoprostatectomy for bladder cancer and whom were found to have no evidence of PCa were used for control purposes (TB cohort). Their age at surgery ranged from 48–79 years. Additionally, cfDNA EPIC data from a published cohort of aged self-reported healthy men was used for comparative purposes. Detailed features of this cohort have been previously described [Citation18].
DNA isolation
For each patient, five-serial sections of the FFPE biopsy cores, adjacent to the H&E section, were subjected to deparaffinization, before being macrodissected (using a scalpel) to obtain tissue from within the marked tumor and MN areas. Scraped tissue was used for DNA isolation using the QIAamp DNA FFPE tissue kit (Qiagen). cfDNA was isolated from 3 ml of thawed plasma, using the QIAamp Circulating Nucleic Acid (Qiagen). DNA was extracted from thawed US using the AllPrep DNA/RNA/mRNA Universal kit (Qiagen). Extracted DNA samples were quantified using the Qubit High-Sensitivity DNA quantification kit (Invitrogen) and stored at −80⁰C until further use.
Methylation profiling using the Infinium® MethylationEpic Beadchip
All 16 DNA samples, with yields ranging from 10 to 330 ng (Supplemental Fig. 1A), were bisulfite modified using the Zymo EZ DNA methylation kit, and eluted in 10 µl. Quality control was performed by absolute quantification real-time PCR on all: (i) 16 DNAs and (ii) post-bisulfite modification of the DNAs by a MethyLight qPCR specific for bisulfite converted DNA, yet independent of DNA methylation [Citation35]. The range in Cts relates to the input amount of DNA and are all within the range observed for high-quality samples (Supplemental Fig. 1B). DNA was subjected to the Illumina Restoration kit and the bisulfite modified and restored DNAs were analysed using the Infinium Human MethylationEPIC BeadChip (Illumina). Raw data are freely available for download on Gene Expression Omnibus (GEO) repository (GSE119260).
Data processing
Methylation array data were processed in the R statistical environment [Citation36]. Quality control and preprocessing were done with RnBeads package [Citation37,Citation38]. It involved two stages: (i) Firstly, probes overlapping with SNPs (n = 139,721) because of their potential to affect probe hybridization [Citation39]. A greedycut algorithm was next used to filter out probes and/or samples with the highest fraction of unreliable measurements [Citation37]. This resulted in the removal of a further 12,559 probes, but all samples were retained. Raw intensities were normalized using the BMIQ method, which corrects for the bias associated with type-2 probe values [Citation40,Citation41]; (ii) following normalization, a further filtering step removed all probes located outside of CpG sites (n = 2,797) and on the sex chromosomes (n = 17,304). A total of 16 samples and 694,923 probes remained for differential DNA methylation analysis. A similar bioinformatic pipeline was applied to the other cohorts: HM450K data on the cohort of 10 TB men were available for 301,626 MethylationEPIC probes and EPIC data on the cohort of 16aged self-reported healthy men were available for 705,902 MethylationEPIC probes (raw data obtained from GEO – GSE122126).
Analysis of differentially methylated probes (DMPs) and regions (DMRs)
All analyses were carried out using the hg19 genome assembly. PCa differentially methylated probes (DMPs) were identified through the differential methylation analysis pipeline of RnBeads, comparing tumor (n = 4) and MN (n = 3, subject 1 excluded) and selected based on a FDR-adjusted threshold of P < 0.05. DMPs were categorized as either tumor_hypermethylated or tumor_hypomethylated.
PCa DMPs were reduced to differentially methylated regions (DMRs) defined by ≥3 hyper- or hypo-methylated probes within 2kb of each other. DMRs were annotated according to their chromosomal, genetic (5ʹ regulatory region, intragenic or intergenic) and epigenetic (CpG island, shore, shelf, or open sea) distribution.
Additionally, the 25% most differentially methylated DMPs between tumor and MN were investigated in each subject’s liquid biopsies (plasma and US).
Sensitivity of the different types of liquid biopsies in detecting specific tumor-DMPs was done for all subjects, individually. A standard deviation (SD) was calculated for each tumor-DMP, across all tumors (n = 4). We then created a 2SD methylation interval for each DMP, around the β-value observed in each subject’s tumor. Subject’s own tumor-DMPs were sought in their matched liquids within this 2SD methylation interval. Tumor-specificity of the interval was ascertained by removing those DMPs detected in the interval of MN tissue or the plasma of aged healthy controls (n = 16).
Gene ontology (GO) analysis
GO analysis was accessed via http://geneontology.org/and the PANTHER over-representation test of molecular function was used. Gene IDs found in the annotation of DMRs were used to identify processes that were potentially affected by methylation. The top 100 most significantly enriched biological processes (FDR-adjusted P-value < 0.05) were studied.
Human methylation reference atlas
The human cell-type DNA methylation atlas [Citation18] (https://github.com/nloyfer/meth_atlas) was cloned and used to identify the origin of cfDNA and cells in the US of the 4 subjects.
Statistical analysis
Differential methylation analysis between tumor and MN was done in RnBeads using the limma method. Briefly, hierarchical linear models were created, and subsequently fitted using an empirical Bayes approach. This approach was chosen due to its robustness in handling complex experimental designs, whilst factoring in potential confounding variables and small sample sizes [Citation31,Citation42]. Due to the number of variables (probes), P-values were corrected for multiple testing (FDR) using Benjamini-Hochberg method and a threshold of P < 0.05 was selected for significance.
The generalized additive model (GAM) was used to investigate the relationship of MN to TB and tumor ()). Differences between the tumor, MN and TB at the gene level ()) were calculated by using a Kruskal–Wallis test (due to β-values not demonstrating a normal distribution). When statistically significant differences between the groups were detected, a Dunn’s multiple comparison test (post-hoc) was used to identify where the significance lay. Analysis of the correlation between the DNA methylation profile of each sample type (at the DMP level – ) and Supplemental Fig.4) was carried out using Spearman’s correlation. Additionally, a chi-square test was used to ascertain differences between tumor-DMP detection by plasma and US, in each subject (). All statistical analyses were performed using Prism 6 (GraphPad) and R (3.5.0).
Acknolwedgements
We gratefully acknowledge the support of iPROSPECT investigators (R.W.G Watson, R. McDermott and S. Glynn) and the HRB-funded Dublin Centre for Clinical Research Network, affiliated research nurses and technical staff, in particular John McCourt.
Author contributions
Conception and design: A.S. Perry, Development of methodology: R. Silva, B. Moran, C. Fahey, Acquisition of data (acquired and processed samples): R. Silva, C. Fahey, Histological evaluation of prostate biopsy cores: T. Vlajnic, S.P. Finn, Analysis and interpretation of data (e.g., statistical analysis, biostatistics, computational analysis): R. Silva, B. Moran, N.M. Russel, A.S. Perry, Writing and review of the manuscript: R. Silva, B. Moran, N.M. Russel, R. Manecksha, W. M. Gallagher, D. Brennan, A.S. Perry. Study supervision: W. M. Gallagher and A.S. Perry.
Supplemental Material
Download MS Word (9.1 MB)Disclosure statement
No potential conflict of interest was reported by the authors.
Supplementary material
Supplemental data for this article can be accessed here.
Additional information
Funding
References
- Wong MC, Goggins WB, Wang HH, et al. Global incidence and mortality for prostate cancer: analysis of temporal patterns and trends in 36 countries. Eur Urol. 2016 Nov;70(5):862–874.
- Sartor O, de Bono JS. Metastatic prostate cancer. N Engl J Med. 2018 Feb 15;378(7):645–657.
- Friedlander TW, Roy R, Tomlins SA, et al. Common structural and epigenetic changes in the genome of castration-resistant prostate cancer. Cancer Res. 2012 Feb 1;72(3):616–625.
- Bardelli A, Pantel K. Liquid biopsies, what we do not know (yet). Cancer Cell. 2017 Feb 13;31(2):172–179.
- Guttery DS, Blighe K, Page K, et al. Hide and seek: tell-tale signs of breast cancer lurking in the blood. Cancer Metastasis Rev. 2013 Jun;32(1–2):289–302.
- Dawson SJ, Tsui DW, Murtaza M, et al. Analysis of circulating tumor DNA to monitor metastatic breast cancer. N Engl J Med. 2013 Mar 28;368(13):1199–1209.
- Bettegowda C, Sausen M, Leary RJ, et al. Detection of circulating tumor DNA in early- and late-stage human malignancies. Sci Transl Med. 2014 Feb 19;6(224):224ra24.
- Heitzer E, Speicher MR. Digital circulating tumor cell analyses for prostate cancer precision oncology. Cancer Discov. 2018 Mar;8(3):269–271.
- Pantel K, Hille C, Scher HI. Circulating tumor cells in prostate cancer: from discovery to clinical utility. Clin Chem. 2019 Jan;65(1):87–99.
- Junker K, Heinzelmann J, Beckham C, et al. Extracellular vesicles and their role in urologic malignancies. Eur Urol. 2016 Aug;70(2):323–331.
- Mahon KL, Qu W, Lin HM, et al. Serum free methylated glutathione S-transferase 1 DNA levels, survival, and response to docetaxel in metastatic, castration-resistant prostate cancer: post hoc analyses of data from a phase 3 trial. Eur Urol. 2018 Nov;76(3):306–312.
- Shen SY, Singhania R, Fehringer G, et al. Sensitive tumor detection and classification using plasma cell-free DNA methylomes. Nature. 2018 Nov;563(7732):579–583.
- Gordevicius J, Krisciunas A, Groot DE, et al. Cell-free DNA modification dynamics in abiraterone acetate-treated prostate cancer patients. Clin Cancer Res. 2018 Jul 15;24(14):3317–3324.
- Barault L, Amatu A, Siravegna G, et al. Discovery of methylated circulating DNA biomarkers for comprehensive non-invasive monitoring of treatment response in metastatic colorectal cancer. Gut. 2018 Nov;67(11):1995–2005.
- Torres-Ferreira J, Ramalho-Carvalho J, Gomez A, et al. MiR-193b promoter methylation accurately detects prostate cancer in urine sediments and miR-34b/c or miR-129-2 promoter methylation define subsets of clinically aggressive tumors. Mol Cancer. 2017 Jan 31;16(1):26.
- Sanda MG, Feng Z, Howard DH, et al. Association between combined TMPRSS2: eRGand PCA3 RNA urinary testing and detection of aggressive prostate cancer. JAMA Oncol. 2017 Aug 1;3(8):1085–1093.
- Yegnasubramanian SKJ, Gonzalgo ML, Zahurak M, et al. Hypermethylation of CpG islands in primary and metastatic human prostate cancer. Cancer Res. 2004;64(6):1975–1986.
- Moss J, Magenheim J, Neiman D, et al. Comprehensive human cell-type methylation atlas reveals origins of circulating cell-free DNA in health and disease. Nat Commun. 2018 Nov 29;9(1):5068.
- Gene Ontology C, Blake JA, Dolan M, et al. Gene ontology annotations and resources. Nucleic Acids Res. 2013 Jan;41(Database issue):D530–5.
- Jones PA, Issa JP, Baylin S. Targeting the cancer epigenome for therapy. Nat Rev Genet. 2016 Sep 15;17(10):630–641.
- Aryee MJ, Liu W, Engelmann JC, et al. DNA methylation alterations exhibit intraindividual stability and interindividual heterogeneity in prostate cancer metastases. Sci Transl Med. 2013 Jan 23;5(169):169ra10.
- Hoque MO, Topaloglu O, Begum S, et al. Quantitative methylation-specific polymerase chain reaction gene patterns in urine sediment distinguish prostate cancer patients from control subjects. J Clin Oncol. 2005 Sep 20;23(27):6569–6575.
- Ellinger J, Haan K, Heukamp LC, et al. CpG island hypermethylation in cell-free serum DNA identifies patients with localized prostate cancer. Prostate. 2008 Jan 1;68(1):42–49.
- Hendriks RJ, Dijkstra S, Smit FP, et al. Epigenetic markers in circulating cell-free DNA as prognostic markers for survival of castration-resistant prostate cancer patients. Prostate. 2018 Apr;78(5):336–342.
- Payne SR, Serth J, Schostak M, et al. DNA methylation biomarkers of prostate cancer: confirmation of candidates and evidence urine is the most sensitive body fluid for non-invasive detection. Prostate. 2009 Sep 1;69(12):1257–1269.
- Brikun I, Nusskern D, Decatus A, et al. A panel of DNA methylation markers for the detection of prostate cancer from FV and DRE urine DNA. Clin Epigenetics. 2018;10:91.
- Moran S, Arribas C, Esteller M. Validation of a DNA methylation microarray for 850,000 CpG sites of the human genome enriched in enhancer sequences. Epigenomics. 2016 Mar;8(3):389–399.
- Pidsley R, Zotenko E, Peters TJ, et al. Critical evaluation of the illumina MethylationEPIC beadChip microarray for whole-genome DNA methylation profiling. Genome Biol. 2016 Oct 7;17(1):208.
- Gallardo-Gomez M, Moran S, Paez de la Cadena M, et al. A new approach to epigenome-wide discovery of non-invasive methylation biomarkers for colorectal cancer screening in circulating cell-free DNA using pooled samples. Clin Epigenetics. 2018;10:53.
- Vandekerkhove G, Struss WJ, Annala M, et al. Circulating tumor DNA abundance and potential utility in de novo metastatic prostate cancer. Eur Urol. 2019 Apr;75(4):667–675.
- Mansell G, Gorrie-Stone TJ, Bao Y, et al. Guidance for DNA methylation studies: statistical insights from the Illumina EPIC array. BMC Genomics. 2019 May 14;20(1):366.
- Graw S, Henn R, Thompson JA, et al. pwrEWAS: a user-friendly tool for comprehensive power estimation for epigenome wide association studies (EWAS). BMC Bioinformatics. 2019 Apr 29;20(1):218.
- van Iterson M, Boer JM, Menezes RX. Filtering, FDR and power. BMC Bioinformatics. 2010 Sep;7(11):450.
- Calza S, Raffelsberger W, Ploner A, et al. Filtering genes to improve sensitivity in oligonucleotide microarray data analysis. Nucleic Acids Res. 2007;35(16):e102.
- Campan M, Weisenberger DJ, Trinh B, et al. MethyLight. Methods Mol Biol. 2009;507:325–337.
- Team. RC. R: A language and environment for statistical computing. Vienna, Austria: R Foundation for Statistical Computing; 2016. Available from: https://www.r-project.org/
- Assenov Y, Muller F, Lutsik P, et al. Comprehensive analysis of DNA methylation data with RnBeads. Nat Methods. 2014;Nov;11(11):1138–1140.
- Muller F, Scherer M, Assenov Y, et al. RnBeads 2.0: comprehensive analysis of DNA methylation data. Genome Biol. 2019 Mar 14;20(1):55.
- Zhou W, Laird PW, Shen H. Comprehensive characterization, annotation and innovative use of infinium DNA methylation beadChip probes. Nucleic Acids Res. 2017 Feb 28;45(4):e22.
- Teschendorff AE, Marabita F, Lechner M, et al. A beta-mixture quantile normalization method for correcting probe design bias in Illumina Infinium 450 k DNA methylation data. Bioinformatics. 2013 Jan 15;29(2):189–196.
- Liu J, Siegmund KD. An evaluation of processing methods for HumanMethylation450 BeadChip data. BMC Genomics. 2016 Jun 22;17:469.
- Ritchie ME, Phipson B, Wu D, et al. limma powers differential expression analyses for RNA-sequencing and microarray studies. Nucleic Acids Res. 2015 Apr 20;43(7):e47.