
ABSTRACT
A major challenge in translating findings from genome-wide association studies (GWAS) to biological mechanisms is pinpointing functional variants because only a very small percentage of variants associated with a given trait actually impact the trait. We used an extensive epigenetics, transcriptomics, and genetics analysis of the TBX15/WARS2 neighbourhood to prioritize this region’s best-candidate causal variants for the genetic risk of osteoporosis (estimated bone density, eBMD) and obesity (waist-hip ratio or waist circumference adjusted for body mass index). TBX15 encodes a transcription factor that is important in bone development and adipose biology. Manual curation of 692 GWAS-derived variants gave eight strong candidates for causal SNPs that modulate TBX15 transcription in subcutaneous adipose tissue (SAT) or osteoblasts, which highly and specifically express this gene. None of these SNPs were prioritized by Bayesian fine-mapping. The eight regulatory causal SNPs were in enhancer or promoter chromatin seen preferentially in SAT or osteoblasts at TBX15 intron-1 or upstream. They overlap strongly predicted, allele-specific transcription factor binding sites. Our analysis suggests that these SNPs act independently of two missense SNPs in TBX15. Remarkably, five of the regulatory SNPs were associated with eBMD and obesity and had the same trait-increasing allele for both. We found that WARS2 obesity-related SNPs can be ascribed to high linkage disequilibrium with TBX15 intron-1 SNPs. Our findings from GWAS index, proxy, and imputed SNPs suggest that a few SNPs, including three in a 0.7-kb cluster, act as causal regulatory variants to fine-tune TBX15 expression and, thereby, affect both obesity and osteoporosis risk.
Introduction
Obesity is a public health problem affecting hundreds of millions of adults worldwide [Citation1]. It is a major risk factor for cardiovascular disease, chronic kidney disease, type 2 diabetes mellitus, and certain types of cancer, and thus poses a large and widespread health, social, and economic burden. The health consequences of obesity and, to a lesser extent, being overweight are determined not only by the total amount of body fat but also by where fat accumulates [Citation1]. Fat deposited around internal organs in the abdominal cavity (visceral adipose tissue, VAT) has a stronger association with metabolic and cardiovascular disease risk and mortality compared with hip or gluteal subcutaneous adipose tissue (SAT). VAT and SAT differ in preadipocyte replication and developmental origin, developmental gene expression, susceptibility to apoptosis and cellular senescence, vascularity, inflammatory cell infiltration, adipokine secretion and embryonic origin [Citation2–Citation5].
In the past 10 years, genome-wide association studies (GWAS) have identified more than 500 genetic loci associated with obesity-related traits. The studied traits are usually body mass index (BMI), which monitors overall obesity; waist circumference adjusted for BMI (WCadjBMI); and waist-hip ratio adjusted for BMI (WHRadjBMI), a proxy for body fat distribution [Citation6–Citation11]. BMI-associated loci were enriched in genes expressed specifically in the central nervous system [Citation8]. In contrast, genes for loci associated with WHRadjBMI showed enrichment in adipose tissue and in pathways for adipogenesis, angiogenesis, transcriptional regulation, and insulin resistance [Citation9,Citation12].
The vast majority of risk variants (usually SNPs) from GWAS of obesity and other traits are located in non-exonic regions of the genome [Citation8,Citation9,Citation13]. However, elucidating the causal SNP(s) and sometimes even the causal gene(s) within each obesity risk-related locus remains challenging [Citation14]. More refined integrated genetic/epigenetic approaches are needed to identify the best candidate regulatory SNPs for the long and difficult task of convincingly testing in relevant biological models the anticipated very small effects of the causal SNP(s). The GWAS-derived SNP exhibiting the smallest p-value for association with the studied trait at a given locus (index SNP) [Citation15] is often linked to very many proxy SNPs solely due to linkage disequilibrium (LD) and not to biological significance. This plethora of proxy or imputed SNPs hinders the identification and functional characterization of the actual causal variants. Recently, whole-genome profiles of epigenetics features, such as promoter-type or enhancer-type chromatin, have been used to help discriminate likely causal variants from bystander SNPs in high LD with them [Citation14,Citation16,Citation17]. GWAS SNPs, including those for obesity-related traits [Citation9], are generally enriched in enhancer chromatin or promoter regions [Citation13,Citation14,Citation18,Citation19]. In GWAS of (mostly) individuals of European ancestry (EUR) [Citation12,Citation20] or of East Asians [Citation6,Citation11], SNPs linked to TBX15 were identified as significantly associated with BMI, WHRadjBMI or WCadjBMI in mixed sex populations, or separately in women or men (Supplementary Table 1). TBX15 codes for a T-box transcription factor (TF) that may be involved in various aspects of adipose development and maintenance [Citation21–Citation23] and is known to be important in formation of the skeletal system [Citation24,Citation25]. SNPs in or near TBX15 are significantly associated not only with obesity traits but also with estimated heel bone mineral density (eBMD), a useful indicator of hip and non-spine fractures that is used as a proxy for osteoporosis risk [Citation26].
Our study of the relationships in GWAS of TBX15 to both adipose and bone biology provides novel insights into the developmental relationships between two related tissue lineages converging on one gene. Both adipocytes and osteoblasts (ostb; progenitor cells for bone formation) can be formed from mesenchymal stem cells (MSC) depending on the induced TFs [Citation27]. There are associations between obesity and osteoporosis that are of practical importance although they are highly dependent in direction as well as extent on gender, age, and the bone-region susceptibility to fracture [Citation28,Citation29].
GWAS for obesity traits, although not for eBMD, have also identified several index SNPs in the gene body of WARS2, TBX15’s nearest-neighbour protein-coding gene. WARS2 encodes a mitochondrial tryptophanyl tRNA synthetase that has been linked to mitochondrial-related neurodegeneration [Citation30]. One study suggested that increased WARS2 expression is associated with decreasing visceral adiposity through effects on brown adipose tissue function [Citation31]. It is unclear which of the many obesity-associated SNPs in the TBX15/WARS2 region or eBMD-detected SNPs at the TBX15 locus are biologically relevant to obesity or osteoporosis.
Here we explore in depth the genetic, epigenetic, and transcriptomic evidence for a possible causal role of certain TBX15- or WARS2-associated genetic variants in obesity or osteoporosis risk. Our analysis prioritized eight SNPs from hundreds of GWAS-related SNPs in the TBX15/WARS2 region as the most likely regulatory causal SNPs for obesity or osteoporosis risk. Importantly, half of these SNPs shared the same trait-increasing allele for both obesity and eBMD. These findings illustrate how manual curation of epigenetic and genetic data can help define candidates for causal GWAS-derived SNPs at a single gene locus of interest and stress the often overlooked importance of considering, in detail, cell-type and tissue-type epigenetics in identifying such candidates.
Results
The obesity- and eBMD-associated TBX15 gene has highly tissue-specific expression unlike its neighbour, WARS2
TBX15 is highly and preferentially expressed in tissues or cell types relevant to the studied GWAS traits. It is associated with WHRadjBMI, WCadjBMI and BMI in many GWAS (Supplementary Table 1). Of all the obesity-trait related genes, it had the highest preferential expression in SAT (but not VAT) relative to 34 types of non-adipose tissues, as assessed by RNA-seq on hundreds of samples (GTEx; ) and Supplementary Table 2A and data not shown [Citation19,Citation32]). The only tissues with higher expression of TBX15 than seen in SAT were skeletal muscle and tibial artery. The levels of expression of TBX15 depend on the exact fat depot, as shown in mice [Citation33]. There are two well-annotated full-length (RefSeq) gene isoforms of TBX15, whose 5ʹ ends are separated by 1.7 kb (NM_001330677.1 and NM_152380.2). With the exceptions of testis and liver, the isoform with the proximal TSS (NM_001330677.1; ) and )) predominated over the other isoform in all examined tissue samples (Supplementary Table 2B). Interestingly, a third isoform (ENST00000449873) corresponds to just the 3ʹ end of canonical TBX15 and is predicted to encode a truncated protein missing the DNA-binding domain. This isoform is the major one expressed in liver (). Surprisingly, the RNA from this little-studied truncated isoform constitutes almost half of the TBX15 RNA in SAT according to GTEx data. WARS2, whose 3ʹ end is ~45 kb upstream of the 5ʹ end of TBX15, has a broad expression profile among various tissues, a profile that is significantly different from that of TBX15 (). WARS2 is the nearest neighbour protein-encoding gene to TBX15 and has been linked to obesity-trait risk in GWAS [Citation6,Citation9] because of obesity-risk index SNPs overlapping its gene body (), triangles; Supplementary Table 1).
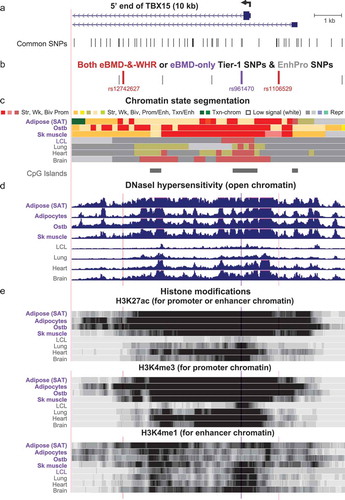
Figure 1. Obesity-trait or osteoporosis-related GWAS Tier-1 SNPs overlap tissue-specific regulatory chromatin in TBX15. (a) The two TBX15 RefSeq gene isoforms, a truncated ENSEMBL isoform, and the upstream noncoding RNA gene (chr1:119,412,120–119,554,007, hg19); the broken arrow at TBX15 shows the main TSS. (b) The location of two nonsynonymous coding SNPs (double arrows) and eight Tier-1 (best regulatory candidates) SNPs; ‘3,’ a cluster of three Tier-1 SNPs. (c) Roadmap-derived chromatin state segmentation of strong (str), weak (wk), or bivalent (biv; poised) promoter or enhancer chromatin or repressed (repr) chromatin; SAT, subcutaneous adipose tissue; ostb, osteoblasts; Sk muscle, skeletal muscle; PBMC, peripheral blood mononuclear cells; fib, fibroblasts; myob, myoblasts; myot, myotubes; LCL, lymphoblastoid cell line; HMEC, mammary epithelial cells; NHEK, embryonic kidney cells; HUVEC, umbilical vein endothelial cells; ESC, embryonic stem cells; dotted horizontal lines, super-enhancers. (d) ENCODE strand-specific total RNA-seq. (e) RNA-seq TPM (log10) from GTEx; the median TPM is given for some of the samples; VAT, visceral adipose tissue. All tracks were visualized in the UCSC Genome Browser and are aligned in this figure and –, and purple labels denote TBX15-expressing samples; grey, non-expressing samples; brown labels, samples expressing predominantly the truncated TBX15 isoform.
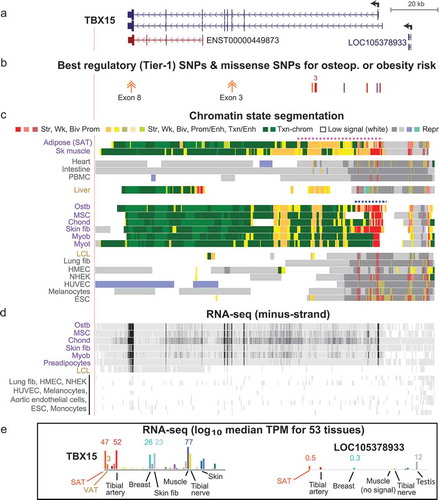
Figure 2. Many obesity-trait or eBMD risk-associated SNPs, EnhPro SNPs, and cis-eQTLs are found in the gene neighbourhood of TBX15. (a) The gene neighbourhood of TBX15 (chr1:119,134,901–119,884,900). (b) Obesity-trait or eBMD GWAS SNPs are designated as EnhPro SNPs if they overlap enhancer or promoter chromatin preferentially in SAT or ostb. (c) All index SNPs, proxy SNPs (r2 ≥ 0.8, EUR) derived from them, and imputed SNPs in this region from obesity-trait or eBMD GWAS. (d) eQTLs for TBX15 or WARS2 in SAT or VAT. (e) Placental mammalian conserved elements (from phastCons track at the UCSC Genome Browser). (f) Chromatin state segmentation as in . (g) CTCF binding determined by Roadmap ChIP-seq. Panels B-D show custom tracks derived from Supplementary Tables 4–6.
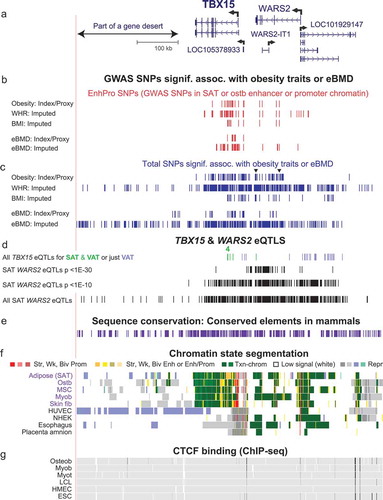
Table 1. Expression of TBX15 is significantly associated with that of the immediately upstream ncRNA gene, LOC105378933, but not with the further upstream WARS2.a
TBX15 was significantly associated with eBMD, an indicator of osteoporosis risk in GWAS, as well as with obesity traits. Homozygous protein truncating mutations in TBX15 are a cause of Cousin’s syndrome, a disease characterized by bone malformations and short stature [Citation25], which is consistent with the involvement of this gene in osteoporosis. Steady-state RNA levels for TBX15 in ostb are more than 200 times the median values for 11 heterologous cell strains ()) as seen in ENCODE RNA-seq data [Citation34] (Supplementary Table 3). MSC and chondrocytes (chond), both of which can be developmentally related to ostb [Citation35], expressed this gene at similar high levels.
High percentages of the index/proxy obesity- or BMD-related GWAS SNPs reside in regulatory chromatin in TBX15 enhancer or promoter chromatin
To prioritize the best candidates for causal risk among the GWAS-derived SNPs in the vicinity of TBX15 and WARS2, we used a multi-pronged approach. We assembled a set of significant (p < 5 x 10⁻⁸) obesity trait- and eBMD-related index SNPs at the TBX15/WARS2 locus from many GWAS by querying the GWAS Catalogue [Citation36]. The index SNPs were expanded to give proxy SNPs in high LD (r2 ≥ 0.8), and the sets of index and proxy SNPs were combined (index/proxy SNPs; Supplementary Table 4). We separately collected sets of imputed SNPs (p < 6.6 x 10⁻⁹) at this locus obtained from summary statistics from one WHRadjBMI meta-analysis of 694,649 individuals [Citation37] and from an eBMD meta-analysis of 426,824 individuals [Citation26] (Supplementary Table 5). Because most of the GWAS used predominantly or only subjects of European ancestry, for all the linkage analyses described below we used only EUR populations. Among the index/proxy SNPs, 42% of the 109 obesity-trait SNPs (abbreviated as obesity SNPs) and 54% of the 37 eBMD SNPs overlapped the TBX15 gene body while only 28% of the 427 WHRadjBMI and 25% of the 443 eBMD imputed SNPs did ()). Most of the index/proxy obesity or eBMD SNPs were in the imputed WHRadjBMI, or eBMD SNP sets (72 and 76%, respectively). The more selective nature of the index/proxy set of SNPs might be a result of the GWAS Catalogue extracting the most significant SNP from each independent locus to assign index SNPs [Citation15].
We found that 38% (36) and 51% (19) of the obesity and eBMD index/proxy SNPs as well as 15% (65) and 10% (46) of the obesity and eBMD imputed SNPs in the TBX15/WARS2 region overlapped enhancer/promoter chromatin preferentially in SAT or ostb, respectively (); Supplementary Tables 4–6). These variants will be referred to as EnhPro SNPs. Enhancer and promoter chromatin were defined by chromatin state segmentation in the Roadmap project as significantly enriched in histone H3 acetylation at lysine-27 (H3K27ac) and H3 monomethylation at lysine-4, (H3K4me1) or in H3K27ac and H3K4me3, respectively [Citation13]. The index/proxy or imputed EnhPro SNPs were found mostly in well-conserved intronic regions of TBX15 (). In the broad region of interest (chr1:118,717,862–119,916,299, which contains 5,650 common SNPs), only 2.1 and 1.5% of the common SNPs are located preferentially in enhancer or promoter chromatin in ostb and SAT, respectively, indicating the strong enrichment, as expected, of obesity or eBMD index/proxy or imputed SNPs in ostb/SAT regulatory chromatin.
The long intron 1 of TBX15 was especially enriched in EnhPro SNPs. In SAT, they were mostly in the 36.5-kb super-enhancer overlapping this intron (), dotted pink line). Most of the eBMD EnhPro SNPs in ostb were either in a smaller super-enhancer (), dotted blue line) or in a downstream enhancer region in TBX15 intron 1. Super-enhancers are unusually strong and long enhancers (> 5-kb) that contain clustered segments of chromatin enriched in H3K27ac and display the H3K4 methylation enrichment that is characteristic of enhancers or promoters [Citation38].
Obesity-related non-synonymous codon variants in TBX15 exons 3 and 8
Missense variants are found in GWAS as only a very small fraction of total SNPs significantly associated with a given trait. Two missense variants in TBX15, namely, rs10494217 (G/T, 0.84/0.16; H156N) in exon 3 and rs61730011 (A/C, 0.96/0.04; M566R) in exon 8 (), double arrows) were identified in obesity trait GWAS [Citation12,Citation37,Citation39]. The meta-analysis by Justice et al. [Citation12] involving 476,546 individuals (88% EUR) discovered only 56 array-wide significant variants associated with WHRadjBMI, and these included rs10494217 (p = 2 x 10⁻¹⁴) and rs61730011 (p = 3 x 10⁻²¹) in TBX15. Similar results were obtained for the former SNP in the study of Pulit et al. [Citation37] (Supplementary Table 5). Rs61730011, which has a frequency of only ~4% for the minor variant, is in a codon for an amino acid in the large C-terminal portion of TBX15, which is of unknown function, and has no human paralogs (as determined by BLASTP, https://blast.ncbi.nlm.nih.gov/). This minor variant would place two acidic amino acids adjacent to each other and replace one of the methionines in a remarkable sequence of seven amino acids containing three methionine residues (MEHS[M/R]HM) in the major allele (Supplementary Figure 1b).
The amino acid associated with rs10494217 is in the T-box DNA-binding domain [Citation40], and the SNP-overlapping codon and surrounding codons are highly conserved between TBX18 and TBX15. Moreover, the corresponding amino acid sequences in these subregions of TBX15 display strong sequence conservation among mammals and vertebrates (Supplementary Figure 1a), which suggests functionality of the corresponding protein subregion. Rs10494217 was predicted to have moderate impact on TBX15 protein function [Citation39] even though an H → N substitution is a conservative one, unlike the non-conservative M → R substitution of rs61730011. Mutations causing H → N substitutions in other proteins can be deleterious [Citation41]. Rs10494217, but not rs61730011, is also an eBMD-related SNP (Supplementary Table 5). However, rs61730011 was indirectly implicated in bone biology by its significant association with adult height in a GWA study [Citation42].
Identification of eight best candidate regulatory SNPs (Tier-1 SNPs) for obesity-trait and/or eBMD risk
We stratified GWAS-derived TBX15/WARS2 EnhPro SNPs to obtain a subset of best regulatory SNP candidates for obesity or osteoporosis risk (Tier-1 SNPs) by determining which of these SNPs that preferentially overlap enhancer or promoter chromatin in SAT or ostb also overlap DNaseI hypersensitive sites (DHS) in trait-relevant cell populations and predicted SNP-sensitive TF binding sites (TFBS). Only GWAS SNPs that met all these criteria were considered further as potential regulatory SNPs. Because missense coding SNPs are especially good candidates for risk-modifying alleles, we first eliminated from further consideration any EnhPro SNPs that were in LD with r2 > 0.2 to either of the two above-mentioned missense obesity SNPs (Supplementary Figure 2). Next, for an EnhPro SNP to be considered a Tier-1 SNP, it had to overlap a DHS in SAT, adipocytes, or ostb. We included the frequently observed overlap with only a small DHS or the shoulder of a larger DHS rather than requiring the SNP to be embedded in the central region of a moderate-to-large DHS peak. In addition, we required that Tier-1 SNPs were located at a predicted TFBS that should exhibit allele-specific binding to a TF expressed in ostb or SAT. Allele-specific TFBS were identified using four TFBS prediction programs, JASPAR, TRANSFAC, HaploReg, and SNP2TFBS [Citation43–Citation46] (Supplementary Table 7) and stringent manual curation (see Methods). We also looked for evidence of in vivo binding from genome-wide TF chromatin immunoprecipitation (ChiP-seq; Factorbook and UniBind [Citation47,Citation48]) but those databases were informative for only one of the identified Tier-1 SNPs (rs12742627, ) probably because of the lack of ostb and SAT samples in the database and the tissue-specificity of TBX15 cis-regulatory elements.
Table 2. Eight best candidates for transcription-regulatory obesity- or eBMD-causal SNPs (Tier-1 SNPs) in the TBX15 neighbourhood.
Figure 6. The genetic architecture of the Tier-1 SNPs at TBX15 suggests that there are multiple causal regulatory SNPs for obesity risk and for osteoporosis risk. (a) The SNPclip program at LDlink [Citation53] was used to trim the Tier-1 SNPs into groups with r2 > 0.2 (EUR); the SNP members of the resulting groups are shown in pie charts. (b) The haplotypes for trimmed Group I are shown with designations of trait-increasing (trait ↑) or trait-decreasing (trait ↓) alleles; the trait-increasing alleles from obesity GWAS are the risk alleles but for eBMD GWAS they are the non-risk alleles because of the osteoporosis-protective effects of high BMD.
![Figure 6. The genetic architecture of the Tier-1 SNPs at TBX15 suggests that there are multiple causal regulatory SNPs for obesity risk and for osteoporosis risk. (a) The SNPclip program at LDlink [Citation53] was used to trim the Tier-1 SNPs into groups with r2 > 0.2 (EUR); the SNP members of the resulting groups are shown in pie charts. (b) The haplotypes for trimmed Group I are shown with designations of trait-increasing (trait ↑) or trait-decreasing (trait ↓) alleles; the trait-increasing alleles from obesity GWAS are the risk alleles but for eBMD GWAS they are the non-risk alleles because of the osteoporosis-protective effects of high BMD.](/cms/asset/91f58fc8-d8ac-4db8-a11e-0f80ef06af6c/kepi_a_1716491_f0006_c.jpg)
Only eight of 93 obesity or eBMD EnhPro SNPs (Supplementary Table 6) satisfied all the above criteria for designation as Tier-1 SNPs (, –). Five were both obesity and eBMD SNPs, one was obesity only, and two were eBMD only. Most of the TBX15 Tier-1 SNPs associated with obesity or osteoporosis risk did not overlap regions where many TFs were bound as shown in publicly available ChIP-seq profiles [Citation48] () and Supplementary Table 8). However, cancer cell lines (and not ostb or adipocytes) were the main type of cells used for the ChIP-seq, and, in these types of studies, only a small fraction of known TFs were assayed.
Figure 3. The 5ʹ end of TBX15 contains all eight Tier-1 SNPs. (a) TBX15’s alternative first exons, part of intron 1 (chr1:119,484,631–119,535,630), and its main TSS (broken arrow). (b) WHRadjBMI and eBMD imputed SNPs that are EnhPro SNPs. (c) The eight EnhPro SNPs that qualify as Tier-1 SNPs; ‘2’ indicates two adjacent Tier-1 SNPs. (d) Chromatin state segmentation as in previous figures; Panc isl, pancreatic islets; Astroc, cultured astrocytes; CpG islands, CpG-rich regions as defined at the UCSC Genome Browser. (e) DNaseI hypersensitivity, vertical viewing range 0–10. (f) H3K27ac signal; vertical viewing range 0–4. (g) Binding of miscellaneous TFs to this region in a variety of cell cultures but not including ostb or adipocytes (see Supplementary Table 8). Coloured tick marks indicate positions of Tier-1 SNPs.
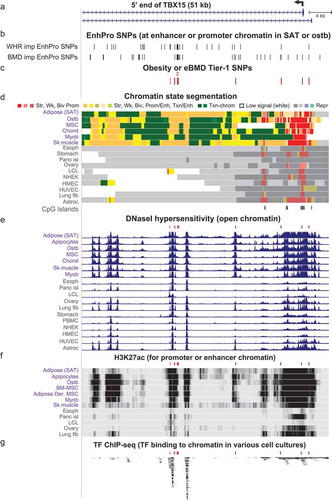
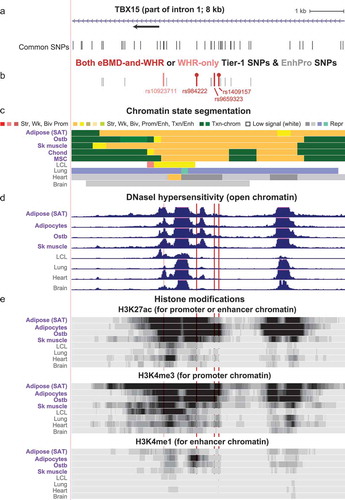
Figure 5. Zoomed in view of four Tier-1 SNPs in the middle of TBX15 intron 1. (a) The common SNPs in this subregion of intron 1 of TBX15 (chr1:119,500,183–119,508,182). (b-e) EnhPro SNPs and the subset of EnhPro SNPs that are designated Tier-1 SNPs, chromatin state segmentation, DNaseI hypersensitivity, and histone modifications as in except that the CpG island track is not shown due to there being no CpG islands in this region. In panel B, lollipops denote the two TBX15 eQTLs for SAT.
The trait-increasing allele (the allele associated with increasing WHRadjBMI, WCadjBMI, BMI, or eBMD) for six of the Tier-1 SNPs was the Alt allele and, importantly, the five Tier-1 SNPs, that were associated with obesity traits as well as eBMD, had the same trait-increasing allele for both traits (). With respect to gender differences, rs984222 and all obesity-associated index SNPs that are in high LD (r2 > 0.8) with it had much lower p-values for their association with obesity-related traits in women than in men (EUR), although the association for men was still highly significant (Supplementary Table 1). We also noted similar gender directionality for Tier-1 SNPs rs1106529 and rs10923711 and the missense variant rs61730011. In contrast, rs9659323 and the other obesity- or eBMD-associated index SNPs that are in high LD with it exhibited lower p-values for their association with both traits in men than in women (EUR).
Bayesian fine-mapping of TBX15/WARS2 GWAS SNPs was not informative for causal SNP selection
We compared the results of using our criteria for identifying Tier-1 SNPs from WHRadjBMI and eBMD GWAS to the results from fine-mapping the same imputed SNP data using the PAINTOR program [Citation17] in baseline analyses. We found only two WHRadjBMI SNPs with a posterior probability appreciably greater than 0, and these had a posterior probability of 1.0 and are in perfect LD with the above-described exon-3 missense variant, rs10494217 (Supplementary Table 9). Only 11 eBMD SNPs had appreciable posterior probabilities greater than 0.10 and the highest was 0.52. These 11 eBMD SNPs were either in repressed chromatin in the intergenic region downstream of the 3ʹ end of TBX15 or in intron 5 or 6 of this gene. Moreover, the results were almost identical when functional annotations for DHS overlap, chromatin state, and H3K27ac peak overlap at the SNPs in SAT or ostb were used in the fine-mapping. These findings suggest that the current statistical fine-mapping approaches are generally not informative for prediction of potential causal SNPs in the TBX15/WARS2 region, possibly because there might be multiple functional SNPs with complex LD structures in this region. Similarly, this complicated situation also hinders the use of common statistical colocalization approaches (e.g., coloc, gwas-pw) in our study, because these colocalization approaches are generally not able to distinguish a single causal variant that influences both traits from two or more separate causal variants in the presence of strong LD between the causal variants [Citation49,Citation50].
Three obesity- or osteoporosis-risk Tier-1 SNPs are in promoter or mixed promoter/enhancer chromatin near the 5ʹ end of TBX15 in SAT and osteoblasts
Three of the Tier-1 obesity or eBMD SNPs (rs12742627, rs961470, and rs1106529) are within a 6-kb region spanning the main TSS for TBX15 (). The obesity and eBMD SNP rs1106529, which is 1 kb upstream of this TSS, was embedded in promoter chromatin in SAT or mixed promoter/enhancer-type chromatin in adipocytes and ostb. It has only two high-LD proxies, both of which are in intergenic repressed chromatin in adipose tissue and adipocytes (Supplementary Table 4). The trait-increasing, Alt allele of rs1106529, but not the Ref allele, is predicted to overlap FOXO1, FOXC2, and SOX4 TFBSs ( and Supplementary Table 7). These FOX family proteins are associated with both obesity and bone formation (Supplementary Table 7) and the loss of SOX4 can cause osteopenia in mice [Citation51] providing further support for rs1106529 being a strong candidate for a causal regulatory SNP related to both obesity traits and eBMD.
Figure 4. Zoomed in view of three Tier-1 SNPs near the main TSS of TBX15. (a) The common SNPs (version 151) at the 5ʹ end of TBX15 (chr1:119,523,915–119,533,914). (b) The eBMD-and-WHRadjBMI or eBMD-only Tier-1 SNPs are shown in red or purple, respectively; EnhPro SNPs that did not meet all the criteria for Tier-1 SNPs are denoted by short grey bars. (c), (d), and (e) as in except that the vertical viewing range for DNaseI hypersensitivity was 0–7 and H3K4me3 and H3K4me1 are shown in addition to H3K27ac. Highlighting denotes the positions of Tier-1 SNPs.
The next two downstream Tier-1 SNPs, rs961470 (from eBMD GWAS) and rs12742627 (from eBMD and WHRadjBMI GWAS) are in near-perfect LD with each other (Supplementary Figure 2(a)) and are located in intron 1. They are part of an extended TSS-downstream promoter or mixed promoter/enhancer chromatin region containing many DHS in SAT, adipocytes, ostb, MSC, and skeletal muscle but also in several tissue or cell types not expressing TBX15 (). However, the H3K27ac signals at and near these SNPs were much stronger or covered more of the chromatin in these expressing tissues than in tissues with little or no TBX15 mRNA (). The strongest epigenetic discriminator between the expressing and non-expressing tissues and cell cultures in the gene region was the chromatin state ().
Only the trait-decreasing, Alt allele of rs961470 is predicted to bind to Nuclear Factor I-C (NFIC) and to SMAD3 (). Both of these TFs are implicated in regulating bone biology. SMAD3 is generally associated with transcription activation but NFIC can be either a transcription repressor or activator (Supplementary Table 7). For rs12742627, it is specifically the trait-increasing, Ref allele that is part of a predicted TFBS for E2F1, E2F4 (which are involved in normal bone formation) as well as E2F6, which is an inhibitor of E2F-dependent transcription, and TFDP1, which can heterodimerize with them (Supplementary Table 7). Support for rs12742627 being embedded in an E2F family binding site comes from combined ChIP-seq data and TFBS predictions (UniBind [Citation47],), which demonstrated that E2F6 was bound to this sequence in human embryonic stem cells (ESC); neither ostb nor adipocytes were similarly tested.
Three obesity- or osteoporosis-risk Tier-1 SNPs are in enhancer chromatin in a 0.7-kb cluster at TBX15 intron 1
Three obesity-and-eBMD Tier-1 SNPs (rs984222, rs9659323, and rs1409157) are clustered within 0.7 kb with an additional WHRadjBMI Tier-1 SNP (rs10923711) 1 kb further downstream in TBX15 intron 1 (). All four SNPs reside in strong enhancer chromatin in SAT, adipocytes, ostb, chond and MSC (). Two of them, rs984222 and rs1409157 (which are in perfect LD), were among the seven eQTLs found for TBX15 in SAT (, lollipops) according to GTEx data [Citation32] (Supplementary Table 10). Although the p-values for these SAT eQTLs for TBX15 are only in the range of about 1 to 3 x 10⁻⁵, all of them are also eQTLs for VAT (p = 1 x 10⁻⁷ to 7 × 10⁻⁶).
The trait-increasing, Alt alleles for rs984222 and rs1409157 are predicted to disrupt binding of MZF1, ZNF281, GATA2, or GATA6 TFs (). These TFs are implicated in regulating the differentiation in the adipose and/or bone lineages (Supplementary Table 7). Rs9659323 is at a predicted allele-specific TFBS for numerous members of the AP-1 (Fos/Jun) family as well as for MAF/NFE2 heterodimers. AP1 family members are involved in ostb maturation, formation of bone matrix proteins in ostb and chond, and adipocyte differentiation and, like the above-described TFs, all can act as transcriptional activators (Supplementary Table 7). Rs9659323 borders a 142-bp DNA repeat (short interspersed nuclear element, SINE) while rs984222 is in the middle of a 185-bp DNA repeat (long interspersed nuclear element, LINE; Supplementary Table 6). This overlap of repeats might be functionally important because some transcription elements can arise by exaptation of SINEs and LINEs [Citation52]. Although, rs9659323 and rs984222/rs1409157 are only in moderate LD (r2 = 0.45, EUR; ), the frequency of the haplotype with trait-increasing alleles for all three of these SNPs is considerable, ~41% of the EUR population ().
The most distal Tier-1 SNP in this region, the obesity-related rs10923711, was in a moderately strong DHS in SAT and adipocytes ( and ) and is predicted to bind with allelic specificity (for the Ref allele) to ETS2, ETV5, and ELK1, two of which have been described as being related to adipose biology (Supplementary Table 7). Although rs10923711 is the closest Tier-1 SNP to the TBX15 exon-3 missense SNP rs10494217, its LD with that SNP or the exon 8 missense SNP (rs61730011) was very weak (r2 = 0.02 or 0.05, EUR). It was also in low LD (r2 = 0.16 or 0.17) with the cluster of three Tier-1 SNPs (rs984222, rs9659323, and rs1409157) that is ~1 kb distant (Supplementary Figure 2), and so it was not in the same LD-thinned variant group [Citation53] as they ( and ), right). This is in contrast to rs1106529, which is 27-kb downstream in the promoter region but in the same LD-thinned group as the 0.7-kb cluster of three Tier-1 SNPs.
Obesity or eBMD SNPs overlapping WARS2 are probably only proxies for TBX15 intron-1 SNPs
Two obesity-related index SNPs, rs17023223 and rs2645294 (Table S1), are found in the gene body of the broadly expressed neighbour to TBX15 namely, WARS2 (), black triangles). Located in the 3ʹ UTR of WARS2, rs2645294 is one of the seven TBX15-specific eQTLs in SAT (Supplementary Table 10) while rs17023223 is embedded in weak enhancer chromatin at intron 1 of WARS2 in SAT. Neither of these SNPs nor their high LD (r2 > 0.8) proxies met the definition of a Tier-1 SNP. However, they are in moderately high LD with the three Tier-1 SNPs in the 0.7-kb cluster in intron 1 of TBX15. The LD values for rs2645294 with rs984222 or rs1409157 and for rs17023223 with rs9659323 are r2 = 0.76 and 0.71 (EUR), respectively. Moreover, just as there was a much stronger association of WHRadjBMI or WCadjBMI with women than men for index SNP rs984222, so index SNP rs2645294 showed a strong bias for women in WHRadjBMI while that was not the case for rs17023223 or rs9659323 (Supplementary Table 1). Therefore, the WARS2 index SNPs are probably associated with obesity risk through their linkage to several TBX15 Tier-1 SNPs. Nonetheless, the presence of many TBX15 eQTLs for VAT in the WARS2-adjacent non-coding RNA (ncRNA) gene LOC101929147 and many WARS2-specific eQTLs for SAT (and VAT) embedded in TBX15 or the downstream gene desert () suggests that this gene neighbourhood is part of large unit of higher-order chromatin structure with biologically important interactions. This interpretation is consistent with the finding of only few and weak sites for CCCTC-binding factor (CTCF, a chromatin conformation-altering protein) in this gene neighbourhood in various cell lines, including ostb ().
TBX18, a closely related paralog of TBX15, is associated with two Tier-1 SNPs for eBMD or obesity traits
TBX18 is structurally and functionally related to TBX15 [Citation25] but located on a different chromosome (Supplementary Figure 3). Like TBX15, TBX18 is preferentially expressed in ostb, MSC, chond, SAT, and adipocytes and shows much lower expression in VAT (Supplementary Table 2). Using the criteria described for evaluating the most likely causal SNPs in TBX15, we found an eBMD Tier-1 SNP, rs61543455 (p = 1.2 x 10⁻¹⁰ [Citation26]) for TBX18 in the gene’s far-downstream region (Supplementary Figures S3 and S4). Rs61543455 overlaps strong enhancer chromatin and a strong DHS in ostb and MSC. It is located at the 5ʹ end of an ncRNA gene (ENST00000454172), the nearest gene upstream of TBX18, which has a similar transcription profile in tissues to that of TBX18 (Supplementary Figure 3(g)). This SNP overlaps allele-specific TFBS for FOXO1, SOX4 and FOXP1 TFs. The first two of these TFs were also predicted to bind in an allele-specific manner to the TBX15-upstream Tier-1 SNP (rs1106529; ) and can positively regulate osteogenesis (Supplementary Table 7). In addition, the nearby eBMD SNP rs17792917 overlaps strong enhancer chromatin and a DHS in chond and weak promoter chromatin but not a DHS in ostb. It is located 1 kb upstream of the TSS of ENST00000454172 and is predicted to be an allele-specific TFBS for ARID5A, a chondrocyte-associated TF [Citation54]. Therefore, these two SNPs might impact osteoporosis risk by influencing TBX18 expression in ostb or chond by an indirect effect on transcription of an upstream ncRNA gene. No WHRadjBMI Tier-1 SNPs were seen near TBX18.
Discussion
Using in-depth manual curation, we prioritized eight variants as best candidates for regulatory causal SNPs (Tier-1 SNPs; ) from 692 TBX15/WARS2-region SNPs that are associated with obesity traits or eBMD. Only two of these Tier-1 SNPs, rs984222 and rs1106529, had been described previously as possible causal SNPs for obesity [Citation9,Citation10,Citation19,Citation55,Citation56], and none for osteoporosis. For selection of the Tier-1 SNPs, we made the following assumptions. First, a regulatory SNP is likely to be in or near a gene that is preferentially expressed in the phenotype-relevant tissue. Second, it should overlap enhancer or promoter chromatin selectively in this trait-related tissue [Citation10,Citation13,Citation14,Citation18,Citation55]. Third, it should overlap a DHS in this tissue because a DHS is indicative of TF binding [Citation57]. Last, the SNP should be within a stringently predicted allele-specific TFBS whose corresponding TF is expressed in the phenotype-relevant tissue [Citation58]. One caveat to these assumptions is that, besides the SAT and ostb trait-associated cell populations which we studied, there may be other cell types through which regulatory SNPs in the TBX15/WARS2 neighbourhood affect obesity or osteoporosis risk, e.g., bone-degrading osteoclasts [Citation59], for which detailed TBX15 expression and epigenetic data are not publicly available. Another caveat is that an obesity- and/or osteoporosis-risk SNP that does not overlap a single predicted allele-specific TFBS might assert its effect on transcription through interactions with multiple TF complexes [Citation60]. Lastly, there may be local SNP-related transcription-regulatory potential that is not captured by the studied H3 modifications or CTCF binding () and )).
All eight Tier-1 SNPs were within or immediately upstream of TBX15 even though the GWAS-identified SNPs extended over a 433-kb region. In this region, a TBX15-upstream ncRNA gene, LOC105378933, has an expression profile similar to that of TBX15 (). However, none of the EnhPro SNPs within or upstream of this ncRNA gene met the above-described criteria for Tier-1 SNPs. The nearest protein-encoding gene to TBX15, WARS2, was reported to have a significant association of its SAT and VAT RNA levels (by qRT-PCR) with obesity [Citation19]. In addition, the distribution of GTEx-determined eQTLs for SAT and VAT () suggests that the upstream and downstream neighbourhood of TBX15/WARS2 is a unit of higher-order chromatin structure. WARS2 encodes a broadly expressed, mitochondrial tryptophanyl tRNA synthetase, which could impact metabolism in adipose tissue through effects on mitochondria. Nonetheless, it is likely that the two index WARS2-overlapping obesity-trait associated SNPs and their enhancer chromatin-overlapping proxies are probably associated with obesity traits in GWAS just because they are in high LD with Tier-1 SNPs in the 0.7-kb cluster at TBX15 intron 1.
All the obesity Tier-1 SNPs and three of the eBMD Tier-1 SNPs associated with TBX15 were embedded in the gene’s SAT or ostb super-enhancer. Such large enhancers play a major role in tissue-specific transcription regulation of developmental genes [Citation38]. Most of the TFs predicted to bind in an allele-specific manner to Tier-1 SNP-containing sequences have known biological associations with adipose or bone biology ( and Supplementary Table 7). In contrast to the eight candidate causal SNPs found from our manual curation, no good candidate regulatory SNPs for modulating obesity risk and only poor candidates for eBMD risk were found when we evaluated large sets of imputed SNPs in the TBX15/WARS2 region by fine-mapping using the PAINTOR program [Citation61]. Manual curation of epigenetic and transcriptomic data revealed that the Tier-1 SNPs often overlapped only small DHS in the tissue or cell type of interest. Small DHS can denote TF binding in cis, just as for large DHS [Citation62], although the smaller peaks probably indicate fewer TFs bound to that subregion. Our stringent manual curation of allelic TFBS overlapping SNPs eliminated as poor matches some SNP-containing sequences that TFBS matching programs, including TRANSFAC and JASPAR, rated as good matches. In addition, manual inspection of transcriptomics and chromatin state segmentation databases produced evidence for a small transcript (ENST00000449873.1) initiated within the 3ʹ portion of the canonical TBX15 gene () that was almost the only transcript in liver. Surprisingly, according to the GTEx database [Citation32], this truncated transcript comprised about half of the TBX15-derived transcripts in SAT. Although this transcript was assigned protein-coding potential by ENSEMBL, its biological role is unknown, and it does not include sequences specifying the TBX15 DNA-binding domain. Given the overlap of four of the Tier-1 SNPs with enhancer chromatin in liver, such a transcript might contribute to the examined risk associations of SNPs in this region.
TBX15 can heterodimerize with the closely related TBX18 to form a potent repressor working in conjunction with Groucho (TLE) corepressors [Citation63]. Remarkably, our analysis of eBMD GWAS data [Citation64] indicates that the TBX18 gene is also associated with eBMD. This is consistent with the partial overlap of functions and high amino acid sequence homology between TBX15 and TBX18 proteins [Citation25,Citation65].
Our analysis of GWAS data highlighting TBX15 as both an osteoporosis- and obesity-related gene harbouring risk SNPs is consistent with the importance to bone development of TBX15 [Citation24] and the relationships of this TF to adipose biology [Citation19,Citation21,Citation22,Citation33,Citation66,Citation67]. It is also in accord with the interrelationships in the development of bone and adipose tissue [Citation68] and the preferential expression of TBX15 in both adult-derived ostb and SAT. The high and tissue-specific expression of TBX15 in SAT suggests that some of its functions in the adipose lineage involve homoeostasis or responses to physiological changes. TBX15 is expressed in a fat depot-specific manner [Citation19,Citation22,Citation66] despite heterogeneous expression among the SAT-derived adipocytes and among preadipocytes expressing adipose-lineage markers [Citation66]. It is also preferentially expressed in MSC (which can give rise to ostb) and chond (which are in an alternative pathway to bone formation) [Citation22,Citation66,Citation69]. There is also evidence for the involvement of TBX15 in modulating white and brown/brite adipocyte differentiation; mitochondrial function and oxidative or glycolytic metabolism in adipose cells; and cold-adapted adipose metabolism among the Inuit [Citation21,Citation22,Citation33,Citation66,Citation67]. In addition, this TF has a well-established role in the embryonic development of many parts of the skeleton [Citation24,Citation25].
Whether TBX15 has a positive or negative effect on adiposity is controversial. Gesta et al. [Citation23] reported that five-fold overexpression of TBX15 impaired differentiation in a preadipocyte cell line and reduced mitochondrial mass and triglyceride accumulation. However, in a previous study the same group reported a positive relationship between WHR or BMI increases and increases in qRT-PCR-determined TBX15 mRNA levels in human abdominal SAT but the opposite relationship in VAT [Citation70]. Sun et al. found that homozygous knockout of Tbx15 targeted to adipose tissue in mice was associated with increased fat mass when the mice were fed high-fat diets [Citation71] suggesting that TBX15 levels are negatively correlated with obesity. They observed impaired adipocyte browning in inguinal adipose (SAT) upon cold challenge, which they related to the weight gain. In contrast, Singh et al. reported that TBX15 null mice were leaner than their control littermates in addition to having reduced bone size and muscle mass [Citation24]. Gburcik et al. [Citation22] found that knock-down of Tbx15 expression decreased transcription of white and brown/brite adipogenic marker genes in short-term differentiating cultures of preadipocytes from inguinal or brown adipose depots. From adipose-specific Tbx15 heterozygous mouse knockouts, Ejarque et al. [Citation21] observed no change in differentiation in TBX15 knockdown experiments on preadipocytes but reported higher levels of TBX15 protein (by immunoblotting) in SAT from obese vs. lean individuals.
A positive correlation of TBX15 expression with obesity is suggested by the finding that rs984222 (one of our Tier-1 SNPs) is an eQTL whose risk allele is significantly and positively associated with TBX15 expression in SAT [Citation32] and in the much lower-expressing VAT [Citation20,Citation32]. In considering the relationship of TBX15 to obesity, it should be noted that obesity is associated with increases in both SAT and VAT depots [Citation5]. The relationship of TBX15 to obesity is probably complicated by the depot-dependent levels of TBX15 expression. Importantly, GWAS-derived SNPs in TBX15 were derived from associations with different obesity traits, WCadjBMI and BMI as well as in WHRadjBMI (Supplementary Table 1). A further complication in understanding the role of TBX15 in obesity from experimental studies is that fine-tuning changes in TBX15 activity, like the very small alterations in expression expected from GWAS regulatory SNPs, might have different directional effects on TBX15 functionality than large experimentally induced changes.
The direction of the relationship between TBX15 expression and bone health is much clearer. Homozygous inactivating mutations in TBX15/Tbx15 in humans (Cousin syndrome) and mice (double knockout and Droopy ear homozygous mutant) are linked predominantly to multiple skeletal abnormalities [Citation25,Citation72]. Moreover, studies of embryogenesis in normal and Tbx15 null mutant mice implicate Tbx15 protein in controlling development of bone throughout the body during embryogenesis possibly by up-regulating the number of early bone precursor cells (MSC and chondrocytes) [Citation24]. Interrelationships between the bone and adipose lineages include the findings that MSC and mesenchymal progenitor cells can to give rise to either ostb or adipocytes depending on the cellular milieu [Citation2,Citation27,Citation35]. Postnatally, similar steady-state levels of TBX15 mRNA and shared promoter and enhancer chromatin were seen in ostb, chond and MSC (), which suggests that TBX15 Tier-1 SNPs might play a role in modulating BMD risk in all three of these cell types.
Part of the biological effect of TBX15-associated Tier-1 SNPs on obesity traits and eBMD might occur through an anti-apoptotic mechanism in adipose and bone precursor cells (ostb, MSC, and chond) and in the corresponding mature cells (adipocytes and osteocytes) prenatally and postnatally. A common function for TBX15 in adipose and bone biology might explain our remarkable finding that each of the five Tier-1 SNPs that came from both obesity trait and eBMD GWAS had the same trait-increasing allele for obesity as for eBMD. TBX15 was reported to have an anti-apoptotic role in examined thyroid cancer cell lines [Citation16]. Apoptosis can alter adipose tissue both at the adipocyte and preadipocyte levels in normal stressed or unstressed tissue [Citation3,Citation73]. It is also a major shaper of prenatal and postnatal bone biology by affecting numbers of bone progenitor cells (MSC/chond/ostb), bone-degradative osteoclasts, and osteocytes [Citation35] although there has been only very little examination [Citation24] of the effects of TBX15 on apoptosis in bone or adipose cells or progenitors. Other ways that TBX15 might impact obesity risk and eBMD is by increasing progenitor cell numbers through a mechanism involving cell cycling [Citation24,Citation74] or cell differentiation [Citation23]. In the case of either decreased cell death or increased cell cycling, the result could be strengthening bone (increased eBMD correlated with good health) or increased adiposity (correlated with poorer health when in VAT or deep superficial abdominal SAT [Citation5]).
We propose that multiple SNPs, rather than a single one, in the gene body or promoter region of TBX15 fine-tune regulation of this gene’s expression in target tissues and thereby alter the genetic risk of obesity and osteoporosis. This conclusion is in accord with our finding that the obesity or eBMD Tier-1 SNPs each fell into three separate thinned variant groups based on genetic architecture (), each of which had their SNPs in enhancer or promoter chromatin found preferentially in SAT or ostb/MSC/chond. The two missense SNPs in exons 3 and 8 constitute two additional thinned variant groups. Most of the TFs corresponding to the predicted allele-specific TFBS can either repress or activate transcription depending on the chromatin context and were found to have special roles in adipose or bone biology (Supplementary Table 7). One of the thinned groups of SNPs (Group I; ) contains Tier-1 SNPs from both obesity-trait and eBMD GWAS. The four Tier-1 SNPs in this group (rs984222, rs9659323, rs1409157 and rs1106529), three of which are clustered within 0.7 kb in a SAT super-enhancer and in ostb enhancer chromatin in TBX15, might act together in a Alt-allele risk haplotype that has a frequency of about 0.41 (EUR; )) [Citation14]. Nonetheless, without experimental assays, we cannot discount the possibility that these four SNPs are correlated just because of LD irrespective of biological cooperation.
Conclusions
Our in-depth, manually-curated bioinformatics analysis of hundreds of GWAS-derived SNPs from the TBX15/WARS2 region led to only eight prioritized regulatory SNPs as prime risk candidates for obesity and/or osteoporosis risk, all of which were at the 5ʹ end of TBX15 and apparently acting independently of two TBX15 missense SNPs. In the course of this study, we have developed a strategy for prioritizing SNPs from GWAS using not just the transcription status and epigenetics in the GWAS trait-relevant tissue or cell type, but also epigenetic marks that are seen preferentially in the tissue or cells overexpressing the gene associated with these SNPs. In addition, we have shown the usefulness of considering both the collection of index/proxy SNPs and imputed SNPs as the database for analysis in this prioritization. Lastly, we have demonstrated that manual curation of several different TF binding site databases and checking the expression patterns and biological associations of these TFs are helpful in identifying best candidates for regulatory causal SNPs.
Methods
GWAS-derived SNPs and LD analysis
TBX15/WARS2 and TBX18 SNPs that were significantly (p < 5 x 10⁻⁸) associated with WHRadjBMI, WCadjBMI, BMI and eBMD were retrieved from the NHGRI-EBI GWAS Catalogue (downloaded August, 2019 [Citation36];) and termed as index SNPs. The index SNPs were expanded to a set of proxy SNPs (r2 ≥ 0.8 in a 1-Mb window, EUR population from the 1000 Genome Project Phase 3 [Citation75];) by using PLINK v1.9 [Citation76]. In addition, we retrieved summary statistics datasets for WHRadjBMI [Citation37] and eBMD [Citation26], which are the largest publicly available summary statistics for these traits, and extracted imputed significant SNPs (p < 6.6 x 10⁻⁹) for TBX15 (chr1:118,717,862–119,916,299) and for TBX18 (chr6:84,921,843–86,171,855). For subdividing the Tier-1 SNPs into thinned LD groups (pairwise r2 > 0.2, EUR) we used the SNPclip function of the LDlink suite [Citation53]. From LDlink, LDmatrix (EUR) was used for the heat map of LD and LDhap was utilized for the haplotype analysis.
Transcriptomics
Tissue RNA-seq data were from Genotype-Tissue Expression (GTEx) RNA-seq median gene expression levels [Citation32] for 36 tissue types (Table S2; median TPM from hundreds of samples for most tissue types, including SAT and VAT). eQTLs for SAT and VAT are also from GTEx, and no eQTLS are available for osteoblasts. The GTEx SAT samples were from beneath the leg’s skin and VAT samples from the parietal peritoneum. For cell cultures, we used total RNA-seq data (ENCODE/Cold Spring Harbor Lab) for 12 cell culture types (Table S3; average RPKM of technical duplicates) [Citation77] rather than poly(A)+ RNA because this was the only type of RNA-seq available for ostb, chond, and MSC; in Figure 1, the vertical viewing range was 0 – 200. For RNA-seq, the ostb were from femoral bone of a 62 y male and a 56 y female; bone marrow-derived MSC (referred to as MSC) were from femoral bone marrow of a 57 y male and a 60 y female; chond from knee or femoral cartilage of a 64 y male and a 56 y female; preadipocytes were undifferentiated cells from white SAT pooled from two individuals. The exact origins of ostb and bone marrow-derived MSC for ENCODE and Roadmap samples is not known but chond were obtained by in vitro differentiation of bone marrow-derived MSC.
Epigenetics
All epigenetic data are from Roadmap Project [Citation13] and available at the UCSC Genome Browser (http://genome.ucsc.edu/) [Citation34]. Chromatin state assignments at the SNPs of interest came from the 18-state chromatin state segmentation track with promoter chromatin as states 1, 2 and 4, enhancer chromatin as states 7–11, and mixed promoter/enhancer chromatin as state 3. In figures, the colour-coding of Roadmap for the promoter and enhancer chromatin states was slightly modified for clarity as shown in the figures. Obesity EnhPro SNPs were defined as obesity-trait GWAS-derived SNPs embedded in promoter or enhancer chromatin present in SAT and no more than two of the 11 other tissue types from among the following tissues: aorta, liver, pancreas, pancreas islet, lung, spleen, left ventricle of the heart, brain dorsolateral prefrontal cortex, CD14+ monocytes, peripheral blood mononuclear cells and psoas skeletal muscle. eBMD EnhPro SNPs are eBMD GWAS-derived SNPs within promoter or enhancer chromatin in ostb but in no more than two of the following 12 types of cell cultures: lung fibroblasts, foetal lung fibroblasts (IMR90), keratinocytes and melanocytes from foreskin, mammary epithelial cells, myoblasts, umbilical vein endothelial cells, astrocytes, adult dermal fibroblasts and epidermal keratinocyte primary cell cultures or ESC (H1) and lymphoblastoid (GM12878) cell lines. The adipose tissue sample for Roadmap chromatin state segmentation and DNaseI hypersensitivity profiling is a mixture of five samples from females (49Y, 59Y, 41Y, 25Y and 81Y) [Citation13]. It was not designated as SAT in the Roadmap project but is in the ENCODE project (https://www.encodeproject.org/search/?type=Biosample). This assignment is confirmed by the extensive strong enhancer and promoter chromatin overlapping TBX15 in this adipose sample () and the high expression levels of TBX15 in SAT samples and much lower levels in VAT samples (>300 samples each, Supplementary Table 2). It is also consistent with the lack of promoter or enhancer chromatin for WT1 [Citation13,Citation34], a marker for VAT [Citation4]. For other comparisons, we used Roadmap epigenetic data from mixed bone marrow-derived MSC cultures from four individuals, adipocytes from bone marrow MSC (female), as well as the other tissues and cell types given in figures and tables. DHS for EnhPro SNPs were scored as narrow peaks (narrowPeaks from DNase-seq) for ostb, SAT, and adipocytes except for rs9659323 and rs1409157, for which the designation was based on visual assessment of DHS tracks using the UCSC Genome Browser.
Allelic TFBS predictions
To determine whether EnhPro SNPs were embedded in predicted TFBS, we used primarily the UCSC Genome Browser track for JASPAR 2018 [Citation34,Citation46] and TRANSFAC [Citation43] programs and secondarily SNP2TFBS [Citation45] and HaploReg v4.1 [Citation44]. Unlike the other three programs, JASPAR gives predictions only for the Ref allele. For JASPAR matches, we considered only TFs with scores ≥400 unless a perfect match was found in the literature for the examined binding site (see rs984222 and MFZ1; Supplementary Table 7). For TRANSFAC predictions, we used a 15-b input sequence with the SNP in the middle and required matrix scores > 0.8 and core scores > 0.9 using the 2019.2/Vertebrate TFBS database and the settings for Only High Quality Matrices and Minimize False Positives. For HaploReg, we used only the ‘known’ position weight matrix (PWM) data that gave a difference of ≥ 5 for the HaploReg Ref vs. Alt scores. For all the predicted TFBS, the corresponding sequence-specific DNA-binding TF had to have a TPM of ≥ 2 in SAT or a moderate or strong signal in ostb in the RNA-seq track at the UCSC Genome Browser (see above). We used manual curation to retain only those predictions for which all of the conserved positions in the PWM had exact matches and no more than one base in a partly conserved position had only a partial match (≤ 5 fold difference in binding of the genomic base compared with the PWM-favoured base). For determining that a TFBS overlapping a SNP is likely to be allele-specific in its TF binding, we required that the disfavoured allele had a position probability that was ≥5-fold lower than that of the favoured allele in the PWM matrix. We checked all the Tier-1 SNPs for overlaps to experimentally determined TFBS in the UniBind and Factorbook tracks for TF-ChIP-seq in the UCSC Genome Browser [Citation47,Citation48].
Summary statistics imputation and fine-mapping analyses
We first augmented the GWAS summary statistics imputed SNPs from the sex combined WHRadjBMI dataset of Pulit et al. [Citation37] using ARDISS (Automatic Relevance Determination for Imputation of GWAS Summary Statistics) [Citation78] and all their summary statistics-derived SNPs for chr1:119,369,719–119,803,112 (hg19) to obtain the maximum overlap of our obesity-related index/proxy SNPs with obesity imputed SNPs (77%). This enhanced imputation was only used for fine-mapping of the WHRadjBMI SNPs. For the eBMD fine-mapping, the imputed SNPs from Morris et al. [Citation26] were used without further imputation because there was >70% overlap of eBMD index/proxy SNPs with these imputed SNPs. We, then, applied a Bayesian approach, PAINTOR (Probabilistic Annotation INtegraTOR, version 3.1) [Citation61], which is an Expectation Maximization algorithm that integrates Z-scores for association between each SNP and the trait, LD structures, and functional annotations, to calculate the posterior probability for each SNP and prioritize the most plausible causal variants at a given locus. The 1000 Genome Project Phase 3 (EUR) [Citation75] served as the reference genotypes for imputation and fine-mapping analyses. For functional annotations, we queried overlap of the SNPs with the following attributes: exonic DNA, 165 PAINTOR-provided TFBS annotations, Roadmap-derived enhancer and promoter chromatin segmentation state, and H3K27ac in ostb and SAT, DHS narrow peak in ostb and adipocytes, and CTCF binding sites in ostb.
Supplemental Material
Download MS Excel (171 KB)Supplemental Material
Download MS Word (370.4 KB)Acknowledgments
We are very grateful to Dr. Bogdan Pasaniuc and Ms. Ruth Dolly Johnson for their generous help with the PAINTOR analyses.
Disclosure statement
No potential conflict of interest was reported by the authors.
Supplementary Material
Supplementary material for this article can be accessed here.
Additional information
Funding
References
- Lynes MD, Tseng YH. Deciphering adipose tissue heterogeneity. Ann N Y Acad Sci. 2018 Jan;1411(1):5–20. PubMed PMID: 28763833; PubMed Central PMCID: PMCPMC5788721.
- Merrick D, Sakers A, Irgebay Z, et al. Identification of a mesenchymal progenitor cell hierarchy in adipose tissue. Science. 2019 Apr 26;364(6438):eaav2501. PubMed PMID: 31023895.
- Tchkonia T, Morbeck DE, Von Zglinicki T, et al. Fat tissue, aging, and cellular senescence. Aging Cell. 2010 Oct;9(5):667–684. PubMed PMID: 20701600; PubMed Central PMCID: PMCPMC2941545.
- Chau YY, Bandiera R, Serrels A, et al. Visceral and subcutaneous fat have different origins and evidence supports a mesothelial source. Nat Cell Biol. 2014 Apr;16(4):367–375. PubMed PMID: 24609269; PubMed Central PMCID: PMCPMC4060514.
- Kelley DE, Thaete FL, Troost F, et al. Subdivisions of subcutaneous abdominal adipose tissue and insulin resistance. Am J Physiol Endocrinol Metab. 2000 May;278(5):E941–8. PubMed PMID: 10780952.
- Akiyama M, Okada Y, Kanai M, et al. Genome-wide association study identifies 112 new loci for body mass index in the Japanese population. Nat Genet. 2017 Oct;49(10):1458–1467. PubMed PMID: 28892062.
- Kichaev G, Bhatia G, Loh PR, et al. Leveraging polygenic functional enrichment to improve GWAS power. Am J Hum Genet. 2019 Jan 3;104(1):65–75. PubMed PMID: 30595370; PubMed Central PMCID: PMCPMC6323418.
- Locke AE, Kahali B, Berndt SI, et al. Genetic studies of body mass index yield new insights for obesity biology. Nature. 2015 Feb 12;518(7538):197–206. PubMed PMID: 25673413; PubMed Central PMCID: PMCPMC4382211.
- Shungin D, Winkler TW, Croteau-Chonka DC, et al. New genetic loci link adipose and insulin biology to body fat distribution. Nature. 2015 Feb 12;518(7538):187–196. PubMed PMID: 25673412; PubMed Central PMCID: PMCPMC4338562.
- Yoneyama S, Yao J, Guo X, et al. Generalization and fine mapping of European ancestry-based central adiposity variants in African ancestry populations. Int J Obes (Lond). 2017 Feb;41(2):324–331. PubMed PMID: 27867202; PubMed Central PMCID: PMCPMC5296276.
- Wen W, Kato N, Hwang JY, et al. Genome-wide association studies in East Asians identify new loci for waist-hip ratio and waist circumference. Sci Rep. 2016 Jan 20;6:17958. PubMed PMID: 26785701; PubMed Central PMCID: PMCPMC4726286.
- Justice AE, Karaderi T, Highland HM, et al. Protein-coding variants implicate novel genes related to lipid homeostasis contributing to body-fat distribution. Nat Genet. 2019 Mar;51(3):452–469. PubMed PMID: 30778226.
- Kundaje A, Meuleman W, Ernst J, et al. Integrative analysis of 111 reference human epigenomes. Nature. 2015 Feb 19;518(7539):317–330. PubMed PMID: 25693563.
- Tak YG, Farnham PJ. Making sense of GWAS: using epigenomics and genome engineering to understand the functional relevance of SNPs in non-coding regions of the human genome. Epigenetics Chromatin. 2015;8:57. PubMed PMID: 26719772; PubMed Central PMCID: PMCPMC4696349.
- Schaid DJ, Chen W, Larson NB. From genome-wide associations to candidate causal variants by statistical fine-mapping. Nat Rev Genet. 2018 Aug;19(8):491–504. PubMed PMID: 29844615; PubMed Central PMCID: PMCPMC6050137.
- Arribas J, Gimenez E, Marcos R, et al. Novel antiapoptotic effect of TBX15: overexpression of TBX15 reduces apoptosis in cancer cells. Apoptosis. 2015 Oct;20(10):1338–1346. PubMed PMID: 26216026.
- Kichaev G, Yang WY, Lindstrom S, et al. Integrating functional data to prioritize causal variants in statistical fine-mapping studies. PLoS Genet. 2014 Oct;10(10):e1004722. PubMed PMID: 25357204; PubMed Central PMCID: PMCPMC4214605.
- Ernst J, Kheradpour P, Mikkelsen TS, et al. Mapping and analysis of chromatin state dynamics in nine human cell types. Nature. 2011 May 5;473(7345):43–49. PubMed PMID: 21441907.
- Schleinitz D, Bottcher Y, Bluher M, et al. The genetics of fat distribution. Diabetologia. 2014 July;57(7):1276–1286. PubMed PMID: 24632736.
- Heid IM, Jackson AU, Randall JC, et al. Meta-analysis identifies 13 new loci associated with waist-hip ratio and reveals sexual dimorphism in the genetic basis of fat distribution. Nat Genet. 2010 Nov;42(11):949–960. PubMed PMID: 20935629; PubMed Central PMCID: PMCPMC3000924.
- Ejarque M, Ceperuelo-Mallafre V, Serena C, et al. Adipose tissue mitochondrial dysfunction in human obesity is linked to a specific DNA methylation signature in adipose-derived stem cells. Int J Obes (Lond). 2019 June;43(6):1256–1268. PubMed PMID: 30262812.
- Gburcik V, Cawthorn WP, Nedergaard J, et al. An essential role for Tbx15 in the differentiation of brown and “brite” but not white adipocytes. Am J Physiol Endocrinol Metab. 2012 Oct 15;303(8):E1053–60. PubMed PMID: 22912368.
- Gesta S, Bezy O, Mori MA, et al. Mesodermal developmental gene Tbx15 impairs adipocyte differentiation and mitochondrial respiration. Proc Natl Acad Sci U S A. 2011 Feb 15;108(7):2771–2776. PubMed PMID: 21282637; PubMed Central PMCID: PMCPMC3041070.
- Singh MK, Petry M, Haenig B, et al. The T-box transcription factor Tbx15 is required for skeletal development. Mech Dev. 2005 Feb;122(2):131–144. PubMed PMID: 15652702.
- Sheeba CJ, Logan MP. The roles of T-Box genes in vertebrate limb development. Curr Top Dev Biol. 2017;122:355–381. PubMed PMID: 28057270.
- Morris JA, Kemp JP, Youlten SE, et al. An atlas of genetic influences on osteoporosis in humans and mice. Nat Genet. 2019 Feb;51(2):258–266. PubMed PMID: 30598549; PubMed Central PMCID: PMCPMC6358485.
- Li X, Huynh H, Zuo H, et al. Gata2 is a rheostat for mesenchymal stem cell fate in male mice. Endocrinology. 2016 Mar;157(3):1021–1028. PubMed PMID: 26812161; PubMed Central PMCID: PMCPMC4769372.
- Dolan E, Swinton PA, Sale C, et al. Influence of adipose tissue mass on bone mass in an overweight or obese population: systematic review and meta-analysis. Nutr Rev. 2017 Oct 1;75(10):858–870. PubMed PMID: 29028271.
- Fassio A, Idolazzi L, Rossini M, et al. The obesity paradox and osteoporosis. Eat Weight Disord. 2018 June;23(3):293–302. PubMed PMID: 29637521.
- Theisen BE, Rumyantseva A, Cohen JS, et al. Deficiency of WARS2, encoding mitochondrial tryptophanyl tRNA synthetase, causes severe infantile onset leukoencephalopathy. Am J Med Genet A. 2017 Sept;173(9):2505–2510. PubMed PMID: 28650581.
- Pravenec M, Zidek V, Landa V, et al. Mutant Wars2 gene in spontaneously hypertensive rats impairs brown adipose tissue function and predisposes to visceral obesity. Physiol Res. 2017 Dec 20;66(6):917–924. PubMed PMID: 29261326.
- The_GTEx_Consortium. Human genomics. The genotype-tissue expression (GTEx) pilot analysis: multitissue gene regulation in humans. Science. 2015 May 8;348(6235):648–660. PubMed PMID: 25954001; PubMed Central PMCID: PMCPMC4547484.
- Yamamoto Y, Gesta S, Lee KY, et al. Adipose depots possess unique developmental gene signatures. Obesity (Silver Spring). 2010 May;18(5):872–878. PubMed PMID: 20111017; PubMed Central PMCID: PMCPMC4377838.
- Kent WJ, Sugnet CW, Furey TS, et al. The human genome browser at UCSC. Genome Res. 2002 June;12(6):996–1006. PubMed PMID: 12045153; PubMed Central PMCID: PMCPMC186604.
- Ono N, Balani DH, Kronenberg HM. Stem and progenitor cells in skeletal development. Curr Top Dev Biol. 2019;133:1–24. PubMed PMID: 30902249; PubMed Central PMCID: PMCPMC6568007.
- Buniello A, MacArthur JAL, Cerezo M, et al. The NHGRI-EBI GWAS Catalog of published genome-wide association studies, targeted arrays and summary statistics 2019. Nucleic Acids Res. 2019 Jan 8;47(D1):D1005–D1012. PubMed PMID: 30445434; PubMed Central PMCID: PMCPMC6323933.
- Pulit SL, Stoneman C, Morris AP, et al. Meta-analysis of genome-wide association studies for body fat distribution in 694 649 individuals of European ancestry. Hum Mol Genet. 2019 Jan 1;28(1):166–174. PubMed PMID: 30239722; PubMed Central PMCID: PMCPMC6298238.
- Hnisz D, Abraham BJ, Lee TI, et al. Super-enhancers in the control of cell identity and disease. Cell. 2013 Nov 07;155(4):934–947. PubMed PMID: 24119843.
- Cirillo E, Kutmon M, Gonzalez Hernandez M, et al. From SNPs to pathways: biological interpretation of type 2 diabetes (T2DM) genome wide association study (GWAS) results. PloS One. 2018;13(4):e0193515. PubMed PMID: 29617380; PubMed Central PMCID: PMCPMC5884486.
- Muller CW, Herrmann BG. Crystallographic structure of the T domain-DNA complex of the Brachyury transcription factor. Nature. 1997 Oct 23;389(6653):884–888. PubMed PMID: 9349824.
- Prosdocimo DA, Sabeh MK, Jain MK. Kruppel-like factors in muscle health and disease. Trends Cardiovasc Med. 2015 May;25(4):278–287. PubMed PMID: 25528994; PubMed Central PMCID: PMCPMC4422160.
- Marouli E, Graff M, Medina-Gomez C, et al. Rare and low-frequency coding variants alter human adult height. Nature. 2017 Feb 9;542(7640):186–190. PubMed PMID: 28146470; PubMed Central PMCID: PMCPMC5302847.
- Matys V, Fricke E, Geffers R, et al. TRANSFAC: transcriptional regulation, from patterns to profiles. Nucleic Acids Res. 2003 Jan 1;31(1):374–378. PubMed PMID: 12520026; PubMed Central PMCID: PMCPMC165555.
- Ward LD, Kellis M. HaploReg: a resource for exploring chromatin states, conservation, and regulatory motif alterations within sets of genetically linked variants. Nucleic Acids Res. 2012 Jan;40(Database issue):D930–4. PubMed PMID: 22064851; PubMed Central PMCID: PMCPMC3245002.
- Kumar S, Ambrosini G, Bucher P. SNP2TFBS - a database of regulatory SNPs affecting predicted transcription factor binding site affinity. Nucleic Acids Res. 2017 Jan 4;45(D1):D139–D144. PubMed PMID: 27899579; PubMed Central PMCID: PMCPMC5210548.
- Khan A, Fornes O, Stigliani A, et al. JASPAR 2018: update of the open-access database of transcription factor binding profiles and its web framework. Nucleic Acids Res. 2018 Jan 4;46(D1):D260–D266. PubMed PMID: 29140473; PubMed Central PMCID: PMCPMC5753243.
- Gheorghe M, Sandve GK, Khan A, et al. A map of direct TF-DNA interactions in the human genome. Nucleic Acids Res. 2019 Feb 28;47(4):e21. PubMed PMID: 30517703; PubMed Central PMCID: PMCPMC6393237.
- Wang J, Zhuang J, Iyer S, et al. Factorbook.org: a Wiki-based database for transcription factor-binding data generated by the ENCODE consortium. Nucleic Acids Res. 2013 Jan;41(Database issue):D171–6. PubMed PMID: 23203885; PubMed Central PMCID: PMCPMC3531197.
- Giambartolomei C, Vukcevic D, Schadt EE, et al. Bayesian test for colocalisation between pairs of genetic association studies using summary statistics. PLoS Genet. 2014 May;10(5):e1004383. PubMed PMID: 24830394; PubMed Central PMCID: PMCPMC4022491.
- Pickrell JK, Berisa T, Liu JZ, et al. Detection and interpretation of shared genetic influences on 42 human traits. Nat Genet. 2016 July;48(7):709–717. PubMed PMID: 27182965; PubMed Central PMCID: PMCPMC5207801.
- Nissen-Meyer LS, Jemtland R, Gautvik VT, et al. Osteopenia, decreased bone formation and impaired osteoblast development in Sox4 heterozygous mice. J Cell Sci. 2007 Aug 15;120(Pt 16):2785–2795. PubMed PMID: 17652162.
- Franchini LF, Lopez-Leal R, Nasif S, et al. Convergent evolution of two mammalian neuronal enhancers by sequential exaptation of unrelated retroposons. Proc Natl Acad Sci U S A. 2011 Sept 13;108(37):15270–15275. PubMed PMID: 21876128.
- Machiela MJ, Chanock SJ. LDlink: a web-based application for exploring population-specific haplotype structure and linking correlated alleles of possible functional variants. Bioinformatics. 2015 Nov 1;31(21):3555–3557. PubMed PMID: 26139635; PubMed Central PMCID: PMCPMC4626747.
- Amano K, Hata K, Muramatsu S, et al. Arid5a cooperates with Sox9 to stimulate chondrocyte-specific transcription. Mol Biol Cell. 2011 Apr 15;22(8):1300–1311. PubMed PMID: 21346191; PubMed Central PMCID: PMCPMC3078073.
- Liu CT, Buchkovich ML, Winkler TW, et al. Multi-ethnic fine-mapping of 14 central adiposity loci. Hum Mol Genet. 2014 Sept 1;23(17):4738–4744. PubMed PMID: 24760767; PubMed Central PMCID: PMCPMC4119415.
- Pulit SL, Karaderi T, Lindgren CM. Sexual dimorphisms in genetic loci linked to body fat distribution. Biosci Rep. 2017 Feb 28;37(1):BSR20160184. PubMed PMID: 28073971; PubMed Central PMCID: PMCPMC5291139.
- Grossman SR, Zhang X, Wang L, et al. Systematic dissection of genomic features determining transcription factor binding and enhancer function. Proc Natl Acad Sci U S A. 2017 Feb 14;114(7):E1291–E1300. PubMed PMID: 28137873; PubMed Central PMCID: PMCPMC5321001.
- Ahluwalia TS, Troelsen JT, Balslev-Harder M, et al. Carriers of a VEGFA enhancer polymorphism selectively binding CHOP/DDIT3 are predisposed to increased circulating levels of thyroid-stimulating hormone. J Med Genet. 2017 Mar;54(3):166–175. PubMed PMID: 27627987.
- Kemp JP, Morris JA, Medina-Gomez C, et al. Identification of 153 new loci associated with heel bone mineral density and functional involvement of GPC6 in osteoporosis. Nat Genet. 2017 Oct;49(10):1468–1475. PubMed PMID: 28869591; PubMed Central PMCID: PMCPMC5621629.
- Chinenov Y, Kerppola TK. Close encounters of many kinds: Fos-Jun interactions that mediate transcription regulatory specificity. Oncogene. 2001 Apr 30;20(19):2438–2452. PubMed PMID: 11402339.
- Kichaev G, Roytman M, Johnson R, et al. Improved methods for multi-trait fine mapping of pleiotropic risk loci. Bioinformatics. 2017 Jan 15;33(2):248–255. PubMed PMID: 27663501; PubMed Central PMCID: PMCPMC5254076.
- Boyle AP, Davis S, Shulha HP, et al. High-resolution mapping and characterization of open chromatin across the genome. Cell. 2008 Jan 25;132(2):311–322. PubMed PMID: 18243105; PubMed Central PMCID: PMCPMC2669738.
- Farin HF, Bussen M, Schmidt MK, et al. Transcriptional repression by the T-box proteins Tbx18 and Tbx15 depends on Groucho corepressors. J Biol Chem. 2007 Aug 31;282(35):25748–25759. PubMed PMID: 17584735.
- Kim SK. Identification of 613 new loci associated with heel bone mineral density and a polygenic risk score for bone mineral density, osteoporosis and fracture. PloS One. 2018;137:e0200785. PubMed PMID: 30048462; PubMed Central PMCID: PMCPMC6062019.
- Wehn AK, Chapman DL. Tbx18 and Tbx15 null-like phenotypes in mouse embryos expressing Tbx6 in somitic and lateral plate mesoderm. Dev Biol. 2010 Nov 15;347(2):404–413. PubMed PMID: 20832395.
- Lee KY, Sharma R, Gase G, et al. Tbx15 defines a glycolytic subpopulation and white adipocyte heterogeneity. Diabetes. 2017 Nov;66(11):2822–2829. PubMed PMID: 28847884; PubMed Central PMCID: PMCPMC5652605.
- Racimo F, Gokhman D, Fumagalli M, et al. Archaic Adaptive Introgression in TBX15/WARS2. Mol Biol Evol. 2017 Mar 1;34(3):509–524. PubMed PMID: 28007980; PubMed Central PMCID: PMCPMC5430617.
- Zhou J, Wang S, Qi Q, et al. Nuclear factor I-C reciprocally regulates adipocyte and osteoblast differentiation via control of canonical Wnt signaling. Faseb J. 2017 May;31(5):1939–1952. PubMed PMID: 28122918.
- Zhang Y, Fukui N, Yahata M, et al. Identification of DNA methylation changes associated with disease progression in subchondral bone with site-matched cartilage in knee osteoarthritis. Sci Rep. 2016 Sept 30;6:34460. PubMed PMID: 27686527; PubMed Central PMCID: PMCPMC5043275.
- Gesta S, Bluher M, Yamamoto Y, et al. Evidence for a role of developmental genes in the origin of obesity and body fat distribution. Proc Natl Acad Sci U S A. 2006 Apr 25;103(17):6676–6681. PubMed PMID: 16617105; PubMed Central PMCID: PMCPMC1458940.
- Sun W, Zhao X, Wang Z, et al. Tbx15 is required for adipocyte browning induced by adrenergic signaling pathway. Mol Metab. 2019 July 5;28:48–57. PubMed PMID: 31352005.
- Papaioannou VE. The T-box gene family: emerging roles in development, stem cells and cancer. Development. 2014 Oct;141(20):3819–3833. PubMed PMID: 25294936; PubMed Central PMCID: PMCPMC4197708.
- Ju L, Zhang X, Deng Y, et al. Enhanced expression of Survivin has distinct roles in adipocyte homeostasis. Cell Death Dis. 2017 Jan 5;8(1):e2533. PubMed PMID: 28055005; PubMed Central PMCID: PMCPMC5386358.
- Oh E, Jeong HM, Kwon MJ, et al. Unforeseen clonal evolution of tumor cell population in recurrent and metastatic dermatofibrosarcoma protuberans. PloS One. 2017;12(10):e0185826. PubMed PMID: 28977029; PubMed Central PMCID: PMCPMC5627939.
- Genomes Project C, Auton A, Brooks LD, et al. A global reference for human genetic variation. Nature. 2015 Oct 1;526(7571):68–74. PubMed PMID: 26432245; PubMed Central PMCID: PMCPMC4750478.
- Purcell S, Neale B, Todd-Brown K, et al. PLINK: a tool set for whole-genome association and population-based linkage analyses. Am J Hum Genet. 2007 Sept;81(3):559–575. PubMed PMID: 17701901; PubMed Central PMCID: PMCPMC1950838.
- Myers RM, Stamatoyannopoulos J, Snyder M, et al. A user’s guide to the encyclopedia of DNA elements (ENCODE). PLoS Biol. 2011 Apr;9(4):e1001046. PubMed PMID: 21526222.
- Togninalli M, Roqueiro D, Investigators CO, et al. Accurate and adaptive imputation of summary statistics in mixed-ethnicity cohorts. Bioinformatics. 2018 Sept 1;34(17):i687–i696. PubMed PMID: 30423082; PubMed Central PMCID: PMCPMC6129295.