
 ?Mathematical formulae have been encoded as MathML and are displayed in this HTML version using MathJax in order to improve their display. Uncheck the box to turn MathJax off. This feature requires Javascript. Click on a formula to zoom.
ABSTRACT
Translocations of the KMT2A (MLL) gene define a biologically distinct and clinically aggressive subtype of acute myeloid leukaemia (AML), marked by a characteristic gene expression profile and few cooperating mutations. Although dysregulation of the epigenetic landscape in this leukaemia is particularly interesting given the low mutation frequency, its comprehensive analysis using whole genome bisulphite sequencing (WGBS) has not been previously performed. Here we investigated epigenetic dysregulation in nine MLL-rearranged (MLL-r) AML samples by comparing them to six normal myeloid controls, using a computational method that encapsulates mean DNA methylation measurements along with analyses of methylation stochasticity. We discovered a dramatically altered epigenetic profile in MLL-r AML, associated with genome-wide hypomethylation and a markedly increased DNA methylation entropy reflecting an increasingly disordered epigenome. Methylation discordance mapped to key genes and regulatory elements that included bivalent promoters and active enhancers. Genes associated with significant changes in methylation stochasticity recapitulated known MLL-r AML expression signatures, suggesting a role for the altered epigenetic landscape in the transcriptional programme initiated by MLL translocations. Accordingly, we established statistically significant associations between discordances in methylation stochasticity and gene expression in MLL-r AML, thus providing a link between the altered epigenetic landscape and the phenotype.
Introduction
Acute myeloid leukaemia (AML) is a haematopoietic malignancy characterized by uncontrolled clonal proliferation of myeloid cells with aberrant differentiation, driven by a variety of mutations, translocations, and epigenetic alterations [Citation1]. Translocations of the MLL gene (mixed lineage leukaemia, also known as KMT2A, which encodes a histone H3 lysine 4 methyltransferase) give rise to a biologically distinct and clinically aggressive subtype of AML, generally associated with poor therapy response [Citation2]. MLL fusions occur with numerous translocation partners and comprise a remarkably potent oncogenic event that requires very few cooperating mutations to generate leukaemia [Citation3]. Indeed, MLL-rearranged AML (MLL-r AML) has an exceptionally low mutation rate, with the lowest frequency of genetic mutations of any AML subtype and among the lowest of any cancer [Citation4]. Moreover, transformation by MLL fusions is related to altered transcriptional regulation, with a distinct gene expression signature marked by upregulation of HOXA cluster genes and activation of self-renewal and stem-cell like programmes [Citation5,Citation6]. Therefore, an understanding of the epigenetic landscape linking MLL translocation to the resultant transcriptional programme is essential to the development of targeted therapeutic strategies in this disease.
Recent work suggests that studies investigating stable epigenetic signatures or mean changes in epigenetic marks do not completely capture the epigenetic heterogeneity/variability intrinsic to AML [Citation7]. A recent examination of chromatin accessibility in AML found that the variance of distal regulatory element accessibility increased through progressive stages of leukaemia evolution, with epigenomic diversity that was independent from genetic heterogeneity [Citation8]. In addition, the kinetics of epigenetic and genetic heterogeneity during AML progression have been recently investigated using enhanced reduced representation bisulphite sequencing (ERRBS) in combination with whole exome sequencing [Citation9]. It was found that a metric of epigenetic heterogeneity based on epiallelic shifting (i.e., a statistically significant change in cytosine methylation variability over four consecutive CpG dinucleotides) was associated with shorter time to relapse, while somatic mutation burden was not. Moreover, it was shown that epiallelic shifts at gene promoters may be related to increased single-cell transcriptional variance and differential expression. These results highlight the functional and clinical relevance of epigenetic heterogeneity in AML and its distinct nature from genetic changes, and imply that mechanisms of epigenetic disruption may be opaque to studies focusing on mean epigenetic differences.
Here we sought to characterize the DNA methylation landscape in MLL-rearranged AML and normal controls using methods that encapsulate underlying epigenetic variability. We employed informME, a powerful tool for quantifying epigenetic variability by comprehensively computing DNA methylation potential energy landscapes (PELs) across the genome [Citation10,Citation11]. By treating the methylation sequencing reads as linear strings of binary information, informME computes methylation PELs within a genomic region of interest directly from WGBS data at ordinary fold coverage. Each PEL is then used to fully characterize DNA methylation within the respective region, capturing both mean methylation and methylation variability (stochasticity) using Shannon’s entropy. This method permits identification of regions of significant discordance in DNA methylation by using the Jensen-Shannon (JSD) distance of information theory, which evaluates distances between probability distributions of methylation, rather than by performing conventional differentially methylated region (DMR) identification based exclusively on mean methylation differences.
Whole-genome bisulphite sequencing (WGBS) of MLL-r AML has not been previously reported. Here we applied a comprehensive genome-wide, entropy-sensitive epigenomic landscape analysis to 9 primary MLL-r AML samples and 6 appropriate normal controls and found a dramatically altered epigenetic landscape in MLL-r AML, with epigenetic disruption mapping to key genes and regulatory regions. These alterations were associated with genome-wide hypomethylation and gains in DNA methylation entropy, reflecting an increasingly disordered epigenome. We then analysed the observed discordance in methylation stochasticity to identify genes with dysregulated methylation. We finally investigated the relevance of these genes to altered gene expression in MLL-r AML, concluding that DNA methylation alterations underlie the gene expression signature of MLL-r AML.
Results
Methylation PEL analysis reveals considerable epigenetic stochasticity in MLL-r AML
We carried out WGBS on 9 primary patient MLL-r AML samples, with clinical characteristics described in Table S1. For normal controls, we carried out WGBS on normal haematopoietic stem cells (HSC), lymphoid-primed multipotent progenitor (L-MPP) cells, and granulocyte/macrophage progenitor (GMP) cells and utilized existing WGBS data obtained from three distinct biological replicates of CD34+ haematopoietic stem and progenitor cells (HSPCs) (Table S2). By employing these data, we computed DNA methylation PELs using informME, which enabled us to derive a detailed probabilistic profiling of variability in methylation levels and quantify methylation stochasticity genome-wide using Shannon’s entropy. We accomplished this task by partitioning the genome into consecutive non-overlapping 3-kb regions and by estimating methylation PELs for each region using a maximum-likelihood approach that combined the full information available in multiple methylation reads, including correlations among the methylation states at contiguous CpG dinucleotides. After computing methylation PELs, we further partitioned each 3-kb estimation region into consecutive non-overlapping analysis regions of size 150 bp each. We then derived, within each analysis region, the probability distribution of the methylation level (i.e., average methylation) from which we evaluated the mean methylation level (MML) and the normalized methylation entropy (NME). The MML quantifies the expected magnitude of DNA methylation within an analysis region. It takes values between 0 and 1, with 0 indicating a fully unmethylated analysis region and 1 indicating a fully methylated region. On the other hand, the NME is a normalized version of Shannon’s entropy of the methylation level and, as such, it properly quantifies methylation stochasticity (disorder) within an analysis region. It also takes values between 0 and 1, with 0 indicating a methylation level that is always observed (perfectly ordered methylation) and 1 indicating that the methylation levels within an analysis region are equally likely (fully stochastic methylation). We finally assessed methylation sensitivity to epigenetic changes by computing a methylation sensitivity index (MSI), which we used to quantify the ease with which the epigenome can regulate the methylation potential energy landscape.
Computed genome-wide distributions of mean methylation level (), left) and normalized methylation entropy (), middle) in the MLL-r AML and normal samples revealed significant global hypomethylation in AML and a significant global increase in methylation stochasticity (p-values < ; effect sizes: pseudo-median MML =
, pseudo-median NME =
; Wilcoxon signed-rank test) when compared to normal. Moreover, genome-wide distributions of the methylation sensitivity index demonstrated a moderate but significant (p-value <
; effect size: pseudo median MSI =
, Wilcoxon signed-rank test) loss of methylation sensitivity in AML (), right), indicating an overall reduction in the ability of the epigenome to regulate the methylation potential energy landscape. By evaluating a representative MLL-r AML case and by comparing it to a normal CD34 sample, we found a substantial shift of MML towards hypomethylation in AML, a dramatic increase in methylation entropy, and a shift of methylation sensitivity towards smaller values ()). This was a consistent finding in all AML samples examined, as shown for MML (Figure S1(a)), NME (Figure S1(b)), and MSI (Figure S1(c)). We also considered the relationship of methylation entropy to distance from transcription start sites (TSS). We observed consistent loss of mean methylation level and gain in methylation entropy in MLL-r AML, although both AML and normal cells showed a relatively ordered methylation profile around the TSS ()). Moreover, although all cell types exhibited a relatively high methylation sensitivity around the TSS, with MLL-r AML gaining or losing sensitivity when compared to normal, AML cells were subject to a consistent loss of methylation sensitivity away from the TSS ()).
Figure 1. Distributions of the DNA methylation state in MLL-r AML and normal controls.
(a) Boxplots of genome-wide distributions of mean methylation level (MML), normalized methylation entropy (NME), and methylation sensitivity index (MSI) values in 9 MLL-r AML and 6 normal control samples. Centre line, median; box, interquartile range (IQR); whiskers, 1.5 IQR. Median differences between AML and normal were statistically evaluated using the Wilcoxon signed-rank test with p-values (p) and effect sizes (e) as shown. (b) Densities of genome-wide distributions of MML, NME, and MSI values in a representative MLL-r AML sample (AML-2) versus a CD34 sample (CD34-1). (c) Aggregate (mean) MML, NME, and MSI values in all MLL-r AML and normal control samples at CpG sites within promoter regions (
2-kb from TSS). (d) First two coordinates of the multidimensional scaling (MDS) representation of the MLL-r AML and normal control samples based on a dissimilarity measure using the average Jensen-Shannon distances (JSDs) between the probability distributions of mean methylation levels within analysis regions in chromosome 1 computed from each AML/normal comparison.
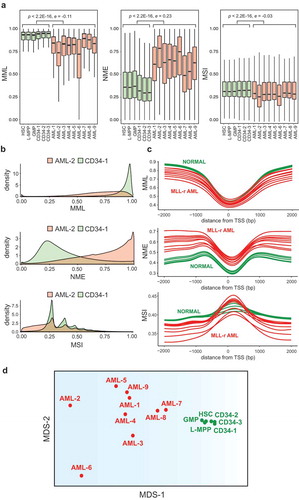
We also assessed similarity (or dissimilarity) between pairs of AML/normal samples in terms of their stochastic methylation profiles. We did so by computing, for each pair of samples and each analysis region, the Jensen-Shannon distance (JSD) between the probability distributions of the methylation level, a normalized information-theoretic distance metric taking values between 0 and 1 that encapsulates dissimilarities between two probability distributions driven by mean differences, entropy differences, or any other factor [Citation10,Citation11]. By visualizing in two-dimensions the pairwise distance information based on JSD using multidimensional scaling (MDS), we produced a tight cluster for all normal samples and a loose cluster for the MLL-r AML samples, which were well separated from the normal samples, demonstrating a highly heterogeneous methylation profile in the AML samples ()). Taken together, these results suggest that MLL-r AML is subject to a global shift in the statistical properties of the epigenome, relative to normal controls, towards increased methylation stochasticity and epigenetic heterogeneity, associated with a global reduction in methylation levels, gains in methylation entropy, and loss of methylation sensitivity.
Differential PEL analysis reveals DNA methylation stochasticity discordance in MLL-r AML localizing to key regulatory regions of the genome
We also examined discordance in methylation stochasticity over selected genomic features using the Jensen-Shannon distance (JSD) between the probability distributions of methylation levels in test (AML) and reference (normal) samples, as well as differences in mean methylation level (dMML), normalized methylation entropy (dNME), and methylation sensitivity (dMSI). Here we only used the three CD34 samples as normal controls due to the availability of multiple replicates of the same cell type for facilitating our differential statistical analysis. By evaluating the dMML, dNME, and dMSI values between all 9 MLL-r AML cases and the normal CD34 samples, we observed considerable discordance over features related to CpG islands (CGIs) and genes, as quantified by the JSD ()), which was consistently associated with hypomethylation and gain in methylation entropy (increased methylation stochasticity) in MLL-r AML. We found differences in mean methylation level and methylation entropy to be less pronounced over CGIs than over other genomic features, indicating the importance of considering DNA methylation at locations other than CGIs in AML. Notably, evaluation of methylation sensitivity showed both losses and gains locally occurring at targeted regions in MLL-r AML, with a more pronounced sensitivity gain over CGIs when compared to other features ()).
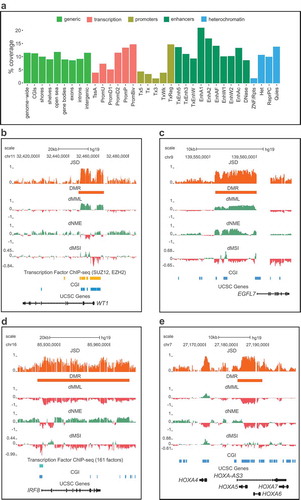
Figure 2. Quantifying discordance of methylation stochasticity in MLL-r AML.
(a) Boxplots of distributions of Jensen-Shannon distance (JSD), differential mean methylation level (dMML), differential normalized methylation entropy (dNME), and differential methylation sensitivity (dMSI) values observed in all MLL-r AML/normal CD34 comparisons genome-wide, and within CpG islands (CGIs), island shores, shelves, open sea, gene bodies, exons, introns, and intergenic regions. Centre line, median; box, interquartile range (IQR); whiskers, 1.5 IQR. (b) Boxplots of distributions of JSD, dMML, dNME, and dMSI values observed in all MLL-r AML/normal CD34 comparisons within 25 ChromHMM genomic annotations [Citation12] of normal haematopoietic stem and progenitor cells. Centre line, median; box, interquartile range (IQR); whiskers, 1.5
IQR. p-values and effect sizes (Wilcoxon rank-signed test) are provided in Tables S3B-S3E. (c) Aggregate (mean) MML, NME, and MSI values in all MLL-r AML and normal control samples at CpG sites within active enhancer 1 (EnhA1) and bivalent promoter (PromBiv) regions (
4-kb).
![Figure 2. Quantifying discordance of methylation stochasticity in MLL-r AML.(a) Boxplots of distributions of Jensen-Shannon distance (JSD), differential mean methylation level (dMML), differential normalized methylation entropy (dNME), and differential methylation sensitivity (dMSI) values observed in all MLL-r AML/normal CD34 comparisons genome-wide, and within CpG islands (CGIs), island shores, shelves, open sea, gene bodies, exons, introns, and intergenic regions. Centre line, median; box, interquartile range (IQR); whiskers, 1.5 × IQR. (b) Boxplots of distributions of JSD, dMML, dNME, and dMSI values observed in all MLL-r AML/normal CD34 comparisons within 25 ChromHMM genomic annotations [Citation12] of normal haematopoietic stem and progenitor cells. Centre line, median; box, interquartile range (IQR); whiskers, 1.5 × IQR. p-values and effect sizes (Wilcoxon rank-signed test) are provided in Tables S3B-S3E. (c) Aggregate (mean) MML, NME, and MSI values in all MLL-r AML and normal control samples at CpG sites within active enhancer 1 (EnhA1) and bivalent promoter (PromBiv) regions (±4-kb).](/cms/asset/b4b97720-3e4e-4506-a01e-5cad4d934aba/kepi_a_1734149_f0002_c.jpg)
We also compared methylation in MLL-r AML and normal controls over specific classes of promoters, enhancers, transcription regulatory regions, and heterochromatin, by employing available ChromHMM annotations of chromatin state and functional DNA elements in normal CD34+ cells [Citation12]. Consistent with the genome-wide trend, most features exhibited hypomethylation in MLL-r AML, with a notable exception being the bivalent promoters in CD34+ (PromBiv), which also showed hypermethylation in MLL-r AML relative to normal CD34+ ()). Methylation entropy increased over most features, most prominently over acetylation only enhancers (EnhAC) and quiescent chromatin (Quies), as well as over heterochromatin (Het) and over features associated with transcription (Tx5ʹ, Tx, Tx3ʹ, TxWk) and their associated enhancers (TxEnh5ʹ, TxEnh3ʹ, TxEnhW) ()). Despite this trend, methylation entropy also decreased over subsets of transcription regulatory (TxReg), active enhancer (EnhA1, EnhA2), weak enhancer (EnhW1), and promoter (PromU, PromD1) regions, indicating loss of methylation entropy in MLL-r AML over particular regulatory elements as compared to CD34+ ()). Finally, methylation sensitivity mostly increased over subsets associated with promoters (TssA, PromU, PromD1, PromBiv), transcription (Tx5ʹ, Tx, Tx3ʹ, TxWk), and zinc-finger genes and repeats (ZNF/Rpts), and mostly decreased over the remaining regions ()).
We also summarized discordance in methylation stochasticity for the MLL-r AML group by using all AML/CD34 sample pairs and by averaging all computed JSD values within each analysis region in order to obtain a single consensus JSD. We calculated the median of all consensus JSDs within analysis regions that overlap a particular ChromHMM annotation and found that bivalent promoters (PromBiv), active enhancers 1 (EnhA1), transcription regulatory (TxReg) regions, active enhancers 2 (EnhA2), promoters downstream TSSs (PromD2), poised promoters (PromP), and weak enhancers (EnhW1) were the annotations exhibiting the most median discordance in methylation stochasticity (Table S3A). We also used the Wilcoxon signed-rank test to test against the null hypothesis that the methylation state within a particular ChromHMM annotation is equally likely to be hypomethylated or hypermethylated, and found this not to be the case (p-value , Table S3B), therefore statistically verifying the significance of our previous findings regarding mean methylation discordance in MLL-r AML. Notably, when investigating methylation stochasticity within active enhancers 1 (EnhA1), we observed consistent loss of mean methylation level, gain in methylation entropy, and loss in methylation sensitivity (), left column). However, epigenetic discordance over EnhA1 in MLL-r AML as compared to our normal controls was primarily characterized by further hypomethylation and decreased methylation sensitivity at EnhA1 elements. In contrast, bivalent promoters (PromBiv) exhibited persistent gains of methylation entropy in MLL-r AML, although they did not demonstrate consistent changes in mean methylation level (), right column). Moreover, MLL-r AML showed noticeable loss in methylation sensitivity as compared to the normal controls, but only at surrounding regions (), right column).
Overall, these results, together with similar results obtained for the normalized methylation entropy, methylation sensitivity index, and JSD (Tables S3C, S3D, S3E), point to significant differences in the epigenetic profile of MLL-r AML when compared to normal controls, localized at key regulatory regions of the genome with potential for dysregulating gene expression in AML.
Discordance in methylation stochasticity identifies dysregulated genes and regulatory regions in MLL-r AML
Given that MLL-r AML is associated with extensive discordance in DNA methylation stochasticity, we focused next on identifying genomic targets of epigenetic disruption in this disease. First, we sought to rank genes based on the ability of their methylation states within defined gene features (promoter regions and gene bodies) to distinguish between the MLL-r AML and normal phenotypes. We did so by using the mutual information between the methylation state and the phenotype within a gene feature, computed as the average of the sum of squares of all JSD values within analysis regions that overlap the gene feature [Citation13], which revealed how much information the methylation state within the feature carried about the phenotype. By using this approach, together with a previously developed method for hypothesis testing [Citation13], we ranked genes based on the amount of mutual information observed within their promoter regions and/or bodies (Table S4). We then identified the most epigenetically informative genes and evaluated for enrichments among the top 1000 genes that exhibited the highest amount of mutual information between their methylation state and the phenotype using Gene Set Enrichment Analysis (GSEA) [Citation14,Citation15]. Top GSEA enrichments included multiple gene sets related to polycomb repressive complex 2 (PRC2) gene targets (SUZ12 targets, EED targets, genes possessing H3K27me3 marks in embryonic stem cells), as well as additional gene sets related to myeloid development, leukaemic stem cells, and acute myeloid leukaemia (Table S5). Strikingly, GSEA analysis revealed enrichment in ‘MLL signature 1’ and ‘MLL signature 2’ (Table S5A), two sets of genes up-regulated in paediatric AML with MLL rearrangements that were previously defined as MLL-r AML gene expression signatures, suggesting that DNA methylation and gene expression may be related in this type of AML.
Because discordance in DNA methylation stochasticity may map to regulatory regions other than promoter regions and gene bodies, we also performed an unbiased genome-wide analysis of our WGBS data to identify genomic regions exhibiting statistically significant epigenetic alterations. We detected differentially methylated regions (DMRs) independent of their annotation by identifying statistically significant discordances between the probability distributions of methylation levels in AML/normal comparisons based on the JSD [Citation11]. On the average, we found about 12% of all analysis regions in our MLL-r AML samples to be associated with DMRs when compared to CD34-1, which were localized within important regulatory regions ()), in agreement with our previous results (Table S3A).
Figure 3. Discordance of DNA methylation stochasticity localizes to key regulatory regions and genes.
An example of a DMR characterized by significant discordance of methylation stochasticity in MLL-r AML was found to overlap CGIs at the promoter region of the WT1 gene ()). This is evident by the high JSD values observed within this DMR, notably overlapping with binding sites for the two PRC2 components EZH2 and SUZ12, which are associated with focal hypermethylation and localized losses or gains in methylation entropy and methylation sensitivity. Similarly, we identified a DMR overlapping a CGI within the promoter region of EGFL7 ()), which exhibited near-maximal JSD values driven by hypermethylation, markedly increased DNA methylation entropy, and loss of methylation sensitivity. Interestingly, EGFL7 has been implicated in haematopoiesis and AML pathogenesis as a regulator of miR-126 with the methylation state at its promoter regulating miR-126 expression [Citation6,Citation16]. An example of a DMR spanning a gene body is shown for the IRF8 gene ()). In contrast to the previous examples, this DMR exhibits consistent hypomethylation and decreased methylation sensitivity, but increased methylation entropy. Notably, discordance in methylation stochasticity at a transcription factor binding site overlapping a CGI at the promoter of this gene exhibited no noticeable change in mean methylation level but a marked loss in methylation entropy, demonstrating that epigenetic dysregulation may facilitate itself as changes in higher-order statistical quantities, such as entropy, and not necessarily by changes in the mean. Finally, we observed significant differential methylation within a region of chromosome 7 containing the cluster of HOXA genes ()), which is of particular interest to MLL-r AML, since differential expression of these genes is known to be a key feature in AML [Citation5,Citation6].
To analyse the functional significance of JSD-based DMRs obtained in a specific AML/normal comparison, we utilized the Genomic Regions Enrichment of Annotations Tool (GREAT) to associate DMRs with genes and identify enrichments across multiple ontologies and gene sets [Citation17]. We applied GREAT to our data set and found enrichments of the two MLL-r AML gene expression signature sets ‘MLL signature 1’ and ‘MLL signature 2’ at the top of the Molecular Signatures Database (MSigDB) Perturbation Ontology in 5/9 AML/CD34-1 comparisons, as well as Oncogenic Signature enrichments for genes regulated by HOXA9 in AML cell lines, and genes annotated to murine phenotypes related to abnormal leukocyte physiology and cell numbers (Table S6). These data collectively support the notion that discordance in methylation stochasticity is linked to important regulatory regions of the genome and that stochastic epigenetic burden within these regions may be highly relevant for gene expression alterations in this type of AML.
DNA methylation relates to gene expression in MLL-r AML
Since our analysis suggested a potential association between stochastic methylation discordance and gene expression in MLL-r AML, we next sought to evaluate this possibility using previously published RNA-seq data from 31 MLL fusion AML and 17 normal CD34+ samples [Citation6,Citation18]. We first performed differential gene expression analysis and classified genes into three groups: significantly upregulated (UR), significantly downregulated (DR), and genes demonstrating no significant differential expression (ND). We then associated each gene with three measures of methylation discordance within their promoter regions, which we computed by comparing each MLL-r AML sample to CD34-1: the average Jensen-Shannon distance (JSD), the average difference in methylation level (dMML), and the average difference in normalized methylation entropy (dNME). We finally used Kruskal-Wallis-Dunn tests to statistically identify whether higher promoter JSD values are observed in a gene expression group than in another group, and conducted a similar analysis for promoter dMML and dNME values (Table S7).
Higher promoter JSD values were more likely to be observed in the group of upregulated genes than in the group of non-differentially expressed genes in 8/9 comparisons (6 statistically significant, p-values 1.53
, max effect size 6.92%), and similarly when comparing to the group of downregulated genes (6/9 comparisons, all statistically significant, p-values
1.02
, max effect size 7.83%) (Table S7), suggesting that higher stochastic methylation discordance is more likely to be found within the promoters of upregulated genes in our comparisons than within the promoters of non-differentially expressed and downregulated genes.
In terms of differential methylation level, higher promoter dMML values were more likely to be observed in the group of non-differentially expressed genes than in the group of upregulated genes in all 9 comparisons (7 statistically significant, p-values 2.80
, max effect size 12.79%), whereas higher values were more likely to be observed in the group of downregulated genes than in the group of non-differentially expressed genes in 8/9 comparisons (all statistically significant, p-values
4.77
, max effect size 9.83%), and similarly when comparing downregulated and upregulated genes (all statistically significant, p-values
4.57
, max effect size 22.16%) (Table S7). Therefore, it is more likely to find lower differences in mean methylation level within the promoters of upregulated genes in our comparisons than within the promoters of non-differentially expressed genes and higher differences in mean methylation level within the promoters of downregulated genes than within the promoters of non-differentially expressed genes and upregulated genes. This is consistent with the premise that promoter hypermethylation reduces gene expression in general, whereas promoter hypomethylation generally enhances gene expression.
Finally, higher promoter dNME values were more likely to be observed in the group of downregulated genes than in the group of non-differentially expressed genes in all 9 comparisons (all statistically significant, p-values 2.01
, max effect size 6.77%), whereas, higher promoter dNME values were more likely to be found in the group of non-differentially expressed genes than in the group of upregulated genes in all 9 comparisons (all statistically significant, p-values
2.06
, max effect size 12.89%), and similarly when comparing downregulated and upregulated genes (9/9 statistically significant, p-value
4.34
, max effect size 19.46%) (Table S7). This suggests that reduced gene expression is associated with higher methylation stochasticity within the promoter regions of some genes, whereas enhanced gene expression is associated with lower methylation stochasticity.
Given that the promoter regions of upregulated genes in our data were found to be more likely associated with higher methylation discordance than the promoter regions of non-differentially expressed genes and downregulated genes, we sought to further investigate this association by focusing on genes whose promoter regions were subject to statistically significant discordance in methylation stochasticity, as quantified by the JSD. A genomic region located on chromosome band 15q13.1 was recently identified as potentially being functionally important in MLL-r AML, since it was found to contain the most differentially expressed genes in MLL-r AML when compared to other AML subtypes, including LOC100289656, identified as the most specific transcript for MLL-r AML and a potentially useful biomarker for this disease [Citation6]. Our methylation analysis demonstrated that the 15q13.1 band contains DMRs with statistically significant JSD values, associated with consistent hypomethylation and overall gain of methylation entropy in MLL-r AML when compared to CD34-1 ()). As expected, LOC100289656 was over-expressed in MLL-r AML as compared to normal CD34+ cells ()), suggesting an association between statistically significant discordance in methylation stochasticity and gene expression in MLL-r AML. We also found LOC100289656 to be one of the most epigenetically informative genes, based on its statistical significance in exhibiting differential DNA methylation discordance (Table S4), demonstrating that its methylation state conveys substantial information about the phenotype (AML/normal) and further corroborating its biomarker status. Interestingly, loss of methylation entropy and methylation sensitivity was locally observed within LOC100289656 ()), suggesting increased commitment to its hypomethylation and overexpression and a reduced ability of the epigenome to regulate its methylation state in MLL-r AML.
Figure 4. DNA methylation relates to gene expression in MLL-r AML.
(a) UCSC genome browser image of the 15q13.1 chromosomal band previously found to contain the most differentially expressed genes in MLL-r AML, including LOC100289656, a suggested MLL-r AML biomarker [Citation6]. The image shows the Jensen-Shannon distance (JSD) values and computed differential methylated regions (DMRs) of statistically significant JSDs, as well values of the differential mean methylation level (dMML), the differential normalized methylation entropy (dNME), and the differential methylation sensitivity index (dMSI). (b) Gene expression of LOC100289656 in normal CD34 () and MLL-r AML (
) cell populations, showing its upregulation in MLL-r AML. (c) UCSC genome browser image of a genomic region containing GATA2. The image shows the JSD values along the genome and a computed DMR of statistically significant JSDs, as well associated dMML, dNME, and dMSI values. (d) Gene expression of GATA2 in normal CD34 (
) and MLL-r AML (
) cell populations, showing its downregulation in MLL-r AML. (e) Boxplots of distributions of absolute log-fold changes in the expression of differentially methylated genes (DMGs) and non-DMGs in all MLL-r AML to CD34-1 comparisons. Centre line, median; box, interquartile range (IQR); whiskers, 1.5
IQR. Few outliers above 15 are not shown for legibility. Differences in absolute log-fold expression changes between DMGs and non-DMGs were statistically evaluated using Wilcoxon rank-sum tests with p-values (p) and effect sizes (e) as shown.
![Figure 4. DNA methylation relates to gene expression in MLL-r AML.(a) UCSC genome browser image of the 15q13.1 chromosomal band previously found to contain the most differentially expressed genes in MLL-r AML, including LOC100289656, a suggested MLL-r AML biomarker [Citation6]. The image shows the Jensen-Shannon distance (JSD) values and computed differential methylated regions (DMRs) of statistically significant JSDs, as well values of the differential mean methylation level (dMML), the differential normalized methylation entropy (dNME), and the differential methylation sensitivity index (dMSI). (b) Gene expression of LOC100289656 in normal CD34 (n=17) and MLL-r AML (n=31) cell populations, showing its upregulation in MLL-r AML. (c) UCSC genome browser image of a genomic region containing GATA2. The image shows the JSD values along the genome and a computed DMR of statistically significant JSDs, as well associated dMML, dNME, and dMSI values. (d) Gene expression of GATA2 in normal CD34 (n=17) and MLL-r AML (n=31) cell populations, showing its downregulation in MLL-r AML. (e) Boxplots of distributions of absolute log-fold changes in the expression of differentially methylated genes (DMGs) and non-DMGs in all MLL-r AML to CD34-1 comparisons. Centre line, median; box, interquartile range (IQR); whiskers, 1.5 × IQR. Few outliers above 15 are not shown for legibility. Differences in absolute log-fold expression changes between DMGs and non-DMGs were statistically evaluated using Wilcoxon rank-sum tests with p-values (p) and effect sizes (e) as shown.](/cms/asset/cbbd4da0-646c-446e-805a-92df51fbd9fb/kepi_a_1734149_f0004_c.jpg)
GATA2 is another gene of interest whose product is a transcription factor that plays a vital role in the proliferation of haematopoietic stem cells and germline mutations that have been associated with familial myelodysplastic syndrome and AML [Citation19]. We found a DMR with significant JSD values overlapping this gene, which was associated with consistent hypermethylation, increased methylation entropy, and focally altered methylation sensitivity in MLL-r AML when compared to normal CD34-1 ()). Moreover, GATA2 was under-expressed in MLL-r AML ()), suggesting again an association between statistically significant discordance in methylation stochasticity and gene expression in MLL-r AML.
To further investigate the importance of these findings, we identified differentially methylated genes (DMGs) for each MLL-r AML/CD34-1 comparison, as those genes whose promoter regions overlap with a JSD-based DMR. We then conducted a ‘test of proportion’ to test the null hypothesis that the proportion of differentially expressed genes (DEGs) among DMGs equals the proportion of DEGs among non-DMGs, against the alternative hypothesis that the proportion of DEGs among DMGs is greater than the proportion of DEGs among non-DMGs (Table S8A). We found the proportion of DEGs in the set of DMGs to be consistently larger than in the set of non-DMGs in 8/9 comparisons, with 7 of them showing statistical significance (p-value ), suggesting that genes in the DMG set are more likely to be differentially expressed. We then used a Wilcoxon rank-sum test to determine whether the absolute log-fold changes associated with the DMGs were statistically different from the ones associated with the non-DMGs and found that it is more likely to observe higher log-fold changes in gene expression within the DMG group than within the non-DMG group in all MLL-r AML/CD34-1 comparisons, with 8/9 comparisons showing statistical significance (p-value
5.33
) and substantial effect sizes (min 23%, max 95%) (), Table S8B). Taken together, and in contrast to DNMT3A-mutant AML [Citation20], the present findings strongly point to a significant association between DNA methylation and gene expression in MLL-AML.
Discussion
Stochastic epigenetic variability can serve as a driving force in tumour evolution, allowing for the selection of cellular traits that promote survival in a changing environment [Citation9,Citation21–Citation23]. Past work across haematopoietic malignancies has pointed to clinical significance of stochastically disordered DNA methylation. For example, analysis of chronic lymphocytic leukaemia (CLL) has demonstrated a high degree of DNA methylation heterogeneity in this disease resulting from stochastic variation in methylation patterns, which was importantly associated with inferior clinical outcome [Citation24]. Similarly, ERRBS analysis in diffuse large B-cell lymphoma has demonstrated that increasingly disordered DNA methylation could be associated with shorter time to relapse [Citation25].
Epigenetic variability has been implicated in AML as well. Analysis of chromatin accessibility in AML found increased variance of distal regulatory element accessibility, which was related to leukaemia evolution and was shown to be independent of genetic heterogeneity [Citation8]. In addition, DNA methylation analysis using RRBS in primary AML samples reported differing kinetics of mutational heterogeneity and methylation variability and demonstrated a significant relationship between stochastic variation in DNA methylation and risk of relapse [Citation9]. However, a genome-wide evaluation of DNA methylation stochasticity in AML has not been previously reported in the literature.
Here we employed whole genome bisulphite sequencing (WGBS) to generate genome-wide methylation data in a genetically simple, cytogenetically defined subtype of AML driven by MLL gene rearrangements (MLL-r AML). By using these data, we computed DNA methylation potential energy landscapes (PELs) that fully characterized the probabilistic behaviour of the methylation state and provided a genome-wide evaluation of DNA methylation stochasticity. We found a marked increase of DNA methylation stochasticity in MLL-r AML as compared to normal haematopoietic cell types localizing to functionally important genes and regulatory elements, suggesting a dysregulated DNA methylation profile in this leukaemia subtype that may facilitate greater plasticity and resistance to therapy.
Recently, a WGBS study of DNMT3A-mutated AML was reported, which was performed by evaluating only mean changes in DNA methylation without assessing methylation variability [Citation20]. While DNMT3A-dependent differentially hypomethylated and hypermethylated sites were identified, these were associated with minimal changes in transcriptional activity. Moreover, no consistent relationship was identified between promoter methylation and gene expression in DNMT3A-mutated AML, reporting a lack of expression differences in genes with promoter hypomethylation or hypermethylation between AML and normal CD34 cells [Citation20]. Our results show that MLL-r AML behaves differently, exhibiting a significant association between DNA methylation and gene expression. Interestingly, differential methylation alone can recapitulate previously defined MLL-r gene expression signatures, suggesting a crucial role for altered DNA methylation in the transcriptional programme initiated by MLL translocations.
Among differentially expressed genes, LOC100289656 was previously reported as the most specific transcript for MLL-r AML, with possible diagnostic utility as a marker for this type of leukaemia. Potential energy landscape (PEL) analysis of our data showed that the chromosomal band 15q13.1 containing this gene was subject to a statistically significant discordance of methylation stochasticity in MLL-r AML suggesting that LOC100289656 is one of the most epigenetically informative genes, thus corroborating its status as a possible DNA methylation-based biomarker for MLL-r AML. Given the relationship of altered DNA methylation to gene expression in MLL-r AML, drugs targeting the DNA methylation machinery in AML may warrant further investigation for therapeutic intervention. Interestingly, the hypomethylating agents azacytidine and decitabine have recently demonstrated activity in paediatric and adult AML [Citation26,Citation27] and in MLL-rearranged infant lymphoblastic leukaemias [Citation28].
A novel aspect of our analysis was the use of the Jensen-Shannon distance (JSD) as a measure of epigenetic discordance in AML. This quantity provides a full assessment of methylation stochasticity differences observed in a pair of AML/normal samples by computing an information-theoretic distance between the probability distributions of mean methylation levels within the two samples. The JSD also provides a measure of the informational content of the DNA methylation state as it relates to the phenotype (AML or normal) and, therefore, permits the identification of informative genes and genomic features most critical to AML. By ranking chromatin states using the JSD, we identified specific regions of the genome, such as bivalent promoters, active enhancers, and transcription-regulatory elements, as being critical to the MLL-r AML phenotype.
The work reported in this paper reinforces recent results suggesting a crucial role for DNA methylation alterations at distal regulatory sequences in cancer [Citation29], and in particular at super-enhancers [Citation30]. Notably, DNA methylation at enhancer elements has been further shown to regulate leukaemia cell identity, since reconfiguration of DNA methylation at elements exerting long-range gene regulatory influences has been observed during leukaemia cell trans-differentiation [Citation31]. It also enabled identification of genes that warrant further study, including genes previously implicated in MLL-r AML biology, such as LOC100289656 and genes in the HOXA cluster, as well as new targets, such as EGFL7 and GATA2, thus providing a resource for functional investigation of these gene targets in models of leukaemogenesis. However, further work is needed to assess the DNA methylation landscape in a broader range of AML subtypes, particularly those driven by other epigenetic modifier mutations, in order to investigate convergent patterns of epigenetic dysregulation in leukaemia. Collectively, our results suggest that WGBS, coupled with an information-theoretic potential energy landscape (PEL) approach to DNA methylation analysis, can provide a rich resource for further investigation of epigenetic alterations underlying a malignant phenotype.
Materials and methods
Patients and cell samples
Human AML samples were obtained from patients at the Stanford Medical Centre with informed consent, according to Institutional Review Board (IRB)–approved protocols (Stanford IRB nos. 18,329 and 6453). Mononuclear cells were isolated from patient samples using Ficoll separation (GE Healthcare Life Sciences) and cryopreserved in liquid nitrogen in 90% FBS and 10% DMSO. Normal HSC, L-MPP, and GMP from healthy donors were isolated as previously described [Citation8]. Analysis was performed on freshly thawed cells.
WGBS library preparation and sequencing
For primary MLL-r AML, HSC, L-MPP, and GMP cell samples, we isolated genomic DNA using the MasterPure DNA Purification kit (Epicentre). We confirmed integrity of genomic DNA by gel electrophoresis. WGBS single indexed libraries were generated using NEBNext Ultra DNA library Prep kit for Illumina (New England BioLabs) according to the manufacturer’s instructions with the following modifications: 500 ng input gDNA was quantified by Qubit dsDNA BR assay (Invitrogen) and spiked with 1% unmethylated Lambda DNA (Promega, cat # D1521) to monitor bisulphite conversion efficiency. We fragmented input gDNA by Covaris S220 Focused-ultrasonicator to an average insert size of 350 bp. Samples were sheared for 60 sec using Covaris microTUBEs, with instrument settings of duty cycle 10%, intensity 5 and cycles per burst 200. Size selection was performed using AMPure XP beads and insert sizes of 300–400 bp were isolated. Samples were bisulphite converted after size selection using EZ DNA Methylation-Gold Kit or EZ DNA Methylation-Lightning Kit (Zymo cat#D5005, cat#D5030) following the manufacturer’s instructions. After bisulphite conversion, we performed amplification using Kapa Hifi Uracil+ (Kapa Biosystems, cat# KK282) polymerase based on the following cycling conditions: 98°C 45 s/8cycles: 98°C 15 s, 65°C 30 s, 72°C 30 s/72°C 1 min. AMPure cleaned-up libraries were run on the 2100 Bioanalyzer (Agilent) High-Sensitivity DNA assay and samples were also run on the Bioanalyzer after shearing and size selection for quality control purposes. We quantified libraries by qPCR using the Library Quantification Kit for Illumina sequencing platforms (Kapa Biosystems, cat#KK4824) and the 7900HT Real Time PCR System (Applied Biosystems). We sequenced WGBS libraries on an Illumina HiSeq4000 instrument using 150 bp paired-end indexed reads and 25% of non-indexed PhiX library control (Illumina). We indicate coverage and average GpG depth in Table S2. The bisulphite conversion rate of unmethylated Lambda DNA was 99.6% on average.
We processed FASTQ files using Trim Galore! v0.3.6 (Babraham Institute) to perform single-pass adapter- and quality-trimming of reads and employed FastQC v0.11.2 for quality control of reads. We aligned reads to the hg19/GRCh37 genome using Bismark v0.14.5 and Bowtie2 v2.2.6. We generated separate mbias plots for read 1 and read 2 by running the Bismark methylation extractor using the ‘mbias_only’ flag. We subsequently processed BAM files with Samtools v0.1.19 for sorting, merging, duplicate removal and indexing.
RNA-seq alignment
We aligned reads to GRCh37 using STAR version 2.4.2a [Citation32] with the following options – readFilesCommand zcat – outSAMtype BAM Unsorted SortedByCoordinate – quantMode TranscriptomeSAM GeneCounts. We generated summarized experiment (se) objects using the gtf file Homo_sapiens.GRCh37.75.gtf and the following command from the Bioconductor package ‘GenomicAlignments’: summarizeOverlaps(features = exonsByGene, reads = bamfiles, mode = ‘Union’, singleEnd = FALSE, ignore.strand = FALSE, fragments = TRUE).
Genomic features and annotations
Files and tracks bear genomic coordinates for hg19. We obtained CGIs from Wu et al [Citation33]. We defined CGI shores as sequences flanking 2-kb on either side of CGIs, shelves as sequences flanking 2-kb beyond the shores, and open sea as everything else. We used the R package ‘TxDb.Hsapiens.UCSC.hg19.knownGene’ to define genes, exons, and introns. We defined the promoter region of a gene as the 4-kb window centred at its transcription start site (TSS) and determined the gene body region to be the remainder of the gene. We obtained enhancer and promoter annotations, as well as other relevant genomic annotations not mentioned above, using ChromHMM [Citation12].
PEL computation
We computed DNA methylation potential energy landscapes (PELs) from WGBS data using informME (v0.3.2), a freely available information-theoretic pipeline for methylation analysis based on the one-dimensional Ising model of statistical physics [Citation10,Citation11]. For these computations, the entire genome was partitioned into consecutive non-overlapping genomic windows of 3-kb each and a PEL was estimated within each window from available WGBS reads using a maximum-likelihood approach [Citation10,Citation11].
Methylation level and entropy
We further partitioned each 3-kb estimation window into 20 non-overlapping analysis regions of size 150 bp each. Within each analysis region, we computed the probability distribution of the methylation level, the mean methylation level (MML), and the normalized methylation entropy (NME) directly from the associated PEL using informME. The methylation level within an analysis region with CpG sites is given by
, where
is a binary random variable that takes values 0 or 1 with a certain probability, indicating that the n-th CpG site in the analysis region is unmethylated or methylated, respectively. The MML is the expected value of
, given by
, where
,
, is the associated probability distribution of the methylation level, whereas the NME is a normalized version of the Shannon entropy of
, given by
. The MML takes values between 0 and 1, with 0 indicating a fully unmethylated analysis region and 1 indicating a fully methylated region. The NME takes values between 0 and 1 as well, with 0 indicating a methylation level that is always observed (perfectly ordered methylation) and 1 indicating that the methylation levels within an analysis region are equally likely (fully stochastic methylation).
Jensen-Shannon distance
We computed the Jensen-Shannon distance (JSD) between two probability distributions, and
, of the methylation level in a test (AML) and a reference (normal) sample within an analysis region by
, where
and
is the Kullback-Leibler divergence (or otherwise known as relative entropy) of a probability distribution
from a probability distribution
. The JSD takes values between 0 and 1, with 0 indicating that the probability distributions
and
are identical (no statistical discordance in methylation level) and 1 indicating that the supports of the two probability distributions do not intersect each other (maximum statistical discordance).
Methylation sensitivity index
We modelled the effect of epigenetic changes on methylation as a perturbation of size applied on the methylation potential energy landscape [Citation10]. Such perturbation can modify the probability distribution
of the methylation level within the analysis region leading to a new probability distribution
, a change that we assessed using the Jensen-Shannon distance
between
and
. To quantify the ease with which the epigenome can regulate the methylation potential energy landscape within an analysis region, we used the absolute value of the derivative
, which we refer to as the methylation sensitivity index (MSI). Note that
for a small enough
, whereas
. Therefore, we set
and approximately compute the MSI within an analysis region by
.
Differential methylation analysis
We performed differential analysis between test (AML) and reference (normal) WGBS samples using informME [Citation11]. We computed, within analysis regions, Jensen-Shannon distances (JSDs) between the corresponding methylation level probability distributions, as well as differences between mean methylation levels (dMMLs), normalized methylation entropies (dNMEs), and methylation sensitivity indices (dMSIs). We also performed DMR detection by employing the ‘jsDMR’ utility of informME, which uses the JSD to identify regions of the genome with statistically significant discordance in methylation stochasticity. As previously described [Citation11], this is done by smoothing the JSD values using the Nadaraya-Watson kernel regression smother with a Gaussian kernel of a fixed bandwidth (5-kb) and by performing multiple hypothesis testing, using the Benjamini-Yekutieli method to control the false discovery rate (FDR) at 0.05, on the smoothed JSD values based on a null JSD distribution that is empirically computed from all CD34 normal sample comparisons.
Hypothesis testing and gene ranking
In a single test/reference (AML/normal) comparison, we computed within, the promoter and body regions of each gene in the genome, the magnitude of the Jensen-Shannon distance (JSD), which we calculated as the square root of the average of the squared JSD values within all analysis regions that overlap each feature (promoter or body). By following a previous statistical methodology [Citation13], we performed hypothesis testing to test against the null hypothesis that the JSD magnitude within a particular genomic feature (promoter or body) can be explained by normal technical, statistical, or biological variability. We did so by empirically constructing a null distribution for the values of all JSD magnitudes genome-wide, which we obtained by comparing our three normal CD34 samples. To account for variability in the number of analysis regions overlapping each genomic feature, we employed generalized additive models for location scale and shape (GAMLSS) with a logit skewed Student’s t-distribution. We also performed hypothesis testing simultaneously for methylation discordance within a gene’s promoter and body using Fisher’s summary statistic to test the null hypothesis that epigenetic discordance observed within a gene’s promoter or body in a test/reference comparison is only associated with biological, statistical, or technical variability in the reference samples, against the alternative hypothesis that this discordance is due to other factors within at least one of the two features considered (promoter or body). To evaluate genes in multiple test/reference comparisons, we used Fisher’s summary test statistic to test the null hypothesis that epigenetic discordance observed within a gene’s promoter and body in the test/reference comparisons is only associated with biological, statistical, or technical variability in the reference samples, against the alternative hypothesis that this discordance is due to other factors within at least one of the two genomic features considered (promoter or body) in at least one of the test/reference comparisons, and followed a similar approach to evaluate genes using only their promoters or bodies. We finally scored each gene by using the computed p-value for rejecting the null hypothesis and produced a ranked list of genes with increasing p-values, breaking possible ties by combining the p-value rankings obtained from each single test/reference comparison using the method of rank products. Finally, we evaluated the statistical significance of each ranking while controlling for the false-discovery rate (FDR) at 0.05 using q-values computed by the Benjamini-Hochberg procedure.
Integration of DNA methylation with gene expression
We performed differential gene expression analysis by means of DESeq2 [Citation34] using previously published RNA-seq data [Citation6,Citation18] from 31 MLL fusion AML and 17 normal CD34+ samples and classified genes into three categories: significantly upregulated (UR) genes, significantly downregulated (DR) genes, and genes demonstrating no significant differential expression (ND). To annotate transcripts, we used the biomaRt package with ensembl = useEnsembl(biomart = ‘ensembl’, dataset = ‘hsapiens_gene_ensembl’, GRCh = 37). For each MLL-r AML/CD34-1 comparison and for each gene, we computed the average JSD, dMML, and dNME values within their promoter regions using informME. We considered 17,656 genes, which were the genes annotated by the R package ‘TxDb.Hsapiens.UCSC.hg19.knownGene’ that showed differential gene expression in the RNA-seq data. The totality of the genes resulted in 6,383 UR genes, 4,640 DR genes, and 6,633 ND genes. The UR group comprised of genes with positive log-fold change and adjusted p-value below 0.05, the DR group comprised of genes with negative log-fold change and adjusted p-value below 0.05, and the third group comprised of the remaining genes. We implemented Kruskal-Wallis-Dunn tests (non-parametric analogues of the one-way ANOVA test) using the R functions ‘kruskal.test’ and ‘dunn.test’, proportion tests using the R function ‘prop.test’, and Wilcoxon rank-sum tests using the R function ‘wilcox.test’. To evaluate the effect size in the Kruskal-Wallis-Dunn and Wilcoxon tests, we used the rank-biserial correlation method based on the difference between the proportion of pairs between the two tested groups that were favourable to the alternative hypothesis minus the proportion that was unfavourable. Specifically, we computed the ratio , where
is the number of paired values
of the measure of promoter methylation discordance used (average JSD, dMML, or dNME) in the two groups such that
,
is the number of paired values
such that
, and
is the total number of pairs considered. Since the data were not matched, there were too many pairs to consider, an issue that we addressed by estimating the rank-biserial correlation in each case using Monte Carlo sampling.
Data Availability
WGBS/informME data have been deposited in the Gene Expression Omnibus under accession GSE135869.
Supplemental Material
Download Zip (10.9 MB)Acknowledgments
We thank the Stanford Hematology Division Tissue Bank and the patients for donating their samples. This work was supported by US National Institutes of Health grants CA65438 to A.P.F, R01CA188055 to R.M., US National Science Foundation Grant CCF-1656201 to J.G, and the Damon Runyon-Sohn Pediatric Cancer Fellowship and St. Baldrick’s Foundation Fellowship to M.A.K. The funders had no role in study design, data collection and analysis, decision to publish, or preparation of the manuscript.
Disclosure Statement
R.M. is co-founder, consultant, equity holder, and serves on the Board of Directors of Forty Seven Inc. The are no other potential competing interests.
Supplementary material
Supplemental data for this article can be accessed here.
Additional information
Funding
References
- Papaemmanuil E, Gerstung M, Bullinger L, et al. Genomic classification and prognosis in acute myeloid leukemia. N Engl J Med. 2016;374(23):2209–2221.
- Krivtsov AV, Hoshii T, Armstrong SA. Mixed-lineage leukemia fusions and chromatin in leukemia. Cold Spring Harb Perspect Med. 2017;7(11):a026658.
- Meyer C, Burmeister T, Groger D, et al. The MLL recombinome of acute leukemias in 2017. Leukemia. 2018;32(2):273–284.
- Cancer Genome Atlas Research N, Ley TJ, Miller C, Ding L, et al. Genomic and epigenomic landscapes of adult de novo acute myeloid leukemia. N Engl J Med 2013;368(22):2059–2074.
- Armstrong SA, Staunton JE, Silverman LB, et al. MLL translocations specify a distinct gene expression profile that distinguishes a unique leukemia. Nat Genet. 2002;30(1):41–47.
- Lavallee VP, Baccelli I, Krosl J, et al. The transcriptomic landscape and directed chemical interrogation of MLL-rearranged acute myeloid leukemias. Nat Genet. 2015;47(9):1030–1037.
- Mazor T, Pankov A, Song JS, et al. Intratumoral heterogeneity of the epigenome. Cancer Cell. 2016;29(4):440–451.
- Corces MR, Buenrostro JD, Wu B, et al. Lineage-specific and single-cell chromatin accessibility charts human hematopoiesis and leukemia evolution. Nat Genet. 2016;48(10):1193–1203.
- Li S, Garrett-Bakelman FE, Chung SS, et al. Distinct evolution and dynamics of epigenetic and genetic heterogeneity in acute myeloid leukemia. Nat Med. 2016;22(7):792–799.
- Jenkinson G, Pujadas E, Goutsias J, et al. Potential energy landscapes identify the information-theoretic nature of the epigenome. Nat Genet. 2017;49(5):719–729.
- Jenkinson G, Abante J, Feinberg AP, et al. An information-theoretic approach to the modeling and analysis of whole-genome bisulfite sequencing data. BMC Bioinformatics. 2018;19(1):87.
- Ernst J, Kellis M. Chromatin-state discovery and genome annotation with ChromHMM. Nat Protoc. 2017;12(12):2478–2492.
- Jenkinson G, Abante J, Koldobskiy MA, et al. Ranking genomic features using an information-theoretic measure of epigenetic discordance. BMC Bioinformatics. 2019;20(1):175.
- Subramanian A, Tamayo P, Mootha VK, et al. Gene set enrichment analysis: a knowledge-based approach for interpreting genome-wide expression profiles. Proc Natl Acad Sci U S A. 2005;102(43):15545–15550.
- Liberzon A, Subramanian A, Pinchback R, et al. Molecular signatures database (MSigDB) 3.0. Bioinformatics. 2011;27(12):1739–1740.
- Lechman ER, Gentner B, Ng SW, et al. miR-126 regulates distinct self-renewal outcomes in normal and malignant hematopoietic stem cells. Cancer Cell. 2016;29(2):214–228.
- McLean CY, Bristor D, Hiller M, et al. GREAT improves functional interpretation of cis-regulatory regions. Nat Biotechnol. 2010;28(5):495–501.
- Lavallee VP, Gendron P, Lemieux S, et al. EVI1-rearranged acute myeloid leukemias are characterized by distinct molecular alterations. Blood. 2015;125(1):140–143.
- Hahn CN, Chong CE, Carmichael CL, et al. Heritable GATA2 mutations associated with familial myelodysplastic syndrome and acute myeloid leukemia. Nat Genet. 2011;43(10):1012–1017.
- Spencer DH, Russler-Germain DA, Ketkar S, et al. CpG Island hypermethylation mediated by DNMT3A is a consequence of AML progression. Cell. 2017;168(5):801–16 e13.
- Feinberg AP, Ohlsson R, Henikoff S. The epigenetic progenitor origin of human cancer. Nat Rev Genet. 2006;7(1):21–33.
- Pujadas E, Feinberg AP. Regulated noise in the epigenetic landscape of development and disease. Cell. 2012;148(6):1123–1131.
- Timp W, Feinberg AP. Cancer as a dysregulated epigenome allowing cellular growth advantage at the expense of the host. Nat Rev Cancer. 2013;13(7):497–510.
- Landau DA, Clement K, Ziller MJ, et al. Locally disordered methylation forms the basis of intratumor methylome variation in chronic lymphocytic leukemia. Cancer Cell. 2014;26(6):813–825.
- Pan H, Jiang Y, Boi M, et al. Epigenomic evolution in diffuse large B-cell lymphomas. Nat Commun. 2015;6:6921.
- Sun W, Triche T Jr., Malvar J, et al. A phase 1 study of azacitidine combined with chemotherapy in childhood leukemia: a report from the TACL consortium. Blood. 2018;131(10):1145–1148.
- Welch JS, Petti AA, Miller CA, et al. TP53 and decitabine in acute myeloid leukemia and myelodysplastic syndromes. N Engl J Med. 2016;375(21):2023–2036.
- Roolf C, Richter A, Konkolefski C, et al. Decitabine demonstrates antileukemic activity in B cell precursor acute lymphoblastic leukemia with MLL rearrangements. J Hematol Oncol. 2018;11(1):62.
- Vidal E, Sayols S, Moran S, et al. A DNA methylation map of human cancer at single base-pair resolution. Oncogene. 2017;36(40):5648–5657.
- Heyn H, Vidal E, Ferreira HJ, et al. Epigenomic analysis detects aberrant super-enhancer DNA methylation in human cancer. Genome Biol. 2016;17:11.
- Bueno-Costa A, Pineyro D, Soler M, et al. B-cell leukemia transdifferentiation to macrophage involves reconfiguration of DNA methylation for long-range regulation. Leukemia. 2019.
- Dobin A, Davis CA, Schlesinger F, et al. STAR: ultrafast universal RNA-seq aligner. Bioinformatics. 2013;29(1):15–21.
- Wu H, Caffo B, Jaffee HA, et al. Redefining CpG islands using hidden Markov models. Biostatistics. 2010;11(3):499–514.
- Love MI, Huber W, Anders S. Moderated estimation of fold change and dispersion for RNA-seq data with DESeq2. Genome Biol. 2014;15(12):550.