
ABSTRACT
Evidence suggests there are roles for vitamin K in various chronic disease outcomes, but population-level diet and supplement recommendations are difficult to determine due to high levels of variability in measures of status and response to intake compared to other nutrients. In this preliminary investigation, a blood-based epigenome-wide association study (EWAS) comparing responders and non-responders to phylloquinone (vitamin K1) supplementation (NCT00183001) was undertaken in order to better understand the molecular underpinnings of this observed variability. Responders (n = 24) and non-responders (n = 24) were identified in a prior 3-year phylloquinone supplementation trial based on their changes in plasma phylloquinone concentrations. Differential DNA methylation was identified in multiple regions with previously unknown relationships to phylloquinone absorption and metabolism, such as at the TMEM263 locus. A hypothesis-driven analysis of lipid-related genes highlighted a site in the NPC1L1 gene, supplementing existing evidence for its role in phylloquinone absorption. Furthermore, an EWAS for baseline plasma phylloquinone concentrations revealed a strong correlation between the epigenomic signatures of phylloquinone baseline status and response to supplementation. This work can guide future epigenomic research on vitamin K and contributes to the development of more personalized dietary recommendations for vitamin K.
Introduction
Vitamin K is a fat-soluble nutrient and essential cofactor for the post-translational γ-carboxylation of vitamin K dependent proteins. While it is best known for its role in coagulation, there is suggestive evidence for roles of vitamin K in various other health outcomes including inflammation, cardiovascular disease, and osteoarthritis [Citation1,Citation2].
Large interindividual variability in measures of vitamin K status has been observed [Citation3]. Compared to circulating concentrations of the other fat-soluble vitamins, the major circulating form of vitamin K, phylloquinone (vitamin K1), had the largest interindividual variability [Citation3]. Stable isotope studies of phylloquinone have reported a bioavailability ranging from 2% to 26% [Citation4]. To date, biologically plausible factors have been examined, but most of the variability remains unaccounted for [Citation5,Citation6]. A better understanding of the factors that influence biomarkers of vitamin K metabolism could help to clarify the contribution of vitamin K in health outcomes.
The bioavailability of other fat-soluble nutrients has been shown to be under partial genetic control [Citation7]. The genetic contribution to the interindividual variability in circulating phylloquinone was examined in a small cross-sectional meta-analysis of genome-wide association studies (GWAS) [Citation8]. This analysis identified suggestive sites, but no single nucleotide polymorphism (SNP) reached genome-wide significance. The association of lipid-related candidate gene variants with the plasma phylloquinone response to supplementation has also been examined. Variants were suggestive of mechanisms involved in phylloquinone metabolism, but collectively the candidate SNPs did not explain the observed variability in the response to supplementation [Citation9].
Epigenetic marks such as DNA methylation are emerging as a source of information that may be complementary to genetic variants in explaining trait variance [Citation10]. DNA methylation regulates gene expression through the modulation of transcription factor binding and chromatin accessibility, and displays a degree of temporal stability that allows for its use as a biomarker of modifiable phenotypic states [Citation11]. Furthermore, it has been demonstrated to predict response to intervention in both pharmaceutical [Citation12] and nutritional [Citation13] contexts. While these observations suggest that DNA methylation may be a valuable input for personalized nutrition approaches, to our knowledge, the role of DNA methylation in the variable response to vitamin K intake has not been examined.
The objective of this hypothesis-generating study was to characterize the epigenomic associations of DNA methylation with the plasma phylloquinone response to supplementation. To achieve this, we performed a microarray-based, epigenome-wide association study (EWAS) using DNA isolated from blood samples collected from 48 healthy older adults randomized to the treatment arm of a completed, 3-year, 500 µg/d phylloquinone supplementation trial. We identified differential methylation at both known and novel loci, and carried out a secondary EWAS of baseline plasma phylloquinone to demonstrate links between the epigenomic signatures of steady-state and dynamic phylloquinone concentrations.
Results
Phylloquinone supplementation responder identification
Of the 229 individuals randomized to the treatment group, 104 met the conditions of this study (white, consented for genotyping, ≥85% adherent to the protocol, with a SD <2 nmol/L in the four follow-up measures of plasma phylloquinone). Using the non-responder criteria derived in the nontreatment group, 40 of the 104 (38%) participants were classified as non-responders. Characteristics of the selected 24 responders and 24 non-responders are described in . Dietary intake and baseline concentrations of plasma phylloquinone were not different between responders and non-responders. A greater proportion of females were categorized as responders in this sample, but the group means did not differ otherwise ().
Table 1. Descriptive statistics of the responders (n = 24) and non-responders (n = 24) from the treatment group of a 3-year phylloquinone supplementation trial.
EWAS for plasma phylloquinone supplementation response
After preprocessing and quality control steps, 785,436 CpG sites were available for analysis. While unadjusted genomic inflation was high (λ = 2.35), possibly due to technical biases arising from the randomization of responders and non-responders at the microarray chip-level, adjustment for 10 control-probe principal components reduced the genomic inflation to a moderate level (λ = 1.21). Genome-wide analysis revealed two differentially methylated CpGs (DMCs) surpassing a genome-wide Bonferroni threshold (6.37 x 10⁻⁸) (; Model 1). Adjustment for biological variables (Models 2 and 3) did not markedly change the results for cg10918016 when accounting for the loss of degrees of freedom, while the significance of the relationship at cg04894169 was notably attenuated.
Table 2. Top hits from the primary phylloquinone supplementation responder EWAS.
Given the small sample size, differentially methylated regions (DMRs) were sought to improve power to detect biological signal. The Comb-p tool was used to call DMRs based on the p-values from Model 1 responder analysis. At a Šidák-corrected regional p-value threshold of 0.05, 80 regions were uncovered. The region with the strongest association was located on chromosome 12 at the C12orf23 locus (regional p = 2.99 x 10⁻⁸). Regions with adjusted p < 0.01 are displayed in , and the full list is displayed in Supplemental Table S3. The top single-site association (in NCOR2) was a member of a 9-CpG DMR (regional p = 0.037), while the next strongest single-site association (in XPC/LSM3) was a member of a 22-CpG DMR (regional p = 0.0005). DMR detection was re-run using adjusted p-values from Model 2 as a sensitivity analysis, confirming most of the regional associations (including that at C12orf23) but not all (42/80 retained adjusted p < 0.05).
Table 3. DMR results from Comb-p (regions with Model 1 adjusted p < 0.01 shown) for the phylloquinone supplementation responder EWAS.
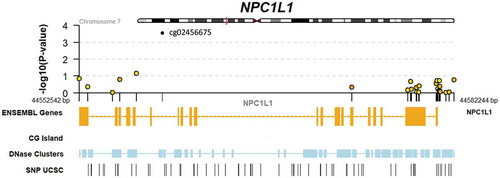
As a hypothesis-driven sub-analysis, a set of candidate lipid-related genes were selected for specific assessment. This included 254 CpGs in 6 genes (APOA1, APOA5, APOB, APOE, LPL, and NPC1L1). While this set did not show systematic enrichment for EWAS signal (p = 0.81; Kolmogorov-Smirnov test; Supplemental Figure S1), a single CpG site in NPC1L1 (cg02456675) showed a Benjamini-Hochberg false discovery rate of <0.1 (p = 2.9 x 10⁻⁴). We retrieved genotype data for a genetic variant in NPC1L1 (rs2072183) previously shown to be associated with phylloquinone response to supplementation, and found no relationship between this SNP and cg02456675 in an additive genetic model after adjustment for the Model 1 or Model 2 covariate sets. Further details on the results for all CpGs in NPC1L1 as well as local genomic annotations are shown in . EWAS results for suggestive associations (nominal p < 0.05) of lipid-related CpGs are shown in Supplemental Table S1.
Figure 1. Genomic context of NPC1L1 responder EWAS results. Upper panel shows a regional Manhattan plot for CpGs within the NPC1L1 gene. Lower panel includes tracks indicating exonic and intronic regions of the gene, CG islands (none present within this region), DNase hypersensitivity regions, and SNPs retrieved from the UCSC genome browser database.
Associations of responder status and DNA methylation with percent undercarboxylated osteocalcin (%ucOC) were tested to provide a potential link to vitamin K function. However, changes in %ucOC did not differ according to responder status in this dataset (p = 0.54). In addition, changes in %ucOC did not show associations with any of the top 10 CpGs from the responder analysis, associations with the NPC1L1 CpG mentioned above, or enrichment for EWAS signal in the entire lipid-related CpG set.
Since sex was imbalanced between responders and non-responders, its role in the observed relationships was investigated further for top CpGs genome-wide and for NPC1L1. Adjustment for sex did not strongly attenuate any of the relationships at these 3 CpGs (, Supplemental Table S1). While visual inspection revealed patterns consistent with sex-specific effects (Supplemental Figure S2), incorporation of an interaction term between responder status and sex into Model 1 did not produce significant results. The available sample size was not sufficient to reasonably enable a stratified analysis.
EWAS for baseline plasma phylloquinone
A secondary EWAS for baseline plasma phylloquinone was performed to detect shared molecular signal between the plasma phylloquinone response to a regular dietary intake of phylloquinone and the response to a supplemental dose and to provide support for the primary responder analysis. With adjustment for five principal components (derived from the M-value matrix) as well as responder status, a genomic inflation in the baseline analysis of λ = 0.99 was observed. No DMCs were identified as passing a genome-wide Bonferroni threshold (Supplementary Table S2). Sensitivity analyses included two models adding identical variables to those from the responder analysis as well as a third with additional adjustment for estimated phylloquinone intake based on a food frequency questionnaire (FFQ) completed at baseline [Citation14]. None of the models produced major changes in the results.
Using an analogous process to that for the responder analysis, 48 DMRs were uncovered at Šidák-corrected p < 0.05. The most significant baseline DMR was located on chromosome 20 at the MATN4/RBPJL locus (adjusted regional p = 5.81x10⁻¹⁵). No overlapping regions were found to show corrected p < 0.05 for both the responder and baseline analyses. Regions with adjusted p < 0.01 are displayed in , and the full list is displayed in Supplemental Table S4. Sensitivity analysis using Model 2 p-values confirmed regional associations at approximately one-third of these loci (14/48), including the top DMR (adjusted p = 2.38 x 10⁻⁹).
Table 4. DMR results from Comb-p (regions with Model 1 adjusted p< 0.01 shown) for the baseline phylloquinone EWAS.
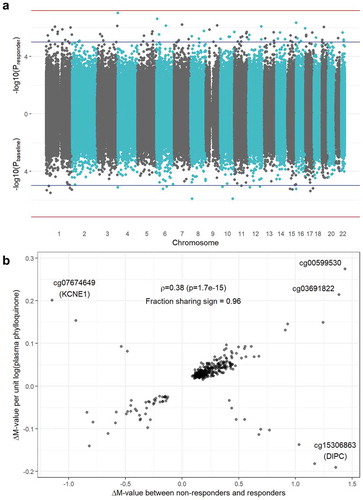
A comparison of the epigenomic architectures of responder and baseline EWAS results is available in . A set of moderate-confidence CpGs was generated by filtering for the group of CpG sites reaching nominal significance (p < 0.05) using minimally adjusted models (Model 1) at both the regional and single-site level in both EWAS. For this set, the Pearson correlation between regression coefficients was low (ρ = 0.01, p = 0.84). However, when using models adjusted for biologically plausible variables (Model 3), this correlation became stronger (ρ = 0.23, p = 9.9 x 10⁻⁵). With additional adjustment for plasma phylloquinone intake in the baseline analysis (Model 4), this correlation grew further (ρ = 0.38, p = 1.7 x 10⁻¹⁵). The set of CpGs with matching signs across fully adjusted analyses was used as input to a gene enrichment analysis, returning no significant biological processes at a false discovery rate of <0.05.
Figure 2. Overlap between responder and baseline EWAS results. a) Miami plot showing -log10(p-value) on the y-axis for the responder analysis (top) and the baseline analysis (bottom). Blue horizontal lines denote suggestive significance (p = 1x10⁻⁵) while red horizontal lines denote a genome-wide Bonferroni threshold (p = 6.37 x 10⁻⁸). b) Comparison of effect sizes (i.e., regression coefficients) between the responder (x-axis) and baseline (y-axis) results. Estimates shown are from fully adjusted models, thus including adjustment for dietary phylloquinone intake for the baseline analysis. The annotated value is a Pearson correlation (ρ) coefficient between the set of results shown in the plot.
Discussion
Since vitamin K has potential roles in a range of chronic diseases [Citation2], it is important to understand the interindividual variability in biomarkers of vitamin K metabolism and be able to predict the response to dietary and supplemental vitamin K to better identify individuals who could benefit from greater intake. Here, we sought to use epigenomic data to examine the molecular basis for the observed variability. We found new potential epigenomic markers in whole blood and confirmed associations with known vitamin K biology. We also uncovered a strong correlation between the epigenomic architecture of the plasma phylloquinone response to supplementation and the phylloquinone concentrations outside of an intervention context. This suggests that the biology involved in phylloquinone metabolism with a typical dietary intake is also relevant when intake is in supplemental quantities.
Our primary analysis focused on epigenomic differences between 24 responders and 24 non-responders. Of single CpGs passing a genome-wide Bonferroni threshold using the minimally adjusted model, one (in the NCOR2 gene) was relatively unaffected by further adjustment for biological covariates. NCOR2 (also known as SMRT) codes for a nuclear receptor co-repressor involved in transcriptional silencing of certain genes [Citation15]. The protein, NCoR, is one of the most well-studied co-repressors with respect to the vitamin D receptor and also signals alongside the vitamin A-responsive RAR/RXR [Citation16]. Though we are not aware of any involvement of NCoR in phylloquinone metabolism, the present findings combined with its connection to fat-soluble vitamin signaling could warrant further investigation. It should be noted that while the difference may not be biologically meaningful in blood (estimated difference between responders and non-responders of 0.9%), it could be a marker for stronger tissue-specific effects.
Region-based analyses were used to enhance statistical power to detect associations due to the aggregation of signal from neighbouring CpG sites. The top responder DMR was in an enhancer upstream of the C12orf23 gene, also known as TMEM263. This gene encodes a transmembrane helix protein that is highly and specifically expressed at the RNA and protein levels in the gastrointestinal tract [Citation17]. Beyond this mechanistic connection to absorptive processes, TMEM263 variants have been linked in GWAS to bone mineral density (BMD) [Citation18]. BMD has been mechanistically linked to vitamin K through the presence of a vitamin K dependent protein, osteocalcin (OC), in bone. In fact, BMD was a primary outcome of the trial examined here, though the results were null [Citation19].
Phylloquinone absorption and transport in circulation is known to be consistent with that of many other dietary lipids, involving intestinal uptake of mixed micelles, packaging into chylomicrons, export into the lymph, and lipoprotein transport [Citation20]. Age-related increases in plasma phylloquinone have been found to be secondary to increases in plasma triglycerides [Citation21], and genomic signatures of plasma phylloquinone have been shown to change after adjustment for triglycerides [Citation8]. In a previous analysis of data from this phylloquinone supplementation trial, the contribution of lipids to the plasma phylloquinone response was examined among men (N = 66) and women (N = 85) of this supplemented group. The authors found that plasma TG accounted for 34% and 11% of the variability in the response in men and women, respectively [Citation9]. As such, we have previously prioritized lipid-related genes in seeking genetic variants that may modify response to vitamin K supplementation [Citation9]. While analysis of CpGs annotated to this subset of genes did not show a systematic enrichment of signal, a notable suggestive association was detected at cg02456675 in the NPC1L1 gene. This gene is traditionally known for its role in cholesterol and α-tocopherol transport [Citation22,Citation23]. However, in a genetic analysis of the plasma phylloquinone response to supplementation, a SNP in this gene (rs2072183) was shown to be an important determinant of the interindividual variability in the response in men [Citation9]. Furthermore, there is preliminary evidence that this gene may have a role in the intestinal absorption of phylloquinone [Citation24]. While it is possible that this CpG is under genetic control, the SNP in question lies about 20kb upstream in the NPC1L1 gene and this SNP-CpG combination has no established methylation-quantitative trait locus (mQTL) relationship in a database of mQTLs from whole blood [Citation25]. Furthermore, we used genotypes measured in this study population to demonstrate that the SNP and CpG in question were not associated after covariate adjustment. Sex-specificity of this relationship (along with those of the top genome-wide CpG sites) appeared to be present (Supplemental Figure S2), but the corresponding statistical interaction was null (p = 0.53).
The top baseline analysis DMR was at the MATN4/RBPJL locus, for which relationships with vitamin K metabolism or related phenotypes have not yet been published. Despite this lack of existing evidence, both of these genes are most strongly expressed in pancreas [Citation17], providing a link to digestive processes that could modulate vitamin K absorption. When considering the set of CpGs that were nominally associated with both response and baseline at the regional and site-specific levels, we observed a strong correlation between EWAS coefficients for the two analyses. While the median intake among US men and women is near the adequate intake (120 µg/d for men and 90 µg/d for women) [Citation26], 155 and 143 µg/d, respectively, in this group of participants, phylloquinone intakes have been shown to vary by hundreds of µg/d across populations [Citation27]. Additionally, of the fat-soluble nutrients, daily dietary phylloquinone intakes have been shown to display the highest intraindividual variability [Citation3]. Thus, a supplemental dose of 500 µg/d is likely to be the dominant source of phylloquinone in supplemented individuals without representing a supra-physiological intake. Accordingly, we posit that the strong correlation of baseline EWAS results with those of the primary responder EWAS both supports the primary findings and suggests that similar molecular machinery is involved in responses to both diet and supplements at these levels of intake.
Apart from circulating phylloquinone, additional biomarkers of vitamin K status reflect the degree of carboxylation of certain vitamin K-dependent proteins [Citation27]. For example, osteocalcin (OC) is a protein synthesized in bone that relies on vitamin K for activation; the percentage of circulating OC that is carboxylated (%ucOC) is considered a functional biomarker of vitamin K [Citation27]. We assessed %ucOC as a secondary outcome in this study and did not find that it was associated with top CpGs from the phylloquinone responder analysis. Consistent with the results of this study, in this same set of individuals, genetic and lipid correlates of the phylloquinone response did not associate with the %ucOC response [Citation9]. The inconsistency between biomarkers is not necessarily surprising, given that circulating phylloquinone reflects dietary phylloquinone absorption and transport, while additional physiological processes related to vitamin K metabolism occur prior to its localization in bone [Citation28]. Furthermore, myriad factors, including age, hormones, growth factors, and time of day, have been shown to impact OC synthesis and thus may affect %ucOC independent of vitamin K status [Citation29,Citation30]. In this study, circulating phylloquinone was used as the primary outcome because it most directly reflects phylloquinone absorption and transport. However, these data support the need for additional mechanistic research to better understand the factors that translate circulating vitamin K concentrations into their functional biochemical and physiological consequences.
The analysis presented here is limited in statistical power due to its low sample size, affording the ability to detect only large differences in DNA methylation. However, the repeated measures of vitamin K offsets some of the limitations of the small sample size. Our findings will need to be validated using complementary experimental methods and replicated in larger cohorts, which will also enable the construction of models to assess the total ability of epigenomic factors to predict interindividual differences in response to phylloquinone supplementation. Additionally, while sex was adjusted in sensitivity models and did not show significant interactions with responder status in our top associations, the sex imbalance in responders versus non-responders could have impacted the results observed here. The analysis of DNA methylation from blood limits the set of biological signals that can be uncovered; while genetically controlled and leukocyte-related mechanisms can be plausibly found, the inclusion of other relevant tissues such as intestine could provide complementary information. It is also important to note that the sample was restricted to white participants only, which reduced the potential heterogeneity of the sample but limits the generalizability of these results. Finally, much remains to be learned about optimal circulating phylloquinone concentrations. It is known that phylloquinone is the predominant form of vitamin K found in circulation, and phylloquinone concentrations are often compared to rank individuals’ vitamin K status in population studies [Citation27]. However, the implications of high or low concentrations with respect to functionality in tissues are not yet clear.
In summary, we present results from what is to our knowledge the first EWAS of vitamin K, both steady-state plasma phylloquinone concentrations and their dynamic changes in response to phylloquinone supplementation. We developed a framework for discriminating responders and non-responders to phylloquinone supplementation, and showed differences in DNA methylation between these groups at both known and novel loci, highlighting the importance of the NPC1L1 gene for further investigation. We also demonstrated a strong correlation between the epigenomic architectures of steady-state plasma phylloquinone and its response to supplementation, supporting the findings of the responder analysis and suggesting that similar molecular mechanisms may govern responses to food and supplementation. Taken together, this work can guide research related to the biology of vitamin K and aid the development of more personalized dietary recommendations.
Methods
Study design and participants
The present study was a secondary analysis of a completed, 3-year, double-blind, randomized, controlled phylloquinone supplementation trial [Citation19]. Based on a medical history questionnaire taken at baseline, the 452 community-dwelling men and women (60–80 years, 422 whites) who participated in the study were generally in good health, free of known coronary disease or osteoporosis, and not taking warfarin (a vitamin K antagonist). Equal numbers of participants were randomized to either the treatment (500 µg phylloquinone as part of a daily multivitamin formulation) or nontreatment (daily multivitamin without phylloquinone) group. All participants received a second daily tablet containing 600 mg calcium carbonate and 10 µg (400 IU) vitamin D as cholecalciferol. All participants were instructed to discontinue use of supplements containing vitamin K for 1 month prior to enrollment. No supplements other than those provided were permitted for the duration of the study. Protocol adherence was assessed by pill count. All participants provided written informed consent and the Institutional Review Board at Tufts University approved the protocol for this study [Citation19]. Consent for genomic data measurement was received for 416 participants. The trial was registered at clinicaltrials.gov as NCT00183001.
Biochemical measures
Blood samples were drawn after a minimum of a 10-h fast at baseline, 6, 12, 24, and 36 months (study completion). Samples were stored in individual cryogenic tubes at −80 C and protected from light until the time of analysis. Plasma phylloquinone and %ucOC, a functional biomarker of vitamin K metabolism, were measured in the Vitamin K Laboratory at the Tufts University Human Nutrition Research Center on Aging. Plasma phylloquinone was measured using high-performance liquid chromatography (HPLC), followed by fluorometric detection [Citation31]. Serum undercarboxylated osteocalcin (OC) and total OC were measured with radioimmunoassay [Citation32]. Analysis was performed within 12 months of completion of the supplementation trial.
Responder and non-responder selection
For this pilot study, biochemical measures were examined for 48 white participants randomized to the treatment group who consented for genotyping and demonstrated ≥85% adherence to the protocol were examined. The natural fluctuations (median of four follow-up measurements minus baseline measurement) in plasma phylloquinone over the 3 years in participants of the nontreatment group (N = 223) were determined (mean (SD), −0.11 (1.26) nmol/L). The middle 95% was used to classify participants in the treatment group (mean (SD), 2.21 (2.30) nmol/L) with similar changes as non-responders. After meeting methylation analysis sample criteria (i.e., sufficient volume and minimum DNA concentration) and excluding participants with outsized variances in follow-up measurements (standard deviation (SD) >2 nmol/L), the 24 participants with the largest 3-year change in plasma phylloquinone were selected as responders. Of the participants classified as non-responders, the 24 with the smallest absolute change in plasma phylloquinone were selected as non-responders. Additional criteria included baseline plasma phylloquinone measurement less than or equal to the maximum baseline plasma phylloquinone observed in the responders to avoid a ceiling effect.
DNA methylation and genotype data
DNA was isolated from blood and purified for PCR analysis using the QIAamp DNA Mini Kit (Qiagen Inc., # 51106) [Citation9]. Next, DNA (~1500 ng/sample) was treated with bisulphite and amplified using PCR at the Yale Center for Genome Analysis. Methylation profiling was then performed using the Illumina MethylationEPIC microarray platform [Citation33] and the data were downloaded as raw intensity files.
Methylation data preprocessing was performed for 866,091 probes using the minfi and wateRmelon packages for R [Citation33,Citation34]. Sample-wise filters were as follows: robust overall signal in the main cluster based on visual inspection of an intensity plot, less than 10% of probes undetected at a detection threshold of p < 1 x 10⁻¹⁶ and a reported sex matching methylation-based sex prediction. Probes were removed using the following criteria: more than 10% of samples undetected at a detection threshold of p < 1 x 10⁻¹⁶, location in the X or Y chromosomes, non-CpG probes, cross-hybridizing probes, probes measuring SNPs, and probes with an annotated common SNP at the CpG site or in the single-base extension region. Samples were normalized using the Noob method for background correction and dye-bias normalization, followed by the BMIQ method for probe-type correction [Citation35,Citation36]. Blood cell fractions for six blood cell types (CD4 + T-cells, CD8 + T-cells, B-cells, natural killer cells, monocytes, and granulocytes) were estimated using a common reference-based method [Citation37], and 5 of these (excluding granulocytes) were included in cell count fraction-adjusted statistical models. After quality control and filtering steps, 785,436 CpG sites were available for analysis, formatted as M-values (logit transform of the ratio of methylated signal to total microarray signal). Principal component analysis (PCA) was performed on the full set of M-values as well as on the set of control probes using code adapted from the CPACOR method [Citation38]. CpG annotations were retrieved using the MethylationEPIC annotation file available from Illumina (v1.0 B2), and expression of genes of interest was accessed using the Human Protein Atlas (www.proteinatlas.org).
Genotypes (coded as 0/1/2) for the SNP rs2072183 in NPC1L1 were determined using pyrosequencing as described in detail in a previous investigation and retrieved here for the methylation Quantitative Trait Locus (mQTL) analysis [Citation9].
Statistical analysis
Unless otherwise noted, statistical analyses were conducted using R version 3.4.2 [Citation39]. Differences in characteristics of the responders and non-responders were assessed with a t-test for continuous outcomes and a Chi-square test for dichotomous outcomes.
The plasma phylloquinone responder EWAS was conducted to compare 24 responders and 24 non-responders, selected as described above. Univariate linear models were tested for each CpG site, with methylation M-value as the dependent variable and binary responder status as the independent variable. Model 1 (the primary model) was adjusted for 10 CPACOR control-probe principal components, which was found to be necessary to control the genomic inflation. Model 2 was adjusted additionally for age, sex, and five estimated cell count fractions (see above). Model 3 included all prior covariates as well as natural log-transformed plasma triglyceride concentrations at baseline. FFQ-estimated dietary intake was not adjusted for because the regular dietary intake was well below the supplemental dose which was also more bioavailable than dietary phylloquinone and because intake at baseline did not differ between the two groups. For each CpG, outliers were identified using a quantile-based method (M-values outside of three interquartile ranges from the 25th and 75th percentiles) and removed prior to regression analysis. Analysis of %ucOC was performed in an analogous manner, using change in %ucOC (median of follow-up measurements – baseline measurement) to replace binary responder status as the independent variable of interest.
Because phylloquinone is transported on triglyceride-rich lipoproteins [Citation40,Citation41] and lipid-related SNPs have been linked to circulating phylloquinone [Citation8], a subset of candidate genes were prioritized for exploration within this responder EWAS. CpG sites within the following lipid-related genes were examined: APOA1, APOA5, APOB, APOE, LPL, NPC1L1 [Citation8,Citation9,Citation20,Citation42].
Under the presumption that variation in plasma phylloquinone concentrations due to a regular dietary intake would reflect differences in the same machinery responsible for variation in the plasma phylloquinone response to supplementation, an EWAS was conducted for baseline concentrations of phylloquinone to support the responder analysis. The independent variable was baseline plasma phylloquinone concentration (natural log-transformed) as a continuous value. Model 1 covariates included responder status and five full-dataset principal components (CPACOR control-probe principal components were not found to be helpful in controlling genomic inflation). Models 2 and 3 added covariates as in the responder analysis. One additional model (Model 4) was examined with adjustment for dietary phylloquinone intake at baseline, as assessed by the Willett semi-quantitative food-frequency questionnaire (FFQ).
Gene Ontology enrichment analyses were performed using the missMethyl package for R (gometh function). This method implements a hypergeometric test for gene set representation while accounting for the uneven representation of genes in the set of CpG sites on the MethylationEPIC microarray. Fully adjusted models (Models 3 and 4 for responder and baseline analyses, respectively) were filtered for those CpGs with nominal p-values (p < 0.05) in both analyses at the regional and single-site level and categorized as either matching sign (of regression coefficients) or non-matching sign. Enrichment analysis was then run for each of these sets independently to generate false discovery rates (FDRs) for Gene Ontology biological processes.
The Python-based tool Comb-p [Citation43] was used to call differentially methylated regions (DMRs). The method uses EWAS p-values directly, removing the requirement for additional covariate adjustment. Comb-p first calculates an autocorrelation function (ACF), for which a maximum distance of 1kb and a step size of 50 bases were used. Next, it uses the ACF to adjust each p-value using a Stouffer-Liptak-Kechris correction [Citation44], followed by identification of contiguous regions of sites with adjusted p-values below some threshold (here, p < 0.1 with no more than 500 bases between neighbouring sites in a region). Finally, the ACF is recalculated out to the maximum region size (a step size of 50 was used here as well) and regional p-values are calculated using the Stouffer-Liptak test. For Šidák multiple testing correction of DMRs [Citation45], Comb-p calculates the number of effective tests separately for each DMR as the number of loci tested divided by the number of loci in the region, thus approximating a correction for the total number of regions while accounting for region size.
Supplemental Material
Download MS Word (88 KB)Disclosure Statement
The authors report no conflict of interest.
Data availability statement
Epigenetic data along with basic demographic and phylloquinone-related data are available in the NCBI Gene Expression Omnibus (GEO) database (accession GSE 143307).
Supplementary material
Supplemental data for this article can be accessed here.
Additional information
Funding
References
- Booth SL. Roles for Vitamin K beyond coagulation. Annu Rev Nutr. 2009;29(1):89–110.
- Harshman SG, Shea MK. The role of Vitamin K in chronic aging diseases: inflammation, cardiovascular disease, and osteoarthritis. Curr Nutr Rep. 2016;5(2):90–98.
- Booth SL, Tucker KL, McKeown NM, et al. Relationships between dietary intakes and fasting plasma concentrations of fat-soluble vitamins in humans. J Nutr. 1997;127(4):587–592.
- Jones KS, Bluck LJC, Wang LY, et al. A stable isotope method for the simultaneous measurement of vitamin K1 (phylloquinone) kinetics and absorption. Eur J Clin Nutr. 2008;62(11):1273–1281.
- Shea MK, Benjamin EJ, Dupuis J, et al. Genetic and non-genetic correlates of vitamins K and D. Eur J Clin Nutr. 2009;63(4):458–464.
- Shea MK, Booth SL, Nettleton JA, et al. Circulating phylloquinone concentrations of adults in the United States differ according to race and ethnicity. J Nutr. 2012;142(6):1060–1066.
- Borel P, Desmarchelier C. Bioavailability of fat-soluble vitamins and phytochemicals in humans: effects of genetic variation. Annu Rev Nutr. 2018;38(1):69–96.
- Dashti HS, Shea MK, Smith CE, et al. Meta-analysis of genome-wide association studies for circulating phylloquinone concentrations. Am J Clin Nutr. 2014;100(6):1462–1469.
- Kelly JM, Ordovas JM, Matuszek G, et al. The contribution of lipids in vitamin K biomarker response to vitamin K supplementation. Mol Nutr Food Res. 2019;63(24):e1900399
- Shah S, Bonder MJ, Marioni RE, et al. Improving phenotypic prediction by combining genetic and epigenetic associations. Am J Hum Genet. 2015;97(1):75–85.
- Feinberg AP, Irizarry RA, Fradin D, et al. Personalized epigenomic signatures that are stable over time and covary with body mass index. Sci Transl Med. 2010;2(49):49ra67.
- Amatu A, Sartore-Bianchi A, Moutinho C, et al. Promoter CpG Island hypermethylation of the DNA repair enzyme MGMT predicts clinical response to dacarbazine in a Phase II study for metastatic colorectal cancer. Clin Cancer Res. 2013;19(8):2265–2272.
- Campión J, Milagro FI, Goyenechea E, et al. TNF-α promoter methylation as a predictive biomarker for weight-loss response. Obesity. 2009;17(6):1293–1297.
- Willett WC, Sampson L, Stampfer MJ, et al. Reproducibility and validity of a semiquantitative food frequency questionnaire. Am J Epidemiol. 1985 Jul;122(1):51–65.
- Pei L, Leblanc M, Barish G, et al. Thyroid hormone receptor repression is linked to type I pneumocyte-associated respiratory distress syndrome. Nat Med. 2011;17(11):1466–1472.
- Teske KA, Yu O, Arnold LA. Inhibitors for the Vitamin D receptor–coregulator interaction. Vitam Horm. 2016;100:45–82.
- Uhlen M, Zhang C, Lee S, et al. A pathology atlas of the human cancer transcriptome. Science. 2017;357(6352):eaan2507.
- Kichaev G, Bhatia G, Loh P-R, et al. Leveraging polygenic functional enrichment to improve GWAS power. Am J Hum Genet. 2019;104:65–75.
- Booth SL, Dallal G, Shea MK, et al. Effect of Vitamin K supplementation on bone loss in elderly men and women. J Clin Endocrinol Metab. 2008;93(4):1217–1223.
- Shearer MJ, Fu X, Booth SL, et al. Nutrition, metabolism, and requirements: current concepts and future research. Adv Nutr. 2012;3(2):182–195.
- Ellis JL, Fu X, Al Rajabi A, et al. Plasma response to deuterium-labeled Vitamin K intake varies by TG response, but not age or Vitamin K status, in older and younger adults. J Nutr. 2019;149(1):18–25.
- Davis HR, Zhu L, Hoos LM, et al. Niemann-Pick C1 Like 1 (NPC1L1) Is the intestinal phytosterol and cholesterol transporter and a key modulator of whole-body cholesterol homeostasis. J Biol Chem. 2004;279(32):33586–33592.
- Narushima K, Takada T, Yamanashi Y, et al. Niemann-Pick C1-Like 1 mediates -tocopherol transport. Mol Pharmacol. 2008;74(1):42–49.
- Takada T, Yamanashi Y, Konishi K, et al. NPC1L1 is a key regulator of intestinal vitamin K absorption and a modulator of warfarin therapy. Sci Transl Med. 2015;7(275):275ra23.
- Hannon E, Gorrie-Stone TJ, Smart MC, et al. Leveraging DNA-methylation quantitative-trait loci to characterize the relationship between methylomic variation, gene expression, and complex traits. Am J Hum Genet. 2018 Nov;103(5):654–665.
- Harshman SG, Finnan EG, Barger KJ, et al. Vegetables and mixed dishes are top contributors to phylloquinone intake in US adults: data from the 2011-2012 NHANES. J Nutr. 2017;147(7):1308–1313.
- Shea M, Booth S. Concepts and controversies in evaluating Vitamin K status in population-based studies. Nutrients. 2016;8(1):8.
- Shearer MJ, Okano T. Key pathways and regulators of Vitamin K function and intermediary metabolism. Annu Rev Nutr. 2018;38(1):127–151.
- Sokoll LJ, Booth SL, Davidson KW, et al. Diurnal variation in total and undercarboxylated osteocalcin: influence of increased dietary phylloquinone. Calcif Tissue Int. 1998;62(5):447–452.
- Gundberg CM, Lian JB, Booth SL. Vitamin K-dependent carboxylation of osteocalcin: friend or foe? Adv Nutr. 2012;3(2):149–157.
- Davidson KW, Sadowski JA. Determination of vitamin K compounds in plasma or serum by high-performance liquid chromatography using postcolumn chemical reduction and fluorimetric detection. Methods Enzymol. 1997;282:408–421.
- Gundberg CM, Nieman SD, Abrams S, et al. Vitamin K status and bone health: an analysis of methods for determination of undercarboxylated osteocalcin. J Clin Endocrinol Metab. 1998;83(9):9.
- Pidsley R, Wong Y, Volta CC, et al. LC. A data-driven approach to preprocessing illumina 450K methylation array data. BMC Genomics. 2013;14(1):293.
- Aryee MJ, Jaffe AE, Corrada-Bravo H, et al. Minfi: a flexible and comprehensive bioconductor package for the analysis of Infinium DNA methylation microarrays. Bioinformatics. 2014;30(10):1363–1369.
- Fortin J-P, Triche TJ, Hansen KD. Preprocessing, normalization and integration of the illumina humanMethylationEPIC array with minfi. Bioinformatics. 2017;33(4):558–560.
- Teschendorff AE, Marabita F, Lechner M, et al. A beta-mixture quantile normalization method for correcting probe design bias in illumina infinium 450 k DNA methylation data. Bioinformatics. 2013;29(2):189–196.
- Houseman EA, Accomando WP, Koestler DC, et al. DNA methylation arrays as surrogate measures of cell mixture distribution. BMC Bioinformatics. 2012;13(1):86.
- Lehne B, Drong AW, Loh M, et al. A coherent approach for analysis of the illumina humanmethylation450 Beadchip improves data quality and performance in epigenome-wide association studies. Genome Biol. 2015;16(1):37.
- Citing R: R Core Team. R: A language and environment for statistical computing. R Foundation for Statistical Computing. Vienna, Austria; 2017. Available from: https://www.R-project.org/.
- Lamon-Fava S, Sadowski JA, Davidson KW, et al. Plasma lipoproteins as carriers of phylloquinone (vitamin K1) in humans. Am J Clin Nutr. 1998;67(6):1226–1231.
- Erkkilä AT, Lichtenstein AH, Dolnikowski GG, et al. Plasma transport of vitamin K in men using deuterium-labeled collard greens. Metabolism. 2004;53(2):215–221.
- Crosier MD, Shea KM, Ordovas JM, et al. Apolipoprotein E genotype is a determinant of serum vitamin K, but not BMD, in older men and women. J Bone Miner Res. 2005;20:S343.
- Pederson BS, Scwartz DA, Yang IV, et al. Comb-p: software for combining, analyzing, grouping and correcting spatially correlated P-values. Bioinformatics. 2012;28(22):2986–2988.
- Kechris KJ, Biehs B, Kornberg TB. Generalizing moving averages for tiling arrays using combined P-value statistics. Stat Appl Genet Mol Biol. 2010;9:Article29.
- Sidak Z. Rectangular confidence regions for the means of multivariate normal distributions. J Am Stat Assoc. 1967;62(318):626–633.