
ABSTRACT
Post-translational modifications on nucleosomal histones represent a key epigenetic regulatory mechanism to mediate the complex gene expression, DNA replication, and cell cycle changes that occur in embryonic cells undergoing lineage specification, maturation, and differentiation during development. Here, we investigated the dynamics of 13 key histone marks in epidermal cells at three distinct stages of embryonic skin development and identified significant changes that corresponded with the maturation of the proliferative basal epidermal cells and terminally differentiated cells in the stratified layers. In particular, H3K4me3 and H3K27ac were accumulated and became more prominent in the basal cells at later stages of epidermal development, while H3K27me3 was found to be low in the basal cells but highly enriched in the differentiated suprabasal cell types. Constitutive heterochromatin marked by H4K20me3 was also significantly elevated in differentiated epidermal cells at late gestation stages, which exhibited a concomitant loss of H4K16 acetylation. These differential chromatin profiles were established in the embryonic skin by gestation day 15 and further amplified at E18 and in postnatal skin. Our results reveal the dynamic chromatin states that occur as epidermal progenitor cells commit to the lineage and differentiate into the different cells of the stratified epidermis and provide insight to the underlying epigenetic pathways that support normal epidermal development and homoeostasis.
Introduction
In the course of embryogenesis, every organ or tissues in the organism develops from stem or progenitor cells, which, in response to complex spatiotemporal cell-to-cell signals, commit to specific cellular lineages. They adopt specialized identities, become restricted in their ability to continue proliferation and eventually acquire terminal functionality. This process of lineage commitment, maturation, and cellular differentiation is accompanied by key regulated changes in the nuclear structure and chromatin organization that affect chromatin-templated processes such as transcription, DNA replication, and chromosome segregation. In particular, combinatorial post-translational modifications (PTMs) to the N- and C-terminal tails of histones are known to code for specific functional chromatin states [Citation1,Citation2]. Some PTMs, such as acetylation of histone H3 lysine 27 (H3K27ac) or histone H4 lysine 16 (H4K16ac), trimethylation of histone H3 lysine 4 (H3K4me3) and lysine 27 (H3K27me3), are enriched over promoters and enhancer regions and have been shown to elicit direct effects on transcriptional initiation through interactions with transcription factors and chromatin remodellers [Citation3,Citation4]. Others, such as phosphorylation of H3 serine 28 (H3S28ph) and monomethylation of H4 lysine 20 (H4K20me1), mark mitotic chromosomes and function in regulating chromosomal condensation and cell cycle progression [Citation5–Citation7].
To date, more than 70 different PTMs on the nucleosomal histones have been characterized and the list of biologically important histone modifications continues to expand as new PTMs and their functions are identified [Citation8]. Many of these histone modifications are highly dynamic and are added or erased to mediate different cellular processes [Citation9]. Dynamic combinatorial PTM changes resulting in distinctive epigenomic profiles can, therefore, be considered major determinants of the specific shifts in gene expression programmes and proliferative capacity acquired by different cells [Citation10,Citation11]. Hence, tracking the dynamic combinatorial patterns of these histone marks during embryonic development as progenitor cells undergo lineage specification, maturation, and differentiation would broaden our understanding of key processes that have to change in order for these cells to adopt new and different functionalities.
In the mouse, epidermal formation begins at around embryonic day E9, when the epidermal cells become specified by a complex cross-talk of WNT, EDA, and BMP signalling [Citation12,Citation13]. In the E13 embryo, a single layer of epidermal cells that express basal cell-specific keratin intermediate filaments, Keratin-14 (K14) and Keratin-5 (K5) can be detected [Citation14]. Epidermal stratification is initiated at around E14.5, when the proliferative K14-positive basal cells divide either symmetrically to re-populate the basal layer, or asymmetrically to give rise to daughter cells that form the suprabasal layers [Citation15]. These cells undergo a step-wise terminal differentiation programme, first forming 2–3 layers of spinous cells located above the basal layer in the partially stratified E15 epidermis. The spinous cells continue to differentiate into another 2–3 layers of granular cells that eventually form the topmost cornified cell layers. At E18, the mouse epidermis is fully formed with several suprabasal layers of terminally differentiating cells that have exited the cell cycle and a single layer of progenitor-like, K14-positive basal cells [Citation16–Citation18]. These basal cells retain proliferative capacity which is essential for epidermal homoeostasis in the adult mice [Citation19].
Epidermal cell differentiation has been shown in several studies to be regulated by chromatin modifying mechanisms. Knockout of histone deacetylases Hdac1 and Hdac2, resulting in histone deacetylation at p63-repressed promoter regions, led to a loss of epidermal stratification [Citation20]. Conditional deletion of Ezh2 or Jarid2, required for H3K27 trimethylation, in epidermal cells resulted in de-regulated and accelerated differentiation [Citation21,Citation22], while loss of the JMJD3 histone demethylase led to enhanced basal cell proliferation and poorly differentiated suprabasal layers [Citation23]. Additionally, Jhdm1d, a H3K9me3 and H3K27me3 demethylase, was also identified in a screen for genes required for maintaining epidermal homoeostasis in adult mice [Citation24]. While these studies alluded to the functional importance of these histone modifying enzymes, it is not clear how the specific histone modifications are dynamically correlated to the proliferative or differentiated cell state during normal skin development. Combinatorial PTM conversions in the epigenome that may be linked to or reflect essential changes in cellular processes and functions within the different epidermal cell types have also not been comprehensively characterized.
In this study, we examined dynamic shifts in the global enrichment of 13 chromatin modifications with well-characterized roles in transcriptional and cell cycle regulation, in the different epidermal cells present at three distinct stages of embryonic skin development. Our results revealed major changes in the global levels of H3K4me3, H3K27ac, H3K27me3, H4K20me1, H4K20me3, and H4K16ac in the maturing and differentiating epidermal cells, yielding distinctive combinational epigenomic hallmarks that differentially mark the proliferative basal cells and terminally differentiated cells of the stratified epidermis.
Results
Mapping global changes in chromatin marks corresponding to different cell states in the developing embryonic epidermis
To identify hallmarks of the epidermal cell epigenome that correlate with changes in lineage commitment and differentiation, we carried out a systematical characterization of global histone modification profiles at three distinct epidermal development stages. Mouse embryonic skin were collected at embryonic day E13, E15, and E18, representing early, mid, and late epidermal development, and assessed, by immunofluorescence staining, a panel of histone modifications to evaluate the global epigenome changes. Skin sections of the three developmental stages were stained as a set in parallel for a specific histone mark and the basal epidermal cell marker, Keratin14 (K14). The sections were imaged by confocal microscopy using fixed optimized laser settings to facilitate comparisons of immunofluorescence intensities within and across samples ()). This analysis was used to examine how dynamic changes in histone modifications in the K14-positive basal cells at each development stage may reflect the global epigenomic alterations that occur in response to commitment and maturation of the epidermal progenitor cells from E13 to E18. At E15 and E18 stages where the epidermis has undergone cellular differentiation giving rise to K14-negative suprabasal cells, we also quantified the histone modification levels between the K14+ basal and K14− suprabasal cells to investigate the epigenomic changes that correspond to epidermal cell differentiation.
Figure 1. Immunofluorescence-based assay to analyse global histone modification changes during epidermal maturation and differentiation. (a) Dorsal skin tissues harvested at embryonic day 13, 15 and 18 were co-stained by immunofluorescence and imaged for specific histone modifications and K14. Mean fluorescence intensity of the histone modification per nucleus was quantified for comparative analyses of global chromatin changes in basal cells across development stages (‘Development’) and between basal and suprabasal cell types (‘Differentiation’). (b, c) Representative set of immunofluorescence images of E13, E15, and E18 epidermis co-stained for K14 and panH3 or panH4. Scale = 25 μm. (d) Mean panH3 or panH4 fluorescence intensity per nucleus in basal cells of E13, E15, and E18 epidermis. Bars show the median and interquartile range. 469–480 nuclei in 6 replicate experiments were analysed per condition. n.s: not significant; one-way ANOVA Sidak’s multiple comparison test. (e) Mean panH3 or panH4 fluorescence intensity per nucleus in K14-positive basal cells (b) and K14-negative suprabasal (SB) cells in E18 epidermis. Bars show the median and interquartile range. 440–480 nuclei in 6 biological replicate experiments were analysed per condition. n.s: not significant; two-tailed unpaired t-test.
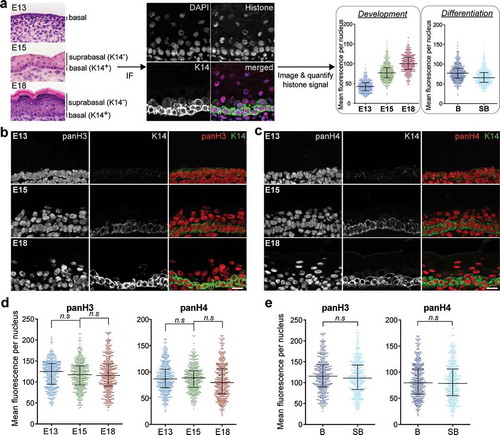
Although the samples were stained with DAPI to allow demarcation of the cell nuclei, the intensity of DAPI staining was highly variable in our experimental system and was not used for signal normalization. To establish the validity of the experimental conditions and signal quantification, we first analysed the staining patterns of total H3 and H4 in the epidermis of E13, E15, and E18 skin, which were not expected to differ significantly between cell state or across development stages. As shown in , the staining patterns for total H3 and H4 were relatively consistent in all epidermal cells across the three developmental stages, with slightly more variations at E18. Nuclear signal intensities for panH3 and panH4 were quantified from 12 images collected from 3 to 6 independent sets of experiments and plotted, revealing a normal distribution of all positively stained nuclei. No significant differences in both the spread and the mean intensities of total H3 and H4 in the basal cells in E13, E15, and E18 ()), or between basal and suprabasal cells ()) were observed. These results provided validation of the methodology and quantitative analysis to support further investigation into global epigenomic changes associated with epidermal development and differentiation.
Active histone modifications accumulate in basal epidermal cells but decrease upon differentiation
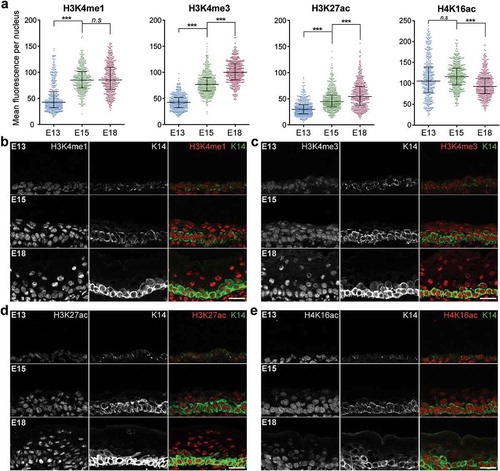
Using this assay, we analysed whether histone modifications that are enriched at promoter and enhancer regions and associated with transcriptional regulation are distinctively altered with maturation of the epidermal basal cell lineage [Citation25]. We found the global levels of mono- and tri-methylated H3 (H3K4me1, H3K4me3) and acetylated H3K27 (H3K27ac), which have strong associations with transcriptional activation at promoter and enhancer regions, were low in the K14+ epidermal cells at E13 but high in the maturing epidermis from E15 to E18 ()). The most overt increase was observed for H3K4me1 between basal cells at E13 and E15, while both H3K4me3 and H3K27ac showed progressively stronger staining across development stages from E13 to E18. However, not all chromatin modifications at active promoters exhibited the same trend. In addition to H3K4me1, H3K4me3, and H3K27ac, we also characterized the levels of acetylated H3K18, H4K12, and H4K16 in the embryonic epidermal cells. Monoacetylated H4K16 (H4K16ac) was reported to be enriched at active gene promoters but mark a distinct set of enhancers compared to H3K27ac in embryonic stem cells [Citation26], and directly impact transcriptional outcomes in yeast and Drosophila [Citation27,Citation28]. We found that, in contrast to H3K4me1, H3K4me3, and H3K27ac, the mean nuclear level of acetylated H4K16 was already high in the E13 epidermal basal cells and decreased in the K14+ cells at E18 (). We also examined the profiles of H3K18ac and H4K12ac marks which, while enriched at transcription start sites, have less defined impact on transcriptional activation than H3K4me3 and H3K27ac. These marks were also found to have the highest median staining intensity in the E13 basal cells and became less enriched in the epidermal cells at later development stages (Fig S1a). We also observed a similar trend for trimethylated H3K36 (H3K36me3), which is typically present at actively transcribed gene regions, while that of H3K9ac showed stronger enrichment in the K14+ basal cells only in the E18 epidermis (Fig S1a). These results revealed the major shifts in the chromatin status in the stem-like basal cells, which appear to acquire, in particular, more H3K4me3 and H3K27ac positive loci, as the embryonic epidermis develops.
Figure 2. Histone modifications associated with active promoters become enriched in basal cells as skin develops. (a) Mean fluorescence intensity per nucleus in basal cells of E13, E15, and E18 epidermis for H3K4me1, H3K4me3, H3K27ac, or H4K16ac. Bars show the median and interquartile range. 400–480 nuclei in 6 replicate experiments were analysed per condition. ***p < 0.0001, n.s: not significant; one-way ANOVA Sidak’s multiple comparison test. (b–d) Images of E13, E15, and E18 epidermis co-stained for K14 and histone H3K4me1, H3K4me3, H3K27ac, or H4K16ac. For each histone mark, representative images from a single set of experiments are shown. Scale = 25 μm.
To examine how these chromatin states change when basal epidermal cells terminally differentiate into the spinous and granular cells of the suprabasal layers of the epidermis, we quantified and compared the levels of these histone modifications in the K14+ basal cells with the K14- suprabasal cells in the E15 and E18 tissues. We found that most of these active histone modifications were decreased in the suprabasal cells compared to the basal cells, while two of the eight probed, H3K18ac and H3K36me3, remained consistent between the K14+ and K14- cells at both developmental stages (Fig S1b). H3K4me3, H3K27ac, H3K9ac, H4K12ac and H4K16ac were all significantly lower in the suprabasal cells at E15 and E18, while H3K4me1 was decreased in the differentiated cell layer in the E15 but not E18 epidermis (); Fig S1b).
Figure 3. Specific active histone marks are lower in differentiated epidermal cells. (a) Mean fluorescence intensity per nucleus in basal (b) versus suprabasal (SB) cells in E15 and E18 epidermis for H3K4me1, H3K4me3, or H3K27ac. Bars show the median and interquartile range. 357–480 nuclei were analysed per condition. ***p < 0.0001, n.s: not significant; two-tailed unpaired t-test. (b) Mean fluorescence intensity per nucleus in basal versus suprabasal cells for H4K16ac. 442–480 nuclei were analysed per condition. ***p < 0.0001; two-tailed unpaired t-test. (c) Images of E15, E18, and postnatal day 6 (PN6) epidermis stained for H4K16ac, DAPI, and K14. Yellow arrows point to suprabasal cells with very low or undetectable H4K16ac fluorescence. Scale = 25 μm.
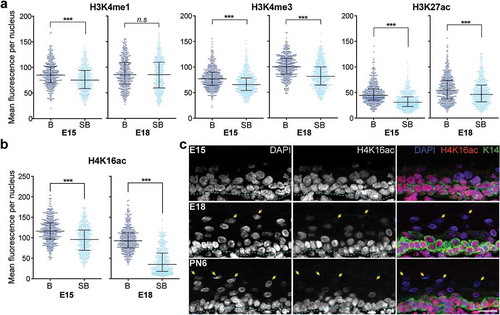
Of the modifications found decreased in the suprabasal epidermis, the drop in H4K16ac levels upon cellular differentiation was most distinct in the E18 epidermis in which almost all the suprabasal cells had pronouncedly low or undetectable H4K16ac staining compared to the basal cells ()). We observed that while there was already a discernible decrease in the level of H4K16ac in the spinous cells immediately above the basal cells in the E15 epidermis, staining for H4K16ac was sharply decreased in the spinous cells by E18 and was almost undetectable in the topmost layer of granular cells ()). To further ascertain the association of H4K16ac loss with terminal epidermal differentiation, we stained for H4K16ac in fully stratified postnatal skin tissues of 6-day-old pups. We found that while all K14+ cells in the PN6 epidermis were also strongly positive for H4K16ac, only 20% of the K14-suprabasal cells stained weakly, and no nuclei in the topmost cell layer of the epidermis was positive for the mark ()). By contrast, immunostaining of PN6 skin with panH4, H4K12ac or H3K27me3 antibodies resulted in strong fluorescence signals in the basal as well as the spinous and granular suprabasal cells (Fig S2). Thus, the lack of H4K16ac staining in the granular cell layer reflected a specific depletion of this modification, not a general loss of chromatin in these cells. Of note, none of these active histone marks tested were enriched in the differentiated epidermal cells. Together, our results reveal a significant correlation of epidermal cell differentiation with a decrease in these active chromatin modifications, particularly that of acetylated H4K16 marked loci which is largely depleted in the mature terminally differentiated epidermal cells.
Repressive H3K27me3 is low in maturing basal cells and become progressively enriched upon epidermal cell differentiation
In addition to the histone modifications associated with transcription activation, we also analysed enrichment profiles of key marks of gene repression or silencing, namely trimethylated H3K27, trimethylated H3K9, and trimethylated H4K20. In contrast to H3K4me3 and H3K27ac which were increased in the K14+ cells as the epidermis develops, the mean staining intensity for H3K27me3 in the basal cells was found to be highest at E13 and decreased at the later E15 and E18 stages of development (). When H3K27me3 levels in basal and suprabasal cells in the same tissue were analysed, we observed a marked increase in the amount of H3K27me3 staining in the suprabasal compared to the basal cells in the E15 epidermis. We also found that accumulation of H3K27me3 in the K14- suprabasal cells was further intensified in the E18 epidermis (). These results revealed distinct differences in the dynamics of active and repressive chromatin loci, marked by H3K4me3/H3K27ac and H3K27me3, respectively, as epidermal cells mature and differentiate. We further found that these differences were maintained in the fully stratified newborn skin in which the suprabasal, but not the basal, cells stained strongly positive for H3K27me3. This is in contrast to the levels of H3K4me3, which was highest in the K14+ basal layer with weaker staining observed in the topmost layer of suprabasal cells ()).
Figure 4. H3K27me3 is highly enriched in differentiated suprabasal cells. (a) Mean fluorescence intensity per nucleus in basal cells of E13, E15, and E18 epidermis for H3K27me3. Four hundred and eighty nuclei were analysed per condition. Bars show the median and interquartile range. ***p < 0.0001, n.s: not significant; one-way ANOVA Sidak’s multiple comparison test. (b) Images of a set of E13, E15, and E18 epidermis stained for K14 and histone H3K27me3. Scale = 25 μm. (c) Mean fluorescence intensity per nucleus in basal versus suprabasal cells in E15 and E18 epidermis for H3K27me3. Bars show the median and interquartile range. 459-480 nuclei were analysed per condition. ***p < 0.0001; two-tailed unpaired t-test. (d) Representative images of PN1 epidermis stained for H3K4me3, H3K27me3, or panH3. Scale = 25 μm. (e) Normal adult human epidermis stained for H3K27me3 or panH3. Scale = 25 μm. (f) Quantification of mean fluorescence intensity per nucleus of H3K27me3 or panH3 staining in basal versus suprabasal cells in normal adult human epidermis, N = 40 per condition. Statistical analysis performed using two-tailed unpaired t-test, n.s: not significant. (g) Western blots for specific histone H3 modifications in immortalized human keratinocytes (N/TERT) after 0, 2 and 4 days, and primary human keratinocytes (NHEK) after 0, 4 and 6 days, of induced differentiation (diffn). (h) Quantification of immunoblot signals relative to Day 0 of differentiation after normalization to panH3. n = 4 for N/TERT and n = 2 for NHEK. Bars show standard deviation. *p < 0.05, two-tailed paired t-test.
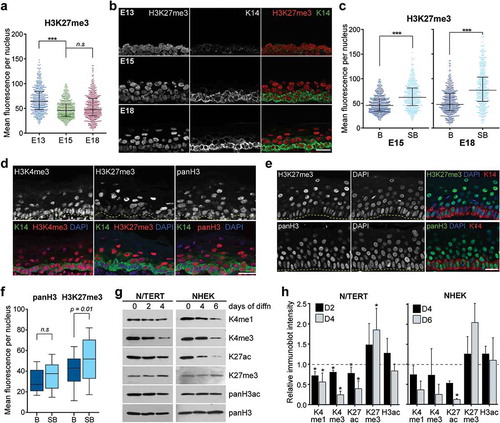
To further demonstrate the correlation of H3K27me3 enrichment and epidermal differentiation, we examined whether differential levels of H3K27me3 in basal and suprabasal cells are also present in the human epidermis. We thus performed immunostaining on normal adult human skin for H3K27me3 or panH3, as well as DAPI and KRT14, and found that while there were no distinguishable differences in total H3 levels between nuclei in the basal and suprabasal layers, H3K27me3 was highly enriched in a significant portion of the suprabasal cells (). To corroborate these results, we probed for changes in the chromatin modifications in in vitro differentiated human keratinocytes (N/TERT) at different timepoints of induced differentiation. Global de-acetylation of histone H3 and H4 was previously reported for human keratinocytes induced to differentiate by restricting cell adhesion [Citation29]. Total H3 acetylation loss was also observed by day 4 of induced differentiation resulting from high cell density and calcium ion concentration in our system, indicating that H3 deacetylation is characteristic of epidermal cell differentiation. Furthermore, we found that the global levels of H3K4me3 and H3K27ac were markedly decreased by up to twofold after 4 days of induced differentiation while H3K27me3 levels were increased after 2 days and further accumulated in the Day4 differentiated keratinocytes (). These chromatin changes were also detected in primary normal human epidermal keratinocytes (NHEKs), with similar degrees of H3K4me3 and H3K27ac losses and H3K27me3 gains observed in the primary cells differentiated for 4 and 6 days. These dynamic changes in differentiating keratinocytes in vitro are consistent with the enrichment patterns of these histone modifications observed in the mouse and human epidermis. Hence, the acquisition of high global levels of trimethylated H3K27 appears to be a hallmark of epidermal differentiation, while undifferentiated basal cells are correlated with higher levels of H3K4me3 and acetylated H3K27 and low H3K27me3 chromatin content.
H4K20me3, but not H3K9me3, differentially mark heterochromatin in differentiated, specialized cell types in the skin
Given the distinct accumulation of the repressive H3K27me3 in the suprabasal cells of the epidermis, we sought to examine if other key chromatin marks of gene inactivation, H3K9me3, and H4K20me3, were similarly enriched to reflect a terminally differentiated epidermal cell state. In the E15 and E18 mouse epidermis, H3K9me3 was observed to mark both constitutive heterochromatin foci and more diffused euchromatin in the nucleus (). Upon quantification, we found the global levels of H3K9me3 to be normally distributed in all cells and not significantly different between the basal and suprabasal cells in both E15 and E18 epidermis. As global H3K9me3 content appears unchanged, alteration in the genomic distribution of H3K9me3 is likely a major mechanism in H3K9me3-mediated gene regulation in these cells.
Figure 5. H4K20me3, not H3K9me3, is distinctly enriched in specific cell populations in the embryonic skin. (a) Enrichment pattern of H3K9me3 in E15 and E18 epidermis shown by representative immunofluorescence images and mean fluorescence intensity per nucleus of basal versus suprabasal cells. *p < 0.01, n.s: not significant; two-tailed unpaired t-test. Bars show the median. (b) Enrichment pattern of H4K20me3 in E15 and E18 epidermis shown by representative immunofluorescence images and mean fluorescence intensity per nucleus of basal versus suprabasal cells. ***p < 0.0001, n.s: not significant; two-tailed unpaired t-test. Bars show the median. (c) Normalized number of H4K20me3-positive foci per nucleus of basal versus suprabasal cells. Thirty-five nuclei were analysed per condition. Total foci count per nucleus was normalized to the average nuclear area (50μm2) of all counted nuclei. n.s: not significant; two-tailed unpaired t-test. Bars show the mean and 95% confidence intervals. (d) Mean fluorescence intensity of each H4K20me3 foci in basal versus suprabasal cells of E18 epidermis. ***p < 0.0001; two-tailed unpaired t-test. Bars show the median. (e) 3D-SIM super-resolution image of H4K20me3 foci in basal and suprabasal cells. Dotted lines demarcate the nuclear periphery. Scale = 2 μm. Insert shows enlarged view of a H4K20me3 foci in the suprabasal cell nucleus. (f) Enrichment of H4K20me3 and H3K9me3 in the E18 dorsal skin. Dotted lines outline the hair follicles, arrows point to the dermal papilla cells (yellow) and the hair bulb cells (cyan). Scale = 25 μm.
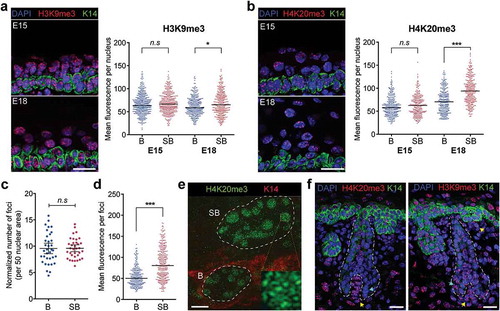
Compared to H3K9me3, the staining pattern of H4K20me3 in the embryonic epidermis was predominantly restricted to the constitutive heterochromatin foci, which were very intensely stained and precluded practical detection of euchromatin staining, if any, in the assay ()). We further found that the mean nuclear level of H4K20me3 was manifestly higher in the differentiated suprabasal cells in the E18, but not E15, epidermis, indicating that, in addition to H3K27me3, these cells also acquire more H4K20me3-marked heterochromatin as they differentiate into mature terminal cell types.
To determine whether the increase in H4K20me3 resulted from the formation of more heterochromatin foci or the spread of existing heterochromatic regions, we quantified the number of foci detected in each nucleus and the mean fluorescence intensity of each foci. An average count of 9 to 10 foci per nuclear plane, normalized to an average area of 50μm2, in both basal and suprabasal cells was obtained, suggesting that cellular differentiation did not result in significantly more H4K20me3-marked foci ()). However, the fluorescence intensity of the H4K20me3 foci, while more variable, was distinctly higher in the suprabasal nuclei and more than 79% of these foci had signal intensities greater than the median staining intensity in the basal nuclei ()). These observations are suggestive of increased H4K20me3 modifications in existing constitutive heterochromatic regions, which we further investigated by performing 3D-structured illumination microcopy super-resolution imaging to reveal the finer structures of H4K20me3-marked heterochromatin foci in the two cell types. From the reconstructed super-resolution images, it was evident that each heterochromatin foci was made up of an aggregation of individual H4K20me3-positive loci ()). Consistent with the notion of H4K20me3 heterochromatin spreading, we observed that each aggregate in the suprabasal cell nuclei contained markedly more H4K20me3-positive loci than those in the basal nuclei, while no overt differences in the number of these aggregated foci were found in the two cell types. These findings thus support a model in which the basal progenitor cells with higher epigenomic plasticity maintain low constitutive heterochromatin content and upon terminal differentiation, acquired additional H4K20me3-modified nucleosomes to expand the heterochromatin domains to effect gene repression and silencing.
Incidentally, we also observed intense H4K20me3 heterochromatin foci in another differentiated specialized cell type in the E18 embryonic skin. We found that the dermal papilla cells located at the base of guard hair follicles, which are specialized mesenchymal cells required for hair follicle formation and growth, exhibited very intensely stained H4K20me3-marked heterochromatin foci (); Fig S3). By contrast, the progenitor-like hair follicle bulb cells surrounding the dermal papilla cluster had much lower levels of H4K20me3. Furthermore, we found H3K9me3 enrichment to be similar between the two populations of cells (); Fig S3). These observations were highly reminiscent of the differential enrichment of H4K20me3, but not H3K9me3, marked heterochromatin observed between abutting undifferentiated and differentiated cells in the epidermis. This led us to examine whether other euchromatic histone modifications that were distinctly enriched between the basal and suprabasal epidermal cells exhibited similar patterns of enrichment in the hair bulb and dermal papilla cells. Aside from H3K4me3, which appeared to be slightly elevated in the dermal papilla cells, no major differences in the global levels of H3K27me3, H3K27ac and H4K16ac in the two cell types in the E18 skin were detected (Fig S3). Taken together, these results suggest that differential regulation of heterochromatin structure and content, particularly by H4K20me3 modification, may be an important hallmark of progenitor and terminally differentiated cell types in the embryonic skin.
High levels of H4K20me1 may mark actively cycling cells in the basal layer of the embryonic epidermis
While the H4K20me3 modification is associated with gene silencing and particularly enriched in constitutive heterochromatin foci, the two other H4K20 methylation states, H4K20me1 and H4K20me2, have reported roles in cell cycle and DNA replication and repair processes [Citation30]. The major gain in H4K20me3 observed in differentiated epidermal cells led us to examine whether levels of H4K20me1 or H4K20me2 were also significantly altered in basal and suprabasal cells in a manner that reflected the differential proliferative capacities of these cells. We found that H4K20me2 stained the nuclei uniformly and presented very similar mean intensities in the basal cells across the three developmental stages as well as between the basal and suprabasal cells (–)).
Figure 6. High levels of H4K20me1 mark actively cycling cells in the basal layer of embryonic epidermis. (a) Representative images of E13, E15, and E18 epidermis co-stained for K14 (green), DAPI (blue) and histone H4K20me1 or H4K20me2 (red). Yellow arrows mark nuclei in the basal layer with intense levels of H4K20me1. Scale = 25 μm. (b) Mean fluorescence intensity per nucleus in basal cells of E13, E15, and E18 epidermis for H4K20me1 and H4K20me2. 346–480 nuclei were analysed per condition. n.s: not significant; one-way ANOVA Sidak’s multiple comparison test. Bars show the median and interquartile range. (c) Mean fluorescence intensity per nucleus in basal versus suprabasal cells in E15 and E18 epidermis for H4K20me1 and H4K20me2. Bars show the median. Dotted line demarcates the H4K20me1 75th percentile mean intensity (73.92) of basal cells at E18. (d) Proportion of basal cells positive for Ki67, high H4K20me1 or both at E13, E15, and E18. One hundred and eighty nuclei were analysed per condition. (e) Percentage of H4K20me1hi nuclei positive or negative for phosphoH3 in the E13, E15, and E18 basal epidermis. N = number of H4K20me1hi nuclei analysed at each stage.
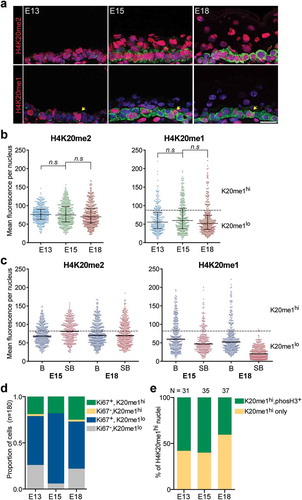
In contrast to the normal distribution obtained for H4K20me2+ nuclei, we were able to discern two distinct populations of H4K20me1+ nuclei in the basal cells. While the majority of the nuclei had low levels of H4K20me1, we observed nuclei in the basal epidermal layer that were intensely positive for the modification at all three developmental stages (). These high H4K20me1-positive nuclei, which we defined as having mean fluorescence intensity above the 75th percentile (73.92) of basal cells at E18, were found to be predominantly present in the basal layer ()). In the E15 epidermis, 37% of basal nuclei were highly positive for H4K20me1 compared to 20% of the suprabasal nuclei. In the E18 epidermis, the high H4K20me1 staining became restricted to the basal layer where 19% of the basal nuclei were strongly positive while <1% of suprabasal nuclei were above the mean intensity threshold ()).
As H4K20me1 has been shown to oscillate with the cell cycle and reported to peak at M phase, we hypothesized that the higher H4K20me1 staining may be marking the subset of cells that are cycling in the G2/M phase at the various timepoints of skin development. To correlate high H4K20me1 levels with cell proliferation in these tissues, we co-stained the E13, E15, and E18 epidermis for H4K20me1 and either Ki67, a general marker of proliferative cells, or the mitosis marker Ser10 phosphorylated H3 (phosphoH3). As expected of embryonic tissues, more than 70% of the basal cells at every developmental stage were proliferative and positive for Ki67. Consistent with a correlation of high H4K20me1 with cycling cells, we found that more than 90% of H4K20me1hi nuclei were also Ki67-positive (), Fig S4). Furthermore, ~60% of these H4K20me1hi nuclei were also positive for phosphoH3 at E13 and E15, while ~40% of them were double positive at E18 (), Fig S4). These results showed good correlation of high H4K20me1 with markers of cell proliferation, and support the notion that H4K20me1hi nuclei marked the subset of actively cycling cells in the G2/M phase in the basal epidermal layer; and the decrease in the number of H4K20me1hi nuclei in the suprabasal cell layers corresponded to the diminished proliferative capacity of these cells.
Discussion
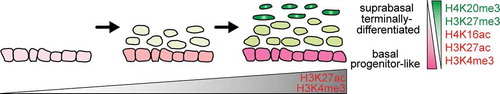
In this study, we have used a systematic approach to characterize global patterns of key chromatin modifications in embryonic epidermal cells and examine how they are altered during lineage maturation and terminal differentiation. As the epidermis developed from a simple epithelium at E13 to a stratified tissue containing terminally differentiated cell types at E18, the basal cells acquired more active chromatin modifications such as H3K4me3 and H3K27ac while these modifications are decreased and key repressive modifications, H3K27me3 and H4K20me3, increased upon differentiation into suprabasal cells (). The dynamic changes in chromatin modifications that occur during the embryonic epidermal formation process thus result in distinctive epigenomic profiles that differentially mark the progenitor-like basal cells and terminally differentiated cells of the suprabasal layers. In the fully stratified epidermis, basal cells are distinguished by high levels of H3K27ac, H3K4me3, and H4K16ac, and low H3K27me3 and H4K20me3, while suprabasal cells are marked by high H3K27me3 levels, expanded H4K20me3 heterochromatin foci and loss of H4K16ac.
Figure 7. Dynamic changes in histone marks distinguish basal and suprabasal cells of the epidermis across development. Schematic representation of key chromatin modification changes observed in the developing epidermis as the cells mature and undergo terminal differentiation to form a stratified epithelium.
The difference in the global levels of H4K16ac between the basal and suprabasal epidermal cells, especially the degree of hypoacetylation observed in the granular cells, was particularly striking and suggestive of a role for H4K16ac-mediated mechanism in controlling the balance between proliferation and differentiation during skin development and regeneration. In cultured cells, H4K16ac levels were shown to fluctuate with the cell cycle, with the highest levels observed at S and early G2/M phases and lowest at G1 [Citation31]. In our analysis, we did not detect subsets of basal cells with distinctive H4K16ac levels that might correlate with the different phases of the cell cycle. However, the substantial H4K16 hypoacetylation observed in the suprabasal cells, particularly in the later stages of epidermal maturation at E18 and PN6, is highly congruent with the cell cycle exit of terminally differentiated keratinocytes. In mammalian cells, acetylation of H4K16 is mediated by a multisubunit complex consisting of a histone acetyltransferase KAT8 and three co-factors MSL1, MSL2, and MSL3, while deacetylation is facilitated by the Sirtuin 2 (SIRT2) deacetylase [Citation31,Citation32]. We surveyed published RNA-seq transcriptomes of purified embryonic day 14.5 and postnatal day 5 epidermal cell populations [Citation33,Citation34] and found that KAT8 and MSL1 transcripts were 40% and 50% lower, respectively, while SIRT2 was 1.7-fold higher in postnatal epidermal cells compared to the embryonic population. These gene expression changes corresponded to the global changes in H4K16ac we have observed, particularly in the postnatal epidermis where there was extensive loss of H4K16ac in the suprabasal cells. Interestingly, akin to our observations that H4K16 hyperacetylation in progenitor-like basal cells is rapidly lost in the differentiated suprabasal cells in the developing epidermis, global loss of H4K16ac and decreased Kat8 expression was also reported upon induced differentiation of mouse embryonic stem cells [Citation26,Citation35]. In addition, multiple primary tumours were found to contain more H4K16ac and KAT8 compared to normal tissues [Citation36]. Taken together, high levels of H4K16ac and KAT8 appear to be hallmarks of these proliferative progenitor and stem-like cells and may function in mediating the self-renewing and proliferative capacity of these cells. Of note, it was recently reported that compared to wildtype cells, fibroblasts derived from patients with mutations in MSL3 have lower H4K16ac levels, grow slower and do not re-enter the cell cycle readily upon release from serum starvation induced growth arrest [Citation37]. However, mechanisms by which high H4K16ac level may control cell proliferation remain to be clearly elucidated. ChIP-sequencing experiments showed H4K16ac to be enriched over the transcription start sites of active genes, and this modification is thought to mediate gene activation by altering chromatin accessibility [Citation26,Citation35,Citation38,Citation39]. Yet, though H4K16ac was identified as a novel marker of active enhancers in embryonic stem cells, direct transcriptional control of cell cycle genes has not been reported [Citation26]. It will also be interesting to examine how cellular differentiation of these stem-like cells may be affected if the deacetylation of H4K16ac is blocked. Notably, SIRT2 has been implicated in driving keratinocyte differentiation and suppressing tumour cell stemness, but whether its effects on these cells are mediated through alteration of H4K16 acetylation status remained to be characterized [Citation40]. In addition, recent findings that hyperacetylation of H4K16 in peripheral neutrophils has no clear functional consequences on cell proliferation and differentiation further raise the question of cell-type specific regulation conferred by this chromatin mark [Citation41]. Thus, future studies, using keratinocyte cultures and conditional Kat8 knockout mouse models, will be necessary to elucidate any functional links between the striking differences in H4K16 acetylation levels in basal progenitors and differentiated suprabasal cells with epidermal development and regeneration.
The extensive gain in H4K20me3-marked constitutive heterochromatin observed in the terminally differentiated suprabasal cells in the E18 epidermis implicates this mode of gene silencing in the regulation of epidermal cell differentiation. As constitutive heterochromatin is predominantly marked by both H3K9me3 and H4K20me3, and tri-methylation of H4K20 is thought to be dependent on H3K9me3 and heterochromatin protein HP1-mediated recruitment of the H4K20me2/3-specific histone methyltransferases, KMT5B and KMT5 C [Citation42–Citation45], we were surprised by the lack of substantial alterations in H3K9me3 levels in the different epidermal cells. These observations are, however, consistent with the absence of apparent changes in H3K9me3 and HP1 levels at pericentric heterochromatin foci that were found to be spatially repositioned in the differentiating suprabasal cells in the footpad epidermis of 10 days old mice [Citation46]. We speculate that the H4K20me3 modification may confer an additional level of gene regulation independent of H3K9me3 that is vital for the terminal differentiation and cell cycle exit of these epidermal cells. In line with this notion, loss of H4K20me3-mediated chromatin silencing has been shown to adversely affect embryonic stem cell differentiation and cell state transitions [Citation47–Citation50]. Embryonic stem cells that are null for SMYD5 (SET and MYND domain-containing protein 5) or both KMT5B and KMT5 C were shown to have decreased H4K20me3, retained stem-like properties and failed to differentiate along expected differentiation trajectories [Citation47,Citation49]. Reduced differentiation capacity of these cells was attributed to conformational perturbation of constitutive heterochromatin, loss of H4K20me3-mediated silencing of repetitive DNA elements and concomitant up-regulated expression of these elements and nearby genes [Citation47–Citation49]. Global increases in H4K20me3-marked heterochromatin have also been reported in cultured cells induced to enter quiescence by serum deprivation, revealing an important link between H4K20me3-dependent heterochromatin compaction and cell cycle exit [Citation51,Citation52]. The increased heterochromatin compaction was proposed to enhance the silencing of DNA repetitive sequences, block ribosomal DNA transcription and inhibit expression of proliferation-associated genes, to facilitate growth arrest while maintaining cell viability [Citation51,Citation53,Citation54]. Whether similar regulatory mechanisms are evoked by increased H4K20me3 constitutive heterochromatin to allow terminal differentiation and cell cycle exit of the epidermal cells remains to be directly addressed. However, the contrasting enrichment of H4K20me3-marked constitutive heterochromatin observed between the mesenchymally derived dermal papilla cells, which have been suggested to be mitotically quiescent [Citation55,Citation56], and the highly proliferative hair bulb cells surrounding the dermal papilla strengthens the hypothesis that H4K20me3-mediated constitutive heterochromatin regulation, uncoupled from changes in H3K9 trimethylation, is an essential aspect of growth arrest and terminal differentiation. This theory is also in line with reported increases of H4K20me3 during skeletal muscle differentiation [Citation57]. Extensive higher-order remodelling and spatial re-organization of nuclear architecture, including active re-distribution of the pericentric heterochromatin has been reported in terminally differentiating keratinocytes [Citation46,Citation58,Citation59]. Functional protein complexes that mediate the interplay between H4K20me3-mediated heterochromatin compaction, higher-order chromatin remodelling and spatial rearrangement of nuclear architecture to coordinate terminal keratinocyte differentiation are also an important aspect to be explored.
This study presents the first methodical characterization of 13 different chromatin modifications functionally associated with different transcriptional states through three distinct stages of embryonic epidermal development in an endeavour to derive epigenomic signatures of cell identity changes that arise during lineage maturation and epidermal differentiation. Our analyses showed that the basal cell epigenome gradually acquires active chromatin marks associated with stem cell plasticity while the levels of most other modifications remain stable, reflecting minor, if any, shifts in cellular identity as these cells mature. In these embryonic tissues, we did not detect subsets of cells with distinct epigenetic profiles that differentiated between stem and transit-amplifying cells, which were reported in the basal layers of the adult mouse epidermis [Citation60]. As expected, major cell identity changes occur when the basal keratinocytes undergo terminal differentiation to form the suprabasal layers of the stratified epidermis. In addition to the previously reported decreases in H3K4me3, panH3ac, and panH4ac in differentiating keratinocytes [Citation29,Citation46], our study highlighted additional chromatin features, including high H3K27me3- and H4K20me3- marked loci and hypoacetylated H4K16, that clearly distinguish the stem-like basal cell epigenome from that of the differentiated keratinocytes. While how transcriptional regulation mediated by H3K4me3 and H3K27me3 influence lineage decisions has been well characterized in many studies, H4K16ac- and H4K20me3-mediated mechanisms that impact epidermal developmental pathways have not been explored. Future investigations into the roles these chromatin modifications play in shaping epidermal fate decisions will add to our mechanistic understanding of the epidermal lineage commitment and skin developmental process. It is also important to note that while global levels of some histone modifications such as H3K9me3 and H3K36me3 were found to be stable in this study, re-distribution of these marks to different loci on the genome could have a major impact on gene expression in the different cell types. Thus, high resolution ChIP-seq mapping of key histone modifications across differentiation timepoints will be necessary to clearly delineate how these modifications may be lost or gained at different genomic loci to regulate gene expression and cell fate changes. Finally, the clear categorization of epigenomic signatures associated with different epidermal cell states presented in this study will be very informative for characterizing skin diseases or cancers related to aberrant keratinocyte proliferation and differentiation.
Materials and methods
Tissue preparation, immunofluorescence staining, and microscopy
Embryos at embryonic day 13, 15 and 18 were collected from euthanized time-mated C57BL/6 J female mice and rinsed in cold phosphate-buffered saline (PBS). Postnatal day 1 and 6 (PN1, PN6) pups were collected and euthanized for sample harvesting. All animal work was carried out in accordance with approved IACUC at the Biological Resource Centre, A*STAR. E13 embryos were embedded whole in Frozen Section Media (FSC 22, Leica Biosystems). Dorsal skin of E15 and E18 embryos, and PN1 and PN6 pups were dissected and embedded in FSC 22. For each development stage, cryoblocks were generated for at least six embryos/pups from three independent litters. For comparison across development stages, immunofluorescence staining was performed on 3–4 replicate sets of E13, E15, and E18 sections of 7 μm thickness. Briefly, slides stored at −80°C were equilibrated to room temperature (RT) and fixed in 0.5% PFA in PBS for 1 hr at RT, followed by an antigen retrieval step of 0.5% SDS in PBS for 5 min at RT. Sections were then sequentially stained for K14 and specific histone modifications. Tissue sections were incubated in blocking solution (1% bovine serum albumin and 5% goat serum in PBS) for 30 min at 37°C. Anti-K14 primary antibody was added for 1 h at 37°C followed by incubation with Alexafluor488 anti-mouse secondary antibody (Invitrogen) for 1 h at RT. The staining procedure was repeated from the blocking step, to co-stain for specific histone modifications, with specific anti-histone primary antibodies and Alexafluor 594/568 anti-rabbit secondary antibodies. Counterstaining was done with DAPI in PBS (0.3 μM) for 10 min at RT. Slides were mounted using Prolong Gold antifade reagent (P10144, Invitrogen) and left to dry overnight in the dark at RT before imaging.
Microscopy and image analysis
Immunostained sections were imaged with a Olympus FV1000 upright confocal microscope with laser and exposure settings that were optimized and applied to all samples within each set of E13, E15, and E18 tissues. Images collected with the 40X objective were analysed using the FIJI software for signal intensity quantification. Nuclei were individually demarcated and the mean signal intensity of each nucleus was measured and collected as a single data point. K14-positive cells were denoted as basal cells, and K14-negative cells above them were analysed as suprabasal cells. In total, mean signal intensities of 20–40 nuclei per cell population per image were obtained for 10–12 images of three independent immunostaining experiments and graphed. 3D-SIM super-resolution imaging was carried out using the DeltaVision OMX inverted microscope.
Antibodies
All histone antibodies used were screened for PTM specificity using the AbSurance Histone Antibody Specificity Arrays (Cat#16-668, Merck Millipore), according to the manufacturer’s recommendations. Antibodies with high specificity against the appropriate modification were selected for use in the immunofluorescence assay: H3K4me1 (ab8895, Abcam), H3K4me3 (ab8580, Abcam), H3K9me3 (ab8898, Abcam), H3K9ac (ab4441, Abcam), H3K18ac (ab1191, Abcam), H3K27me3 (07–449, Millipore), H3K27ac (C15410196, Diagenode), H3K36me3 (ab9050, Abcam), H4K12ac (07–595, Millipore), H4K16ac (07–329, Millipore), H4K20me1 (ab9051, Abcam), H4K20me2 (ab9052, Abcam), H4K20me3 (07–463, Millipore). Other antibodies used were panH3 (ab1791, Abcam), panH4 (05–858, Millipore), anti-K14 (LL001, kind gift from Dr. Ellen Brigitte Lane), anti-Ki67 (MA5-14520, Thermo Scientific), anti-phosphoH3 (06–570, Millipore). Secondary antibodies used were chicken anti-rabbit AlexaFluor 594 or goat anti-rabbit AlexaFluor 568 m and chicken anti-mouse AlexaFluor 488 (A21442, A11011, A21200, Invitrogen).
Human keratinocyte culture, differentiation, and immunoblot analysis
Immortalized normal human keratinocyte N/TERT-1 cells [Citation61] were maintained in Keratinocyte Serum-Free media (KSFM) supplemented with 25 μg/ml bovine pituitary extract (BPE), 0.2 ng/ml epidermal growth factor (EGF), and 0.4 mM calcium chloride (Cat#10724-011, Gibco). Primary normal human keratinocytes (NHEK) were purchased and cultured in serum-free Keratinocyte Growth Media (Lonza). For maintenance in the undifferentiated state, cells were kept and passaged under 70% surface area confluency. Cells tested negative for mycoplasma contamination on a monthly basis using the Mycoalert Mycoplasma Detection kit (Cat#11650261, Lonza). To induce differentiation, N/TERT or NHEK cells at 70% confluency were cultured in DFK media containing DMEM (Cat#11965-092, Gibco), Ham’s F12 + Glutamax (Cat#31765-035, Gibco), KSFM, 0.2 ng/ml EGF, 0.4 mM calcium chloride, and 25ug/ml BPE for a day, then in DFK media supplemented with 1.23 mM calcium chloride for another 4 to 6 days. Cells were harvested at the 0 hr, 48 hr, 96 hr, and 144 hr timepoints for proteins. Cells were rinsed twice with cold PBS then lysed in cold RIPA buffer (Cat#89901, ThermoFisher) containing 1 mM DTT, 1 mM PMSF, 1 mM sodium butyrate, 0.9% SDS and 1X Protease Inhibitor Cocktail (Cat#11697498001, Roche) by passing through a 27-gauge needle 10 times after 15 min incubation on ice. Ten μg of the whole cell lysate samples was used for immunoblot analysis. Quantification of the densities of bands in the immunoblots was performed using ImageJ. Changes in specific histone modifications across days of differentiation were calculated by normalizing to the corresponding panH3 signals and shown relative to the Day 0 timepoint.
Supplemental Material
Download PDF (8.2 MB)Acknowledgments
We thank Drs Davor Solter, Barbara Knowles for helpful discussion of the work and Rifkana Shah Jahan and Christabel Dube for critical reading of the manuscript. We are grateful to Dr. Graham Wright and the A*STAR microscopy platform for technical advice. We thank Sim Siew Hoon and Karen Chan for technical assistance.
Disclosure Statement
No potential conflict of interest was reported by the authors.
Supplementary material
Supplemental data for this article can be accessed here.
Additional information
Funding
References
- Jenuwein T. Translating the histone code. Science. 2001;293:1074–1080.
- Kraushaar DC, Zhao K. The epigenomics of embryonic stem cell differentiation. Int J Biol Sci. 2013;9:1134–1144.
- Barski A, Cuddapah S, Cui K, et al. High-resolution profiling of histone methylations in the human genome. Cell. 2007;129:823–837.
- The ENCODE project consortium. An integrated encyclopedia of DNA elements in the human genome. Nature. 2012;489:57–74.
- Xu D, Bai J, Duan Q, et al. Covalent modifications of histones during mitosis and meiosis. Cell Cycle. 2009;8:3688–3694.
- Pesavento JJ, Yang H, Kelleher NL, et al. Certain and Progressive Methylation of Histone H4 at Lysine 20 during the Cell Cycle. Mol Cell Biol. 2008;28:468–486.
- Oda H, Okamoto I, Murphy N, et al. monomethylation of histone H4-lysine 20 is involved in chromosome structure and stability and is essential for mouse development. Mol Cell Biol. 2009;29:2278–2295.
- Zhao Y, Garcia BA. Comprehensive catalog of currently documented histone modifications. Cold Spring Harb Perspect Biol. 2015;7:a025064.
- Lee J-S, Smith E, Shilatifard A. The language of histone crosstalk. Cell. 2010;142:682–685.
- Gardner KE, Allis CD, Strahl BD. OPERating ON chromatin, a colorful language where context matters. J Mol Biol. 2011;409:36–46.
- Margueron R, Trojer P, Reinberg D. The key to development: interpreting the histone code? Curr Opin Genet Dev. 2005;15:163–176.
- Fuchs E. Scratching the surface of skin development. Nature. 2007;445:834–842.
- Koster MI. p63 in skin development and ectodermal dysplasias. J Invest Dermatol. 2010;130:2352–2358.
- Byrne C, Tainsky M, Fuchs E. Programming gene expression in developing epidermis. Development. 1994;120:2369–2383.
- Lechler T, Fuchs E. Asymmetric cell divisions promote stratification and differentiation of mammalian skin. Nature. 2005;437:275–280.
- Liu S, Zhang H, Duan E. epidermal development in mammals: key regulators, signals from beneath, and stem cells. IJMS. 2013;14:10869–10895.
- Veltri A, Lang C, Lien W-H. concise review: wnt signaling pathways in skin development and epidermal stem cells. Stem Cells. 2018;36:22–35.
- Sotiropoulou PA, Blanpain C. Development and homeostasis of the skin epidermis. Cold Spring Harb Perspect Biol. 2012;4:a008383.
- Rognoni E, Watt FM. Skin cell heterogeneity in development, wound healing, and cancer. Trends Cell Biol. 2018;28:709–722.
- LeBoeuf M, Terrell A, Trivedi S, et al. Hdac1 and Hdac2 Act redundantly to control p63 and p53 functions in epidermal progenitor cells. Dev Cell. 2010;19:807–818.
- Mejetta S, Morey L, Pascual G, et al. Jarid2 regulates mouse epidermal stem cell activation and differentiation. Embo J. 2011;30:3635–3646.
- Ezhkova E, Pasolli HA, Parker JS, et al. Ezh2 orchestrates gene expression for the stepwise differentiation of tissue-specific stem cells. Cell. 2009;136:1122–1135.
- Sen GL, Webster DE, Barragan DI, et al. Control of differentiation in a self-renewing mammalian tissue by the histone demethylase JMJD3. Genes Dev. 2008;22:1865–1870.
- Liakath-Ali K, Vancollie VE, Heath E, et al. Novel skin phenotypes revealed by a genome-wide mouse reverse genetic screen. Nat Commun. 2014;5:3540.
- Wang Z, Zang C, Rosenfeld JA, et al. Combinatorial patterns of histone acetylations and methylations in the human genome. Nat Genet. 2008;40:897–903.
- Taylor GCA, Eskeland R, Hekimoglu-Balkan B, et al. H4K16 acetylation marks active genes and enhancers of embryonic stem cells, but does not alter chromatin compaction. Genome Res. 2013;23:2053–2065.
- Dion MF, Altschuler SJ, Wu LF, et al. Genomic characterization reveals a simple histone H4 acetylation code. Proce Nat Acad Sci. 2005;102:5501–5506.
- Akhtar A, Becker PB. Activation of transcription through histone H4 acetylation by MOF, an acetyltransferase essential for dosage compensation in drosophila. Molecular Cell. 2000;5:367–375.
- Connelly JT, Mishra A, Gautrot JE, et al. Shape-induced terminal differentiation of human epidermal stem cells requires p38 and is regulated by histone acetylation. Kreplak L, editor. PLoS ONE. 2011;6:e27259.
- Jorgensen S, Schotta G, Sorensen CS. Histone H4 Lysine 20 methylation: key player in epigenetic regulation of genomic integrity. Nucleic Acids Res. 2013;41:2797–2806.
- Vaquero A. SirT2 is a histone deacetylase with preference for histone H4 Lys 16 during mitosis. Genes Dev. 2006;20:1256–1261.
- Smith ER, Cayrou C, Huang R, et al. A human protein complex homologous to the drosophila MSL complex is responsible for the majority of histone H4 acetylation at lysine 16. Mol Cell Biol. 2005;25:15.
- Rezza A, Wang Z, Sennett R, et al. Signaling networks among stem cell precursors, transit-amplifying progenitors, and their niche in developing hair follicles. Cell Rep. 2016;14:3001–3018.
- Sennett R, Wang Z, Rezza A, et al. An integrated transcriptome atlas of embryonic hair follicle progenitors, their niche, and the developing skin. Dev Cell. 2015;34:577–591.
- Li X, Li L, Pandey R, et al. the histone acetyltransferase MOF is a key regulator of the embryonic stem cell core transcriptional network. Cell Stem Cell. 2012;11:163–178.
- Gupta A, Guerin-Peyrou TG, Sharma GG, et al. The mammalian ortholog of drosophila MOF that acetylates histone H4 lysine 16 is essential for embryogenesis and oncogenesis. Mol Cell Biol. 2008;28:397–409.
- Basilicata MF, Bruel A-L, Semplicio G, et al. De novo mutations in MSL3 cause an X-linked syndrome marked by impaired histone H4 lysine 16 acetylation. Nat Genet. 2018;50:1442–1451.
- Lu L, Chen X, Sanders D, et al. High-resolution mapping of H4K16 and H3K23 acetylation reveals conserved and unique distribution patterns in Arabidopsis and rice. Epigenetics. 2015;10:1044–1053.
- Zhang R, Erler J, Langowski J. Histone acetylation regulates chromatin accessibility: role of H4K16 in Inter-nucleosome Interaction. Biophys J. 2017;112:450–459.
- Ming M, Qiang L, Zhao B, et al. Mammalian SIRT2 inhibits keratin 19 expression and is a tumor suppressor in skin. Exp Dermatol. 2014;23:207–209.
- Urdinguio RG, Lopez V, Bayón GF, et al. Chromatin regulation by Histone H4 acetylation at Lysine 16 during cell death and differentiation in the myeloid compartment. Nucleic Acids Res. 2019;47:5016–5037.
- Peters AHFM, Kubicek S, Mechtler K, et al. partitioning and plasticity of repressive histone methylation states in mammalian chromatin. Molecular Cell. 2003;12:1577–1589.
- Saksouk N, Simboeck E, Déjardin J. Constitutive heterochromatin formation and transcription in mammals. Epigenet Chromatin. 2015;8:3.
- Schotta G, Lachner M, Sarma K, et al. A silencing pathway to induce H3-K9 and H4-K20 trimethylation at constitutive heterochromatin. Genes Dev. 2004;18:1251–1262.
- Bosch-Presegué L, Raurell-Vila H, Thackray JK, et al. Mammalian HP1 isoforms have specific roles in heterochromatin structure and organization. Cell Rep. 2017;21:2048–2057.
- Gdula MR, Poterlowicz K, Mardaryev AN, et al. Remodeling of three-dimensional organization of the nucleus during terminal keratinocyte differentiation in the epidermis. J Invest Dermatol. 2013;133:2191–2201.
- Kidder BL, Hu G, Cui K, et al. SMYD5 regulates H4K20me3-marked heterochromatin to safeguard ES cell self-renewal and prevent spurious differentiation. Epigenet Chromatin. 2017;10:8.
- Kidder BL, He R, Wangsa D, et al. SMYD5 controls heterochromatin and chromosome integrity during embryonic stem cell differentiation. Cancer Res. 2017;77:6729–6745.
- Nicetto D, Hahn M, Jung J, et al. Suv4-20h histone methyltransferases promote neuroectodermal differentiation by silencing the pluripotency-associated Oct-25 gene. ferguson-Smith AC, editor. PLoS Genet. 2013;9:e1003188.
- Viotti M, Wilson C, McCleland M, et al. SUV420H2 is an epigenetic regulator of epithelial/mesenchymal states in pancreatic cancer. J Cell Biol. 2018;217:763–777.
- Bierhoff H, Dammert MA, Brocks D, et al. Quiescence-Induced LncRNAs trigger H4K20 trimethylation and transcriptional silencing. Molecular Cell. 2014;54:675–682.
- Kourmouli N. Heterochromatin and tri-methylated lysine 20 of histone H4 in animals. J Cell Sci. 2004;117:2491–2501.
- Nelson DM, Jaber-Hijazi F, Cole JJ, et al. Mapping H4K20me3 onto the chromatin landscape of senescent cells indicates a function in control of cell senescence and tumor suppression through preservation of genetic and epigenetic stability. Genome Biol. 2016;17:158.
- Evertts AG, Manning AL, Wang X, et al. H4K20 methylation regulates quiescence and chromatin compaction. Heldin C-H, editor. MBoC. 2013;24:3025–3037.
- Ahtiainen L, Lefebvre S, Lindfors PH, et al. Directional cell migration, but not proliferation, drives hair placode morphogenesis. Dev Cell. 2014;28:588–602.
- Jahoda CAB, Oliver RF. Vibrissa dermal papilla cell aggregative behaviour in vivo and in vitro. Development. 1984;79:211–224.
- Biron VL, McManus KJ, Hu N, et al. Distinct dynamics and distribution of histone methyl-lysine derivatives in mouse development. Dev Biology. 2004;276:337–351.
- Fessing MY, Mardaryev AN, Gdula MR, et al. p63 regulates Satb1 to control tissue-specific chromatin remodeling during development of the epidermis. J Cell Biol. 2011;194:825–839.
- Botchkarev VA. The molecular revolution in cutaneous biology: chromosomal territories, higher-order chromatin remodeling, and the control of gene expression in keratinocytes. J Invest Dermatol. 2017;137:e93–9.
- Frye M, Fisher AG, Watt FM. Epidermal stem cells are defined by global histone modifications that are altered by myc-induced differentiation. Bähler J, editor. PLoS ONE. 2007;2:e763.
- Dickson MA, Hahn WC, Ino Y, et al. human keratinocytes that express hTERT and also bypass a p16INK4a-enforced mechanism that limits life span become immortal yet retain normal growth and differentiation characteristics. Mol Cell Biol. 2000;20:1436–1447.