
ABSTRACT
Changes in whole blood DNA methylation levels at several CpG sites have been associated with circulating blood lipids, specifically high-density lipoprotein and triglycerides. This study performs a discovery and validation epigenome-wide association study (EWAS) for circulating lipoprotein(a) [Lp(a)], an independent risk factor for cardiovascular diseases. Whole-blood DNA methylation profiles were assessed in a cohort of 1020 elderly individuals using the Illumina EPIC array and independent validation in 359 elderly males using the Illumina 450 k array. Plasma Lp(a) was measured using an apolipoprotein(a)-size-independent ELISA. Epigenome-wide rank regression analysis identified and validated a single CpG site, cg17028067 located in intron 1 of the LPA gene, that was significantly associated with plasma Lp(a) levels after correction for multiple testing. Genotyping of the site identified a relatively uncommon SNP (rs76735376, MAF <0.02) at the CpG site that largely explained the observed methylation effect. Rs76735376 is an expression quantitative trait loci for the LPA gene and could affect expression by altering enhancer activity. This EWAS for plasma Lp(a) identified a single CpG site within LPA. This association is due to an uncommon, but highly effective genetic variant, which was not in significant linkage disequilibrium with other variants known to influence Lp(a) levels or apo(a) isoform size. This study highlights the utility of CpG site methylation to identify potentially important genetic associations that would not be readily apparent in a comparable size genetic association study.
Introduction
Lipoprotein(a) [Lp(a)] is an atherogenic molecule consisting of a low-density lipoprotein (LDL) linked to the plasminogen homologue, apolipoprotein(a) [apo(a)]. Increased plasma Lp(a) has been shown to be an independent risk factor for many forms of vascular disease, including coronary artery disease [Citation1,Citation2], peripheral vascular disease, stroke, abdominal aortic aneurysm [Citation3], and aortic valve stenosis [Citation4]. Plasma Lp(a) levels are highly variable and can vary up to 1000-fold between individuals. The estimated heritability for Lp(a) is exceptionally high, being in the order of 0.9 [Citation5,Citation6].
Lp(a) concentrations are strongly influenced by copy number variation in the kringle IV type 2 (KIV2) repeat domain in the LPA gene which codes for apo(a). This size polymorphism gives rise to several different-sized apo(a) isoforms [Citation5,Citation7]. Although varying in influence between different ethnic populations [Citation8], the KIV2 size polymorphism explains anywhere between a third and two-thirds of the variation in plasma Lp(a) concentrations in Europeans [Citation7,Citation9]. Nevertheless, even within individuals with the same-sized apo(a) isoforms, circulating Lp(a) concentrations can vary by up to 200 folds [Citation10]. Recent meta-analyses have identified a large number of independent SNPs in the LPA gene region associated with circulating levels of Lp(a) and included 30 loci that were independent of apo(a) size isoforms [Citation11,Citation12].
Despite the strong genetic influence driving Lp(a) levels, the possibility of environmental factors influencing Lp(a) levels remains possible. Epigenome-wide association studies (EWASs) have shown reproducible association between DNA methylation profiles and other circulating blood lipid levels, in particular HDL-cholesterol and triglycerides [Citation13,Citation14]. We, therefore, conducted two independent EWAS to determine if DNA methylation profiles are associated with plasma Lp(a).
Methods
Cohort information
Two independent cohorts were analysed for this study. The first consisted of a consecutive series of individuals over 50 y of age, taking part in a population abdominal aortic aneurysm (AAA) screening study at Dunedin Public Hospital, recruited between January 2011 and May 2013. DNA was extracted from blood samples collected at the time of initial recruitment [Citation15]. The second cohort consisted of 359 elderly males over 55 y of age recruited as AAA-free controls between January 2008 and December 2010 [Citation16]. The demographics of both cohorts are shown in .
Table 1. Cohort demographics.
Genome-wide DNA methylation analysis
DNA methylation data were obtained using either the Infinium MethylationEPIC (cohort 1) or Infinium Human Methylation450 (cohort 2) beadchip assay (Illumina, San Diego, CA, USA), using DNA samples extracted from peripheral whole blood. A discovery (cohort 1) validation (cohort 2) study design was utilized. Of note, the ability to perform a meta-analysis was limited due to incomplete content overlap between the two assays. CpG sites present on both arrays were, however, analysed in order to further improve study power. Bisulphite-converted samples were prepared following the manufacturer’s protocol and assayed at an Illumina-approved service provider (Genomnz, AgResearch, Invermay, New Zealand). The array output files underwent quality control and background and batch normalization using the GenomeStudio software package (Illumina). Known cross-reactive and non-specific probes were excluded from the subsequent analysis [Citation17,Citation18].
Differential statistical analysis for Lp(a) epigenome-wide associations was performed using rank regression in the Qlucore Omics Explorer (version 3.4, Lund, Sweden) software package. Methylation β-values were transformed such that the mean β-value for each site was equal to zero and its standard deviation equal to one for subsequent differential statistical analysis. However, unadjusted β-values, ranging from 0 (unmethylated) to 1 (fully methylated), were used in graphical analysis and biological interpretation [Citation19]. Blood cell composition correction was performed using the Horvath [Citation20], Houseman extended [Citation21], and FlowSorted.Blood.EPIC [Citation22] deconvolution methods. The final adjusted rank regression models included age, sex (cohort 1 only), blood cell composition deconvolution, and array batch and intra-array position. Adjustment for multiple comparisons was made using a false discovery rate (Benjamini–Hochberg) approach and are reported as q-values. Adjusted p-values were used to generate Manhattan and QQ-plots within the QQman R package [Citation23].
Lp(a) assay
We determined plasma Lp(a) concentrations on a molar basis using a double-sandwich ELISA that utilized commercially available antibodies. In brief, ELISA plates were coated with a 1 in 300 dilution of a goat anti-human Lp(a) polyclonal antibody (Lp(a)-HA, #414-41901, Fujifilm Wako Diagnostics CA, USA) in 1X PBS overnight and then blocked with 3% BSA in PBS. Plasma samples were incubated on the ELISA plates at three dilutions (1:50, 1:500, 1:2500) in duplicate for 1 h. Detection was performed using an anti-apolipoprotein(a) monoclonal antibody (clone LPA4, MABS1284, Sigma Aldrich, MI, USA) originally described by Tsimikas et al. [Citation24] which binds to a peptide sequence within KIV-5, KIV-7, and KIV-8 [Citation25]. An eight-point standard curve, ranging from 0.04 nmol to 0.45 nmol, was generated, and three internal calibration control samples of known nmol/L concentration (15, 54, and 107 nmol/L) were included on each plate as longitudinal inter-assay controls. The average coefficients of variance for these three controls, across 115 separate assays, were 6.7%, 8.5%, and 10.3%, respectively. An external assay calibration was performed by comparing matching plasma samples from 224 individuals using our ELISA assay with that of a commercial assay validated as being apo(a) size independent (Roche Cobas Tina-quant Lipoprotein (a) Generation 2, https://diagnostics.roche.com/global/en/products/params/tina-quant-lipoprotein-a-gen-2.html). The results from the two assays were well correlated (r2 = 0.93, 95% CI 0.91–0.95).
Genetic association analysis
In all, 710 of the EWAS participants had matching whole-genome SNP data, generated using either the Affymetrix SNP 6 GeneChip or the Illumina Infinium Omni2.5 beadchip array as previously described [Citation26]. Imputation of missing genotypes was performed separately on the two types of arrays using IMPUTE 2.2. The reference haplotypes were based on the 1000 Genomes Phase 1 Integrated set v3 (macGT1) March 2012 NCBI build 37. Imputed calls were filtered by quality score (excluding those <0.9) to restrict to higher-quality imputed SNPs.
Genotyping of rs76735376 by Sanger sequencing and TaqMan assay
The 294-bp DNA region surrounding cg17028067 (−212/+81 bp; Supplementary Table 1) was amplified from the genomic DNA of 59 individuals that had cg17028067 β-values of <0.55 and 135 that had β-values of >0.74 using Platinum® Taq DNA Polymerase (Life Technologies, CA, USA) and the primers listed in Supplementary Table 1. PCR products were Sanger-sequenced. All EWAS samples (cohorts 1 & 2) were directly genotyped for the rs76735376 SNP using a TaqMan® probe (#C_104118174_10, ThermoFisher Scientific, MA, USA). Any samples that failed initial genotyping were re-run, resulting in a final call rate of 95.6%.
Identification of SNPs in LD with rs76735376 or having a strong genome-wide association with Lp(a)
The LDLink tool [Citation27] was used to identify other SNPs in potential linkage with rs76735376. Because of the strong (>97%) Anglo-European ancestry of the population of the Otago region of New Zealand examined in this study [Citation26], the ‘Europeans from Great Britain’ population set was used as the reference group for this analysis (Phase 3 (Version 5) of the 1000 Genomes Project, www.internationalgenome.org/home). Other SNPs previously identified as being strongly associated with Lp(a) in genome-wide analyses [Citation11,Citation12] were extracted from the imputed genome-wide SNP dataset. This list included 48 SNPs reported by Mack et al. as being independently associated with inverse‐normal transformed Lp(a) values (adjusted for age and sex [Citation11]). A quantitative trait analysis was then performed using PLINK, v2 [Citation28].
Epidemiological risk factor statistical analysis
Normally distributed continuous variables are represented by means and standard deviations and were analysed with ANOVA. Non-normally distributed continuous variables are represented as medians and interquartile ranges and analysed with the Mann–Whitney U-test. Categorical variables were represented by count and percentage and analysed by the Chi-square test. Receiver operator characteristic (ROC) curve analysis was used to calculate the binary threshold of Lp(a) used for subsequent multivariate logistic regression. Statistical analysis was performed using the R statistical computing package (version 3.5.1) in conjunction with MedCalc version 18.6 (MedCalc Software, Ostend, Belgium).
ChIP-seq, ChromHMM, mRNA-seq, and eQTL data used for functional analysis of rs76735376
Histone modification ChIP-seq, primary state ChromHMM, gene boundary, and mRNA-seq data were obtained from the ENCODE [Citation29] and Roadmap Epigenomics [Citation30] projects through the UCSC genome browser (https://genome.ucsc.edu/) using assembly hg19 [Citation31,Citation32]. EQTL data were obtained from GTEx [Citation33].
Results
The demographics of the discovery (cohort 1) and validation (cohort 2) groups are shown in . Cohort 1 had a significantly higher prevalence of ischaemic heart disease (IHD) and known cardiovascular risk factors such as hypertension, history of dyslipidemia, body mass index, and plasma Lp(a). Lp(a) was significantly associated with a history of IHD, with an area under the curve in the ROC analysis of 0.57 (95% CI 0.54–0.60, p < 0.0001). The Youden’s index suggested that the optimal binary threshold for the Lp(a) association with IHD was >50.1 mmol/L (sensitivity 53.3, specificity 59.0). In a logistic regression analysis combining both cohorts, those with >50 nmol/L had an odds ratio for history of IHD of 1.37 (95% CI 1.05–1.79, p = 0.02), adjusted for age, sex, hypertension, diabetes, other forms of dyslipidemia, smoking pack-year consumption, and recruitment cohort.
Lp(a) discovery and validation EWAS
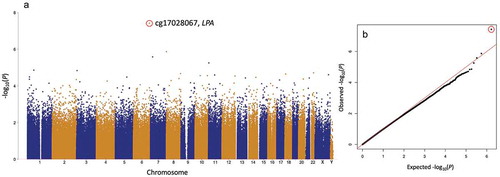
The discovery (cohort 1) EWAS for plasma Lp(a) identified a single CpG site, cg17028067 located in intron 1 of the LPA gene, which was significantly associated with plasma Lp(a) concentrations after correction for multiple testing (). This site had a p-value of 3.8 × 10⁻⁸ (q-value = 0.03) in the age, sex, blood cell composition (Houseman extended method), and array batch/position-adjusted model. The cg17028067 CpG site was also present on the lower-density Illumina Methylation450 array which was used to characterize cohort 2. The cg17028067 plasma Lp(a) association was independently validated in cohort 2 with a p-value of 2.9 × 10⁻⁷ in the age, blood cell composition (extended Houseman), and array batch/position-adjusted model (Supplementary Figure 1). The method of blood cell composition deconvolution that was utilized did not alter this association in either cohort.
Figure 1. Lp(a) EWAS in the discovery cohort: (a) Manhattan and (b) QQ plot. Plasma Lp(a) EWAS (rank regression), adjusted for age, sex, and blood cell composition. Only one CpG site, cg17028067 (red circle), was significantly associated with Lp(a) after multiple testing correction (p < 4 × 10⁻⁸, Q < 0.05).
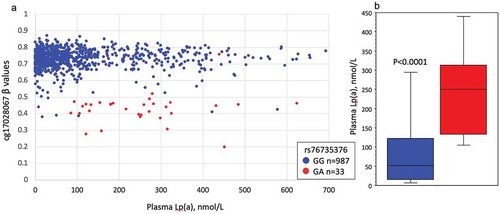
When the cg17028067 β-values were plotted with their matching plasma Lp(a) levels, it was evident that a subset of individuals had β-values approximately half that of the population mean of 0.74, suggesting a potential genetic polymorphic influence on the methylation of this site ().
Figure 2. The relationship between plasma Lp(a), cg1702867 methylation, and rs76735376 genotype in the discovery cohort.
A combined analysis of both cohorts, examining those CpG sites present on both arrays, failed to identify any further significant Lp(a) associations. Summary results for both datasets are available as supplemental files of this research paper.
Sequencing of the region surrounding cg17028067
An initial examination of a potential genetic effect on cg17028067 methylation was conducted by Sanger-sequencing of the DNA region surrounding cg17028067 from 59 individuals with β-values of <0.55 and comparing these with 135 that had β-values of >0.74.
This analysis identified an SNP, rs76735376, comprising a G/A polymorphism within the cg17028067 site in 44 of the 59 individuals in the β-value <0.55 group (74.6%) and which only occurred in 1 of the 135 individuals (0.7%) with β-values >0.74. This result suggested that the rs76735376 SNP was the leading cause of the observed lower β-values. Other known SNPs in this region included rs966283639, a C/T polymorphism of the other nucleotide in cg17028067, and rs60130137 comprising a -/AATAA pentanucleotide repeat polymorphism. The minor allele of rs966283639 (T) was not present in any of the 194 individuals that were sequenced. Of individuals with low β-values (<0.55) that were G homozygous for rs76735376, only one was heterozygous for rs60130137, and this SNP could, therefore, not explain low cg17028067 β-values in such individuals.
Based on our sequencing observations, we then genotyped all individuals in both cohorts for rs76735376 using TaqMan probes. TaqMan genotyping results were consistent with Sanger-sequencing and showed that the majority of those with low cg17028067 β-values were heterozygotes for rs7673537 (). In both cohorts, rs7673537 heterozygotes had significantly higher plasma Lp(a) levels than the common (G) allele homozygotes ( and Supplementary Figure 2). There was no significant correlation between Lp(a) and cg17028067 β-values when examined within those with specific rs7673537 genotypes (G homozygotes; r = −0.03, p = 0.30, heterozygotes; r = −0.06, p = 0.73). Across both cohorts, 61 individuals (4.4%) failed to genotype for this SNP. All such individuals had cg17028067 β-values near the population mean of 0.74 and their plasma Lp(a) were not significantly different to that of rs7673537 G homozygotes (p = 0.30).
SNPs in LD with rs76735376 and effect size comparisons with other Lp(a)-associated variants
Next, we determined if rs76735376 was in high (R2 > 0.8) linkage disequilibrium (LD) with other SNPs previously associated with Lp(a) in meta-GWAS [Citation11,Citation12] or with regulatory variants. Analysis of the Europeans from Great Britain cohort [Citation27] did not identify any regulatory variants in LD with rs76735376 (Supplementary Figure 3A), nor any strong LD with GWAS variants previously reported in association with Lp(a) (Supplementary Figure 3B). A lookup of rs76735376 in the UKBiobank PheWeb indicated significant associations with several relevant traits, including coronary artery disease and hyperlipidaemia (Supplementary Figure 4).
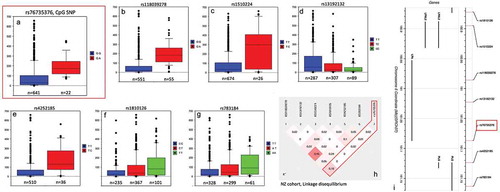
The Lp(a) effect size was then determined by performing a quantitative trait analysis of a subset of 710 New Zealand Lp(a) EWAS participants for whom-genome-wide SNP data were available. The effect size of the rs76735376 Lp(a) association was compared with that of previously reported Lp(a) SNPs. In this New Zealand cohort, the rs76735376 A allele was significantly associated with a greater than 100 nmol/L increase in Lp(a) after adjusting for age and sex () and accounted for 3% of the variance in Lp(a). Six other SNPs from previous Lp(a) GWAS reports [Citation11,Citation12] were also associated (p < 5 × 10⁻⁶) with Lp(a) in this cohort (, ). The two strongest of these associations were with rs118039278 and rs1510224 and accounted for 13% and 10%, respectively, of the variance in Lp(a) and were also the two strongest effect SNPs reported by Mack et al. [Citation11]. Both are associated with significantly increased Lp(a) levels, and both are in perfect LD with the KIV2-tagging SNPs, rs10455872 and rs3798220, suggesting they are linked to the KIV2 size polymorphism. Also associated were rs1810126 and rs13192132, two independent modifier variants of the relationship between KIV2-copy number and Lp(a) concentrations [Citation12]. The effect of rs76735376 compared to those previously reported SNPs that were associated with Lp(a) in this cohort is shown in , with only a weak linkage (r2 = 0.18) being observed between the CpG site SNP (rs76735376) and the most significant SNP (rs118039278). None of the other Lp(a)-associated SNPs were in strong LD with rs76735376 in this New Zealand cohort ()). The lack of linkage of rs76735376 to the rs10455872 and rs3798220 SNPs suggest that the effect of rs76735376 SNP is independent of apo(a) isoform size.
Table 2. Quantitative trait-associated SNPs for plasma Lp(a).
Figure 3. Box and Whisker plots of significant plasma Lp(a) SNP associations in a New Zealand cohort.
Functional analysis of rs76735376
We next investigated the potential mechanism by which rs76735376 could affect Lp(a) expression. Rs76735376 is located in the first intron of the LPA gene (). The promoter of LPA has previously been reported to be either upstream of the first or second exon based on genomic location [Citation34,Citation35]. Here, we have utilized epigenetic data marking promoter and enhancer chromatin states in liver to investigate whether rs76735376 has the potential to alter gene regulation and LPA expression.
Figure 4. Functional analysis of rs76735376 and the LPA gene. (a and b) UCSC snapshot (hg19) [Citation31,Citation32] of the total LPA gene (a) and of the region surrounding rs76735376 (b). In each panel, the following tracks are shown: UCSC genes, gene boundaries deduced from clustering mRNAs, and spliced expressed sequence tags against the genome (the displayed annotation has a score of 1000, which means it is based on four or more alignments), mRNA-seq signal in adult liver from donor 177 REMC 27 and UCSD donor STL011, strand-specific mRNA-seq signal in liver from ENCODE biosample ENCBS082KWE (unique reads), primary states by ChromHMM, H3K4me3, H3K27ac, and H3K4me1 tracks from REMC/Broad and Roadmap [Citation29,Citation30]. The location of rs76735376 is highlighted. (c) EQTL data from GTEx for rs76735376 and LPA in liver. A violin plot of normalized expression levels of LPA in liver from individuals containing the rs76735376 GG, GA, and AA alleles is shown. The number of individuals in each genotype is indicated in brackets on the x-axis. The p-value shown was obtained using the GTEx eQTL calculator.
![Figure 4. Functional analysis of rs76735376 and the LPA gene. (a and b) UCSC snapshot (hg19) [Citation31,Citation32] of the total LPA gene (a) and of the region surrounding rs76735376 (b). In each panel, the following tracks are shown: UCSC genes, gene boundaries deduced from clustering mRNAs, and spliced expressed sequence tags against the genome (the displayed annotation has a score of 1000, which means it is based on four or more alignments), mRNA-seq signal in adult liver from donor 177 REMC 27 and UCSD donor STL011, strand-specific mRNA-seq signal in liver from ENCODE biosample ENCBS082KWE (unique reads), primary states by ChromHMM, H3K4me3, H3K27ac, and H3K4me1 tracks from REMC/Broad and Roadmap [Citation29,Citation30]. The location of rs76735376 is highlighted. (c) EQTL data from GTEx for rs76735376 and LPA in liver. A violin plot of normalized expression levels of LPA in liver from individuals containing the rs76735376 GG, GA, and AA alleles is shown. The number of individuals in each genotype is indicated in brackets on the x-axis. The p-value shown was obtained using the GTEx eQTL calculator.](/cms/asset/522921a2-0ab1-4ca3-a8d9-bcbb07ca3eb8/kepi_a_1739797_f0004_oc.jpg)
Based on ChromHMM (chromatin-state signatures using a multivariate hidden Markov model), rs76735376 is marked as an enhancer, upstream of the LPA promoter that is located adjacent to exon 2 (). Note that an additional promoter and 5ʹ exons may be present upstream of the first exon of LPA based on the following observations: (1) the presence of a promoter ChromHMM state, (2) an annotated gene boundary (generated by UCSC based on RNA-seq data), and (3) mRNA-seq signal (). Rs76735376 is thus not part of an LPA promoter, but might influence LPA expression by affecting enhancer activity, although the enhancer-marking histone modification peaks of H3K4me1 and H3K27ac do not directly overlap with rs76735376 ()).
To identify whether rs76735376 could affect LPA expression, we looked up expression quantitative trait loci (eQTL) in liver from the Genotype-Tissue Expression (GTEx) project [Citation36]. Rs76735376 and LPA are in eQTL, and the GA genotype correlates with increased LPA expression ()). The correlation between increased LPA gene expression and the GA genotype of rs76735376 is consistent with the correlation between increased plasma Lp(a) protein levels and the GA genotype reported in this study ().
Discussion
This discovery and independent validation epigenome-wide analysis identified a single CpG site in the LPA gene associated with plasma Lp(a) concentrations. The methylation pattern associated with this site suggested the influence of a single-nucleotide polymorphism within the CPG site which was subsequently shown to be due to rs76735376, comprising a G/A overlapping the site. During the preparation of this manuscript, an almost identical finding was posted on bioRxiv [Citation36] in an analysis of the KORA and SAPHIR populations from Germany and Austria. The investigators observed the same differential methylation association between cg17028067 and circulating Lp(a), but using an isoform size-dependent mass-based assay. Importantly, this current study utilized an isoform size-independent assay which negated the need to account for apo(a) isoform size in our analysis. Despite these important methodological differences, both studies observed concordant results. The differential methylation of this region did not appear to be the mechanism of action but rather appeared to be a strong surrogate for an Lp(a)-influencing SNP (rs76735376), which was within the CpG site.
In order to determine the relative effect size of this variant, we compared it to other known genetic variants robustly associated with Lp(a) in published genome-wide association studies [Citation11,Citation12]. KIV2 size polymorphisms have been reported as explaining anywhere between a third and two-thirds of the variation in plasma Lp(a) concentrations in Europeans [Citation7,Citation9]. Indeed, just two KIV2-tagging SNPs, rs10455872 and rs3798220, have been used as a genetic instrument to predict Lp(a) and jointly explain over 20% of the phenotypic variance [Citation11]. Consistent with this, two SNPs, rs118039278 and rs1510224 (in perfect LD with rs10455872 and rs3798220), explained a similar level of variance (23%) in our New Zealand cohort. As shown in , the allelic effect size of the CpG site cg17028067-associated SNP rs76735376 was over 100 nmol/L, which was similar to that of these two (rs118039278 and rs1510224) strongest Lp(a) SNP associations. These effects are significant in the context of cardiovascular disease risk since plasma Lp(a) greater than 50 nmol/L was associated with increased risk of IHD in this study, an observation which is also consistent with previous studies in patients with a range of cardiovascular diseases [Citation3,Citation37].
Perhaps, the most surprising aspect of this investigation was the strength of the epigenetic instrument, the differential methylation of cg17028067, to identify an Lp(a) effect. The differential methylation pattern was remarkably statistically strong (p-values of 4 × 10⁻⁸ and 3 × 10⁻⁷ for cohorts 1 and 2, respectively) and consistent in effect within the two independent cohorts, particularly given one of these included only 359 individuals. In comparison, the SNP associated with this methylation quantitative trait loci (mQTL), rs76735376, had a p-value of 6 × 10⁻⁶ in a cohort of approximately 700 individuals.
Because of the large effect size of this association and the apparent lack of any substantial linkage with another functional variant, we hypothesized that rs76735376 may be acting by affecting promoter or enhancer activity. Based on the SNP’s proximity to the transcriptional start site, it has been suggested that this variant may reside in the promoter of LPA [Citation36]; however, we show that rs76735376 is not located in the promoter(s) of LPA, but rather in an enhancer element (). Thus, rs76735376 does not appear to have the potential to affect promoter activity but could be involved in altering LPA levels by affecting enhancer activity. Alternatively, it could be involved in controlling splicing or first exon usage.
Despite the robust and reproducible association between whole blood DNA methylation and Lp(a), a potential limitation of this study may, therefore, be that the analysis was not liver tissue specific. Further studies will be required to interrogate the mechanistic effects of the rs76735375 variant, particularly within liver tissue.
Supplemental Material
Download PDF (682.4 KB)Disclosure statement
No potential conflict of interest was reported by the authors.
Supplementary material
Supplemental data for this article can be accessed here.
Additional information
Funding
References
- Helgadottir A, Gretarsdottir S, Thorleifsson G, et al. Apolipoprotein(a) genetic sequence variants associated with systemic atherosclerosis and coronary atherosclerotic burden but not with venous thromboembolism. J Am Coll Cardiol. 2012;60(8):722–729.
- Kamstrup PR, Nordestgaard BG. Elevated lipoprotein(a) levels, LPA risk genotypes, and increased risk of heart failure in the general population. JACC Heart Fail. 2016;4(1):78–87.
- Jones GT, van Rij AM, Cole J, et al. Plasma lipoprotein(a) indicates risk for 4 distinct forms of vascular disease. Clin Chem. 2007;53(4):679–685.
- Kamstrup PR. Tybjaerg-hansen A and nordestgaard BG, elevated lipoprotein(a) and risk of aortic valve stenosis in the general population. J Am Coll Cardiol. 2014;63(5):470–477.
- Boerwinkle E, Leffert CC, Lin J, et al. Apolipoprotein(a) gene accounts for greater than 90% of the variation in plasma lipoprotein(a) concentrations. J Clin Invest. 1992;90:52–60.
- Rao F, Schork AJ, Maihofer AX, et al. Heritability of biomarkers of oxidized lipoproteins: twin pair study. Arterioscler Thromb Vasc Biol. 2015; 35: 1704–1711.
- Nordestgaard BG, Langsted A. Lipoprotein (a) as a cause of cardiovascular disease: insights from epidemiology, genetics, and biology. J Lipid Res. 2016;57:1953–1975.
- Sandholzer C, Hallman DM, Saha N, et al. Effects of the apolipoprotein(a) size polymorphism on the lipoprotein(a) concentration in 7 ethnic groups. Hum Genet. 1991;86:607–614.
- Schmidt K, Noureen A, Kronenberg F, et al. Structure, function, and genetics of lipoprotein (a). J Lipid Res. 2016;57:1339–1359.
- Perombelon YF, Soutar AK, Knight BL. Variation in lipoprotein(a) concentration associated with different apolipoprotein(a) alleles. J Clin Invest. 1994;93(4):1481–1492.
- Mack S, Coassin S, Rueedi R, et al. A genome-wide association meta-analysis on lipoprotein (a) concentrations adjusted for apolipoprotein (a) isoforms. J Lipid Res. 2017;58(9):1834–1844.
- Zekavat SM, Ruotsalainen S, Handsaker RE, et al. Deep coverage whole genome sequences and plasma lipoprotein(a) in individuals of European and African ancestries. Nat Commun. 2018;9(1):2606.
- Braun KVE, Dhana K, de Vries PS, et al. Epigenome-wide association study (EWAS) on lipids: the rotterdam study. Clin Epigenetics. 2017;9(1):15.
- Sayols-Baixeras S, Tiwari HK, Aslibekyan SW. Disentangling associations between DNA methylation and blood lipids: a Mendelian randomization approach. BMC Proc. 2018;12(S9):23.
- Jones GT, Hill BG, Curtis N, et al. Comparison of three targeted approaches to screening for abdominal aortic aneurysm based on cardiovascular risk. Br J Surg. 2016;103(9):1139–1146.
- Jones GT, Phillips LV, Williams MJA, et al. Two C-C family chemokines, eotaxin and RANTES, are novel independent plasma biomarkers for abdominal aortic aneurysm. J Am Heart Assoc. 2016;5(5). DOI:10.1161/JAHA.115.002993
- Pidsley R, Zotenko E, Peters TJ, et al. Critical evaluation of the illumina methylationEPIC beadchip microarray for whole-genome DNA methylation profiling. Genome Biol. 2016;17(1):208.
- Chen Y-A, Lemire M, Choufani S, et al. Discovery of cross-reactive probes and polymorphic CpGs in the illumina infinium humanmethylation450 microarray. Epigenetics. 2013;8(2):203–209.
- Du P, Zhang X, Huang -C-C, et al. Comparison of beta-value and M-value methods for quantifying methylation levels by microarray analysis. BMC Bioinformatics. 2010;11(1):587.
- Horvath S. DNA methylation age of human tissues and cell types. Genome Biol. 2013;14(10):R115.
- Houseman EA, Accomando WP, Koestler DC, et al. DNA methylation arrays as surrogate measures of cell mixture distribution. BMC Bioinformatics. 2012;13(1):86.
- Salas LA, Koestler DC, Butler RA, et al. An optimized library for reference-based deconvolution of whole-blood biospecimens assayed using the illumina humanmethylationEPIC beadarray. Genome Biol. 2018;19(1):64.
- Turner SD. qqman: an R package for visualizing GWAS results using Q-Q and manhattan plots. biorXiv. 2014.
- Tsimikas S, Lau HK, Han K-R, et al. Percutaneous coronary intervention results in acute increases in oxidized phospholipids and lipoprotein(a): short-term and long-term immunologic responses to oxidized low-density lipoprotein. Circulation. 2004;109(25):3164–3170.
- Leibundgut G, Scipione C, Yin H, et al. Determinants of binding of oxidized phospholipids on apolipoprotein (a) and lipoprotein (a). J Lipid Res. 2013;54(10):2815–2830.
- Jones GT, Tromp G, Kuivaniemi H, et al. Meta-analysis of genome-wide association studies for abdominal aortic aneurysm identifies four new disease-specific risk loci. Circ Res. 2017;120(2):341–353.
- Machiela MJ, Chanock SJ. LDlink: a web-based application for exploring population-specific haplotype structure and linking correlated alleles of possible functional variants. Bioinformatics. 2015;31(21):3555–3557.
- Purcell S, Neale B, Todd-Brown K, et al. PLINK: a tool set for whole-genome association and population-based linkage analyses. Am J Hum Genet. 2007;81(3):559–575.
- Rosenbloom KR, Sloan CA, Malladi VS, et al. ENCODE data in the UCSC genome browser: year 5 update. Nucleic Acids Res. 2013;41(D1):D56–63.
- Roadmap Epigenomics Consortium, Kundaje A, Meuleman W, et al. Integrative analysis of 111 reference human epigenomes. Nature. 2015;518(7539):317–330.
- Kent WJ, Sugnet CW, Furey TS, et al. The human genome browser at UCSC. Genome Res. 2002;12(6):996–1006.
- International Human Genome Sequencing Consortium, Lander ES, Linton LM, et al.. Initial sequencing and analysis of the human genome. Nature. 2001;409:860–921.
- Lonsdale J, Thomas J, Salvatore M. Genotype-tissue expression consortium, the genotype-tissue expression (GTEx) project. Nat Genet. 2013;45(6):580–585.
- Bopp S, Kochl S, Acquati F, et al. Ten allelic apolipoprotein[a] 5’ flanking fragments exhibit comparable promoter activities in HepG2 cells. J Lipid Res. 1995;36(8):1721–1728.
- Wade DP, Clarke JG, Lindahl GE, et al. 5’ control regions of the apolipoprotein(a) gene and members of the related plasminogen gene family. Proc Natl Acad Sci U S A. 1993;90(4):1369–1373.
- Coassin S, Hermann-Kleiter M, Haun M, et al. A genome-wide analysis of DNA methylation identifies a novel association signal for Lp(a) concentrations in the LPA promoter. bioRxiv. 2019.
- Tsimikas S. A test in context: lipoprotein(a): diagnosis, prognosis, controversies, and emerging therapies. J Am Coll Cardiol. 2017;69(6):692–711.