
ABSTRACT
DNA methylation is an epigenetic mark that plays an important role in genetic regulation in eukaryotes. Major progress has been made in dissecting the molecular pathways that regulate DNA methylation. Yet, little is known about DNA methylation variation over evolutionary time. Here we present an investigation of the variation of DNA methylation and transposable element (TE) content in species of the filamentous ascomycetes Neurospora. We generated genome-wide DNA methylation data at single-base resolution, together with genomic TE content and gene expression data, of 10 individuals representing five closely related Neurospora species. We found that the methylation levels were low (ranging from 1.3% to 2.5%) and varied among the genomes in a species-specific way. Furthermore, we found that the TEs over 400 bp long were targeted by DNA methylation, and in all genomes, high methylation correlated with low GC, confirming a conserved link between DNA methylation and Repeat Induced Point (RIP) mutations in this group of fungi. Both TE content and DNA methylation pattern showed phylogenetic signal, and the species with the highest TE load (N. crassa) also exhibited the highest methylation level per TE. Our results suggest that DNA methylation is an evolvable trait and indicate that the genomes of Neurospora are shaped by an evolutionary arms race between TEs and host defence.
Background
Methylation of selected cytosines in DNA is an epigenetic mark that is associated with diverse and important cellular processes in eukaryotes [Citation1–Citation3], including transcriptional regulation and genome defence [Citation4–Citation9]. While the function of DNA methylation on gene regulation varies across kingdoms of the tree of life [Citation10–Citation12], its role in defending the genome against transposable elements (TEs: selfish elements that proliferate in spite of harmful effects on the host genome [Citation13,Citation14]), is conserved [Citation15–Citation17]. At the same time as providing defence, DNA methylation may pose significant problems to the organism. On occasion, the reduction of gene expression due to the methylation status of nearby TEs could prove adaptive [Citation18]. More generally, however, spreading of epigenetic regulation of TEs is expected to lead to deleterious effects of nearby genes, typically by reducing gene expression and thereby genome function [Citation19–Citation24]. The trade-off in the use of methylation for epigenetic silencing of TEs may result in selection to act on the DNA methylation pattern and also influence the distribution of TEs in the genome [Citation22–Citation24].
Comparative studies of the variation of DNA methylation and TE distribution among closely related species are needed to unravel their rate of change over evolutionary time, and possible interactions between them. To date, these types of studies have been limited to widely diverged taxa across fungi, plants, and animals, e.g. [Citation1,Citation3,Citation25,Citation26] and a limited number of studies have so far focused on recently diverged species [Citation27]. Here we present a comparative study of closely related species of the filamentous ascomycete Neurospora. Major contributions to our knowledge about epigenetic TE silencing and DNA methylation is derived from studies of Neurospora crassa. This model species uses both transcriptional and post-transcriptional gene silencing pathways to inactivate TEs [Citation28]. The molecular mechanisms leading to the formation of 5-methylcytosine (5 mC) in N. crassa are representative of other eukaryotes [Citation29], and in laboratory strains of this species, previous studies have shown that about 1.5% of cytosines in the genome are methylated [Citation30,Citation31]. Furthermore, in N. crassa, nearly all methylated sites are located within TEs and repetitive DNA sequences that have undergone Repeat Induced Point (RIP) mutations [Citation29,Citation32,Citation33]. The resulting AT-biased sequences from RIP mutations become potent signals for trimethylation of histone H3 at the lysine9 (H3K9me3), which subsequently leads to de novo DNA methylation [Citation34,Citation35]. While the importance of DNA methylation as one of the several mechanisms to control TE proliferation in fungi is widely accepted (e.g. [Citation3,Citation36]), the deleterious effects of TE methylation on gene expression of neighbouring genes in fungal species is understudied, and is limited only to recent studies of the basidiomycete white-rot fungus Pleurotus ostreatus [Citation19,Citation37], in which the correlation between TE methylation and suppression of nearby genes was documented.
With the aim to uncover the variation in DNA methylation and its interaction with TEs over short evolutionary time, we used bisulphite-sequencing methodology to generate genome-wide DNA methylation maps at single-base resolution from individuals representing five closely related Neurospora species with the divergence time of 2 MY or less. Furthermore, we gathered data on genomic TE content and gene expression of the same set of strains. Using this broad dataset, we show variation in global DNA methylation levels among the genomes. We also document variation in methylation of genomic TE content that we attribute to signatures of lineage-specific TE invasion and selection. Upon comparing the strength of genome defence in terms of both methylation and purifying selection among the species, this is most pronounced in genomes with high TE load, suggesting an evolutionary arms race between TEs and host defence in this group of fungi.
Results
The Neurospora methylome data
We performed whole-genome bisulphite sequencing of 10 haploid strains of Neurospora. This sample set includes two strains each of Neurospora crassa, N. sitophila and three phylogenetically and reproductively isolated lineages of N. tetrasperma, herein referred to as different species (Supplementary Table S1). Phylogenetic analyses suggest that N. sitophila and N. tetrasperma have diverged more recently than each of them from N. crassa [Citation38,Citation39]. The two strains of each species are of different mating type (A or a: Supplementary Table S1); and for each strain, data were collected for tissues from two life stages (i.e., vegetative and pre-sexual growth) and were analysed as merged datasets. Our sequencing effort resulted in, on average, 25.2 million paired reads per strain after removing adaptor contaminations (Supplementary Table S2). Among these, about 21 million paired reads of each strain aligned uniquely to the corresponding genome (mapping efficiency of 83%), resulting in, on average, 80% of the approximately 40 Mb genomes covered with at least 30X read depth (Supplementary Table S2), and the average read coverage of transposable elements (TEs) varied between 27X to 38X. Bisulphite conversion efficiency was 99.5%, which was estimated from the fraction of converted cytosines (Cs) in Lambda DNA (Supplementary Table S3), suggesting a low false positive rate. The MethPipe analysis showed that 75% of total Cs present in N. crassa, 78% in N. sitophila and over 76% in N. tetrasperma were covered by at least 4 sequencing reads (Supplementary Table S4). For each sample, we obtained on average 30X sequencing depth per site (Supplementary Table S5). We called methylated cytosine (mC) sites as cytosines with ≥4X sequencing read coverage and at least 1 sequence read not converted during bisulphite sequencing.
Genome-wide DNA methylation level varies among species of Neurospora
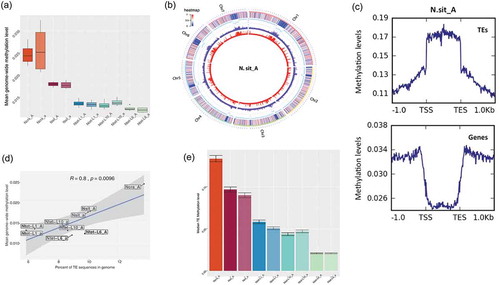
Our data show that the genome-wide DNA methylation level varies among the investigated Neurospora genomes. By using different methods (i.e., MethPipe and Bismark programs) to estimate global DNA methylation level, we found that the genomes of N. crassa were the most methylated, followed by genomes of N. sitophila, which in turn were more methylated than the genomes of the N. tetrasperma species. For example, the mean methylation levels per cytosine, estimated with MethPipe, showed variation between 0.025 in N. crassa to 0.012 in N. tetrasperma Lineage 6 (), Supplementary Tables S4-S7). Analyses of the fraction of mCs and weighted methylation also resulted in the same trend. Consistent results between strains of the same species suggest that methylation level is a trait that vary at the species level.
Figure 1. DNA methylation levels and distribution in the genomes of Neurospora species.
Conserved pattern of DNA methylation along chromosomes
Despite the variation in global levels of DNA methylation, the overall chromosomal distribution between the investigated genomes was conserved. First, we found a similar sequence context pattern of DNA methylation in Neurospora: in all investigated genomes, mC sites were found in all three sequence contexts: CG, CHG and CHH (where H is A, C or T), but considerably higher methylation occurred in the CHH context (Supplementary Figure S1, Supplementary Tables S8-S9). Second, by mapping the distribution of mCs along chromosomes, we found that DNA methylation was relatively evenly distributed across the genomes of the mat A strains of N. crassa, N. sitophila and N. tetrasperma L6, for which the best genome assemblies are available (), Supplementary Figure S2). The exception being one highly methylated region per chromosome that likely correspond to the putative centromeres; previous reports in N. crassa have demonstrated that centromeres in this species are heavily methylated [Citation32,Citation40].
DNA methylation level variation correlates with genomic TE content
Transposable elements (TE) are typically targeted by methylation. Genome-wide differences in DNA methylation level between the species may thus be explained by the proportion of TEs in the genome and/or the level of methylation of the TEs. To test this expectation, targeted analyses of TEs and genes and their respective 1 kb flanking regions were performed. Higher methylation level was found inside TE regions of all genomes relative to their flanking non-TE regions (); Supplementary Figure S3). Furthermore, analysis of the TE content in each of the investigated genomes revealed that N. crassa, for which we found the highest methylation level, had the highest proportion of TEs in its genome (about 14%), as compared to N. sitophila (10%) and the different species of N. tetrasperma (5–10%) (), Supplementary Table S10). Consistently, we found a statistically significant positive correlation between mean methylation level and the genome proportion of TEs.
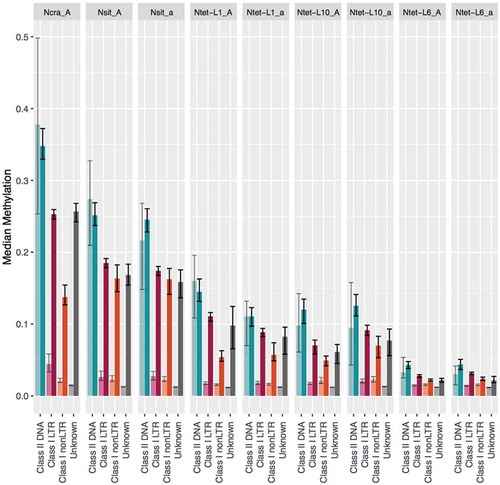
Furthermore, differential methylation level of TEs among the genomes of the investigated species Reflected the genomic TE load. Specifically, the mean methylation of TEs reached 0.133 in N. crassa, 0.094 in N. sitophila, 0.054 in N. tetrasperma L1, 0.046 in N. tetrasperma L10, and 0.021 in N. tetrasperma L6 ()).
The interaction between DNA methylation level and RIP
RIP mutations result in increased AT content in the affected sequence. The expected correlation between RIP (proxied herein by AT-enriched sequences) and DNA methylation was confirmed in all genomes; DNA methylation clustered in regions low in GC (), Supplementary Figure S2). As expected, TEs longer than 400 bp (hereafter ‘long TEs’) were both more highly methylated and more AT-biased than shorter TEs (Supplementary Figure S4), indicating that they were heavily RIP mutated. The same pattern was found in all investigated genomes; the size-sensitive RIP process is thus not only limited to N. crassa [Citation41–Citation43]. Notably, our data suggest that DNA methylation level and RIP do not covary; when estimating the median methylation and proportion of AT for TEs at different genomic locations, we saw that while the methylation level of long TEs varied among species, the proportion of AT did not (Supplementary Figure S5).
Relationship between DNA methylation level and TE and gene characteristics
To reveal whether DNA methylation associates with specific classes of TEs, we analysed separately TEs of Class I (RNA retroelements that move by copy-and-paste mechanisms, including both LTR and nonLTR elements) and Class II (DNA transposons that transpose by cut-and-paste mechanisms) elements. We determined that, in general, the Class II elements made up less of the genomic TE content than Class I RNA retrotransposons in the genomes (Supplementary Table S10), but were more methylated (). Furthermore, methylation of Class II TEs did not differ between length categories, while for Class I TEs, the long TEs were significantly more methylated than the short ones ().
Figure 2. DNA methylation levels of different transposable element (TE) classes in Neurospora genomes.
We analysed DNA methylation levels in different mC contexts across TEs and genes, and found that in TE regions, Cs in the CHH context exhibited higher methylation level than Cs in other contexts (with statistical support for lineages of N. tetrasperma and CHH compared to CHG in N. sitophila). Methylation level in the gene regions was highest when Cs was in CHG contexts (Supplementary Figure S6, Supplementary Table S11).
Leakage of DNA methylation from TEs
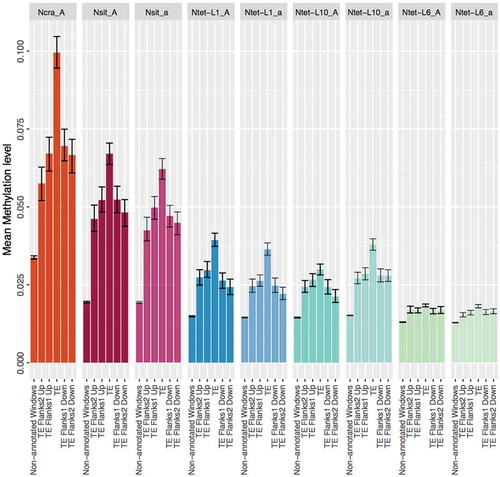
The non-annotated genomic regions of the Neurospora genomes, i.e., regions that were neither annotated as genes nor TEs, were methylated at low levels (median around 1% in all species). However, the differences in mean methylation is consistent with influence by leakage of DNA methylation from TEs into non-annotated genomic regions. Specifically, analyses of regions flanking the TEs of up to 200 bp showed that the level of DNA methylation decreased with distance from TEs, and was significantly higher in TE flanks than in random non-annotated windows (). Whether these adjacent 200 bp regions correspond to degraded TE relics cannot be ascertained; they were not detected as TE fragments in our analyses.
Figure 3. Leakage of DNA methylation from transposable elements (TEs) into non-annotated genomic regions in the genomes of Neurospora species.
The effect of TEs on gene expression
Up to this point, we showed that DNA methylation co-localized with TEs in the genome in a species-specific manner. However, the influence of TE location relative to genes and the level of TE methylation on gene expression has not yet been explored. Our data suggest that TEs have an impact on gene expression when they are inserted inside, or in the vicinity of, genes. Specifically, we showed that genes for which TEs are located inside or within a 200 bp window, gene expression was lower (Supplementary Figure S7).
Next, we investigated the correlation between TE methylation level and the expression of nearby genes. We found that the genes with methylated TEs inside or beside them (within 1 kb distance) were generally less expressed than those having no TEs in the vicinity (Supplementary Figure S8), but that the effect did not apparently depend on the level of TE methylation. These data suggest both a direct effect of TEs on gene expression, for example, by disruption of the open reading frame or promotor region, and/or an indirect effect by methylation leakage, but we were unable to disentangle direct from indirect effects of TEs and their methylation with this analysis.
Distribution of TEs relative to genes: signature of purifying selection
Footprints of purifying selection that has acted to remove TEs from the genomes can be revealed by investigating how TE characteristics such as length and distance to genes vary among the different Neurospora genomes, and how they correlate with methylation. We first investigated the distribution of TEs of different sizes relative to genes. We analysed the long and short TEs from three categories: TEs partly or fully overlapping with coding sequences (i.e., the gene body), TEs positioned in a 1 kb window upstream or downstream of genes, and TEs in gene-poor regions (i.e., farther than 1 kb from genes). On average, 402 TEs were located in the gene body (range: 227–833 TEs), 1,971 TEs within 1kb from genes (range: 1,755–2,269 TEs), and 3,065 TEs in gene-poor regions (range: 2,445–3,738 TEs). Consistent with purifying selection on TEs from within gene bodies, we found very low proportions of both long and short TEs within genes, and high proportions of TEs of both size classes in gene-poor regions. The TEs in gene-poor regions were significantly more abundant than those found in both gene bodies and 1 kb flanking region (Fisher’s exact test: <10−30 for all strains, Supplementary Table S12; )). For the 1 kb flanking regions, we found different frequency distributions depending on TE size. While short TEs were found at high frequencies in gene-flanking regions, long TEs are scarce ()) and appear to have been removed by purifying selection both from genes and their flanking regions.
Figure 4. Genomic distribution of transposable elements (TEs) relative to their proximity to genes in Neurospora genomes.
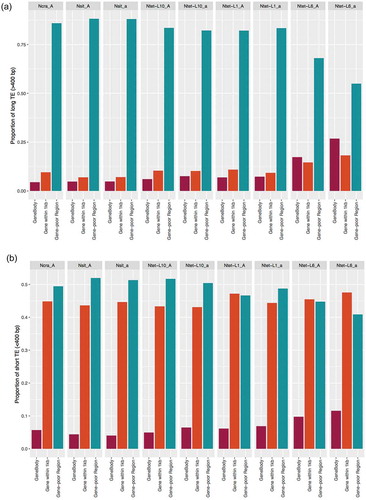
Noteworthy, the general patterns of TE distribution were conserved across all genomes (), but we also saw a species-specific pattern in the proportion of TEs present at the different locations. For example, N. tetrasperma L6 displayed a relatively higher proportion of TEs close to or inside genes, suggesting that selection for removal TEs from gene regions has been weaker than in the other species.
When we analysed methylation of TEs at different locations relative to genes, we found that for all species, the relatively few remaining long TEs found within 1 kb from genes ()) were more methylated than those in gene-poor regions (Supplementary Figure S5A). In contrast, the relatively few remaining TEs overlapping with gene bodies showed low levels of methylation and a lower frequency of AT nucleotides (Supplementary Figure S5), regardless of their size, suggesting these remaining TEs within genes are not detrimental to genome function and/or that the cost of the methylation is higher than the cost of the presence of the TE.
Discussion
Genome-wide pattern of DNA methylation at the species level, and the comparison between closely related species, allows inference of evolutionary changes. Comparative aspects of DNA methylation have been addressed in plants and animals [Citation1,Citation3,Citation22,Citation25,Citation26,Citation44,Citation45], but seldom in fungi where studies of DNA methylation have focused on single species, e.g. [Citation19,Citation36,Citation46]. The few comparative studies that have focused on the variation of DNA methylation and mechanism of action among fungal species have included phylogenetically widespread taxa [Citation3,Citation47,Citation48] and more recently in two Pleurotus species (Basidiomycotina) that diverged ca. 18 MYA [Citation49]. In order to best study comparative DNA methylation at the genome level and get the birds-eye view, we need good genome assemblies and single-base resolution whole genome bisulphite sequencing data; this was achieved in our study. Hence, datasets as the one generated in this study to address the interaction between DNA methylation and TE activity over a short evolutionary timescale are unique, and provide a novel opportunity to address the causes and consequences of DNA methylation as a mechanism for genome defence.
We found the genome-wide DNA methylation level to vary among the investigated species. Nevertheless, a number of traits were found to be conserved among the investigated species of Neurospora, and the patterns are consistent with what is known from other fungi. For example, the overall low methylation levels in the studied Neurospora species (ranging from 2.5% in N. crassa to 1.3% in N. tetrasperma) are consistent with previous reports on N. crassa [Citation30,Citation31] and other fungi [Citation3,Citation19,Citation46,Citation50–Citation52]. Furthermore, in our investigated genomes, TEs were the main target of methylation, while DNA methylation elsewhere in the genome was lower; a pattern similar to that previously reported in N. crassa and other fungi [Citation3,Citation32]. In N. crassa active TEs have not been found (with the exception of one strain [Citation53]) and the remaining degraded insertions are often considered as TE relics. We observed that TEs in other Neurospora species in this study also displayed signatures of degradation (C-to-T substitution, data not shown) by the genome defence mechanism Repeat Induced Point (RIP) mutation, and are here also considered to be inactive. The TEs longer than 400 bp were more targeted by RIP mutations and DNA methylation than shorter TEs in all investigated species, a pattern previously known in N. crassa [Citation33,Citation42,Citation43].
Two 5mC methyltransferase genes (5mC MTases), DIM-2 and RID, have been reported in N. crassa [Citation54,Citation55] and DIM-2 functions to methylate DNA [Citation55]. In all Neurospora genomes in this study, we found both DIM-2 and RID using blastn (>92% identity and E-value = 0). We could also verify that these two genes were expressed in tissues of both life stages in all species (data not shown). In all Neurospora genomes in our study, we found consistently higher CHH methylation, in accordance with results from mechanistic studies in N. crassa [Citation56]. However, the higher CHH methylation is in contrast to other fungal genomes that have orthologous DIM-2; e.g., CpG methylation is predominant in Heterobasidion parviporum and P. ostreatus, while CHG is predominantly methylated in Magnaporthe oryzae [Citation19,Citation46,Citation52]. The variation in methylation context in these fungal species suggests that divergent functions of 5mCs MTases results from evolutionary differences in methylation mechanisms in association with their genome and lifestyle [Citation57].
We also noted that in all species in our study, DNA methylation varied according to TE classes; while Class II DNA TEs occurred in low frequency in the genomes of most species, they were more methylated than Class I RNA retrotransposons. This result is consistent with data from the TIR family transposons, which is a subclass of DNA TEs in P. ostreatus. They were also detected in low frequency, displayed high methylation levels and their expression was completely suppressed [Citation19]. This result may reflect that Class II DNA TEs in fungi are more detrimental for the host genome than Class I TEs, and consequently are under stronger selection to be purged from the genome, and also more efficiently targeted by genome defence. The difference in frequency between Class I and Class II elements may also reflect that the Class I elements transpose by a copy-and-paste mechanism via an RNA intermediate, and that Class II elements transpose by a cut-and-paste mechanism, relying on transposition during host genome replication to increase in copy number [Citation58]. Furthermore, it is unknown if and how TE families from different classes interact with one another [Citation59,Citation60]. It may be stochastic processes that drive our observation that DNA TEs are less frequently occurring in the genomes, but it is also possible that TEs compete with each other for metabolic resources needed for transposition, for space in the genome or to avoid the host defence systems [Citation61], and that such interaction results in fewer DNA TEs.
While TEs were in general observed to be methylated, most genes were not. This result is in line with previous studies in N. crassa by Bewick et al. [Citation57], and Selker et al. [Citation62]. Still, a small subset of Neurospora genes showed higher methylation levels than any of the genes in the unmethylated Lambda genome (data not shown). These genes showed similar methylation levels to those in the TEs. Further studies are needed to validate our indications of gene methylation, and to address its biological significance.
Moreover, leakage of methylation from TEs into the surrounding regions (in accordance with previous reports from N. crassa [Citation33,Citation63,Citation64]), and the negative correlation between the presence of methylated TEs inside or nearby the genes with gene expression, both suggest that TEs directly by disruption of gene function, or indirectly through DNA methylation, imply a cost to genomes [Citation37]. Although the negative effect of DNA methylation of TEs in plants has been reported in different studies [Citation20–Citation22], it has not been shown in fungal species until recently [Citation19,Citation49,Citation52]. Additional, and targeted, analyses are needed in order to confirm a negative effect of TE methylation on gene expression. Nevertheless, our data lends support to a negative consequence of TE methylation on the expression of nearby genes, and that this trade-off has been a part of shaping the pattern of TE distribution in the genome [Citation22–Citation24].
Our data further suggest that purifying selection acts on the frequency of TEs, with respect to their location relative to genes, in a conserved pattern across all these species. Furthermore, the observed high methylation of TEs in gene-poor regions highlights the deleterious effect of TE methylation in the gene-rich regions. Therefore, we propose that in Neurospora species, both the direct cost of TEs and the cost of methylation of TEs in gene-dense regions lead to preferential purging of TEs, and hence affect the genomic distribution of TEs. Similarly, studies in Arabidopsis and Drosophila showed that long TEs targeted by silencing mechanisms are purged from gene-dense regions [Citation22,Citation65].
Signatures of an evolutionary arms race between TE invasion and genome defence can be inferred to have shaped the Neurospora genomes. First, the variation of the investigated traits in this study, such as TE load and DNA methylation level, reflected a phylogenetic signal, suggesting that these traits are evolving at the studied time perspective; N. crassa is more distantly related to N. sitophila and N. tetrasperma than these are to each other [Citation38,Citation39] and the investigated traits vary accordingly. The finding that the species with the highest TE load (i.e., N. crassa) was also the species showing the most efficient defence by having the highest methylation per TE suggests that TE load has driven the evolution of an efficient defence strategy in this species. At the other end of the spectrum, N. tetrasperma has fewest TEs and the least methylation, while N. sitophila shows intermediate characters for both TE and methylation.
In summary, we leveraged the resolution afforded by whole genome bisulphite sequencing to study the evolution of DNA methylation in the model organism N. crassa and its sister species. Only until recently has the patterns and function of DNA methylation been possible in fungi with such detail. Our results highlight the variability of a conserved cellular process, and opens up for future studies on factors driving the divergence of DNA methylation as an epigenetic defence mechanism.
Material and methods
Fungal material used in the study
In this study, we used 10 haploid strains of Neurospora. These strains belong to N. crassa, N. sitophila and three phylogenetically and reproductively isolated lineages of N. tetrasperma [Citation38,Citation39,Citation66] (Supplementary Table S1), referred to herein as different species. For each species, we included one strain of each mating type (mat A or mat a). All strains were obtained from the Fungal Genetics Stock Centre (FGSC, http://www.fgsc.net).
Growth conditions and nucleic acid extractions
For preparation of inocula, each homokaryotic strain (Supplementary Table S1) was grown on Vogel’s Medium N, with 1% sucrose as the carbon source [Citation67] for about 7 days, conidia were then harvested and grown in glass tubes with Vogel’s Medium N. Newly produced conidia were harvested from the surface of the mycelium and suspended in 0.01% tween ddH2O. The centre of 90 mm Petri dishes containing growth media, covered with cellophane sheet, were inoculated with 10 µl of conidia suspensions of each homokaryon strain and allowed to grow at 25°C with 12:12 h light-dark conditions. For tissue collection during vegetative development, strains were grown on solid Vogel’s medium N for 2 days. At this stage, mycelia covered the plate and only the vegetative structures were produced (mycelia and conidia). To obtain pre-sexual development tissue, strains we grown on modified Vogel’s Medium N [Citation68] which has a low amount of nitrogen and promotes sexual reproduction, for 7 days. At this stage, the tissue was a mix of mycelia, conidia, and protoperithecia, which are the pre-mature sexual structures. Two replicates for each life stages were grown simultaneously, with plates randomized between two incubators.
Tissue was harvested from the surface of the cellophane using a sterilized scalpel. Tissue from the same plate was divided into two parts: one part of the tissue was stored at −20°C for DNA extraction and second part was immediately frozen in liquid nitrogen and stored at −80°C for RNA extraction. Tissue for three biological replicates of each treatment was harvested from three different plates.
Whole genome DNA was extracted using the Fungal/Bacterial Microprep kit (Zymo Research, Cat# D6007) according to the manufacturer’s recommendation. For transcriptome analysis, total RNA was extracted from vegetative and sexual tissue using miRNeasy Mini Kit (Qiagen, Cat# 217004). Traces of DNA were removed by DNase I treatment (Fermentas, Cat# 89836). RNA concentration and quality were determined spectrophotometrically using Nano-Drop (Thermo Scientific), and RNA quality was assessed after electrophoresis on an Agilent Bioanalyzer using the RNA 6000 nano kit (Agilent Technologies, Cat# 5067–1511) according to the manufacturer’s instructions.
Bisulphite sequencing
Genomic DNA was sent to the SNP&SEQ Technology Unit (SciLifeLab, Uppsala, Sweden), where libraries were prepared from 100 ng of DNA using the TruSeq Methylation kit (Illumina Inc, Cat# EGMK91324) according to the manufacturer’s protocol (#15066014). To determine the bisulphite conversion rate and as a quality control for bisulphite treatment, unmethylated Lambda DNA (Promega, Cat# D152A) was spiked into each of the samples at 0.1% in the library preparation procedure. Sequencing was performed on Illumina HiSeq 2500 platform to generate 125 bp paired-end reads. For methylation analysis, we individually sequenced tissue from two biological replicates from each of the two life stages.
RNA sequencing
Sequencing libraries for mRNA were constructed using Illumina TruSeq mRNA library preparation kits (Illumina Inc, Cat# RS-122-2101/2102), including poly-A selection, according to the manufacturer’s protocol (#15031047). Sequencing was performed on Illumina Hiseq 2500 platform at the SNP&SEQ Technology Unit to generate 125 bp paired-end reads. RNA-seq data was obtained on the same set of samples as bisulphite data, with one more replicate per treatment (three replicates in total).
Genomic resources
For each strain used in this study, we either downloaded the genome sequence and assembly from various genome resources [Citation41,Citation69,Citation70], or generated the sequence data ourselves. Genome assembly statistics can be found in Supplementary Table S1. Note that the genome assembly for N. crassa mat a is not available. We sequenced the N. sitophila genomes on the PacBio RSII platform (Pacific Biosciences) at Uppsala Genome Centre (SciLifeLab, Uppsala, Sweden) using four SMRT cells per sample and the C4 chemistry and P6 polymerase (Pacific Biosciences). The strains were prepared as in Svedberg et al. [Citation71]. Raw PacBio sequence data were filtered and assembled using the SMRT Analysis package and HGAP 3.0 assembler (Pacific Biosciences, https://github.com/PacificBiosciences/). The assembly size of FGSC5940 (N. sitophila mat A) is 38 Mb (15 contigs; 7 contigs mapping to the seven chromosomes of the N. tetrasperma L6 mat a reference genome) and FGSC5941 (N. sitophila mat a) is 38.4 Mb (25 contigs, 7 contigs mapping to same genome as above). Mean coverage of 94.2X and 97.5X of was achieved, respectively.
To sort and reorder the contigs into scaffolds in N. tetrasperma, genomes from L1 (mat A and mat a), L10 (mat A and mat a), and L6 (mat A) were all aligned to the N. tetrasperma L6 mat a genome using MUMmer (Version 3.9.4alpha) [Citation72]. We generated annotations for each genome, except for N. tetrasperma L6 and N. crassa where gff and protein fasta files are available from ENSEMBL Fungi (https://fungi.ensembl.org/index.html [Citation73]). Annotations were produced using MAKER [Citation74] and functions were assigned to predict proteins using an all-to-all BLAST search against a Neurospora database assembled using available protein sequences from UniProt (https://www.uniprot.org/ [Citation75]).
Transposable element detection in genomes
RepeatMasker version open-4.0.6 (http://www.repeatmasker.org [Citation76]) was used to identify repetitive sequences in the genomes of all studied species, with the exception of N. crassa mat a (for which no genome assembly is available), using the previously generated Neurospora repeat library [Citation77]. Manual curation of the RepeatMasker output (i.e., .out file) removed low complexity sequences and simple repeats. Regardless of whether they are active or not, we considered the remaining repetitive sequences as transposable elements (TEs), and we categorized them broadly as Class II DNA-like transposons or Class I RNA retrotransposons. The Class I retrotransposons were further distinguished as long terminal repeat (LTR)-like retroelements, nonLTR elements (i.e., long interspersed nuclear element [LINE] and short interspersed nuclear element [SINE]); and unknowns (Supplementary Table S10). The unknown fraction of TEs was those for which RepeatMasker could not further characterize. Signature of Repeat Induced Point (RIP) mutation (C-to-T substitution) was identified for 5–10 of the most abundant consensus sequences for each Neurospora species by manually checking alignments of individual insertions in the respective genome assemblies. All investigated sequences were RIP mutated (data not shown).
Analysis of bisulphite sequencing reads
The adaptor sequences were removed from the paired-end sequences using TrimGalore (Version 0.4.1; parameters: trim_galore ––paired ––trim1). Quality control was carried out using multiqc (Version 0.8). The reads were then mapped to the corresponding Neurospora genomes (Supplementary Table S1), except for N. crassa mat a where we used the genome of strain FGSC2489 (mat A) as a reference; as well as Lambda DNA genome (GenBank: J02459.1), using the Bismark aligner (Version 0.16.2) [Citation78] with the following parameters: -n 1 –un. The reference genomes were first transformed into a bisulphite-converted version (C-to-T and G-to-A conversions) and then indexed using Bowtie2 [Citation79]. Sequenced reads were also transformed into two versions. After alignment, uniquely mapped reads were reduplicated using the deduplicate_bismark tool. The resulting bam files then were sorted using samtools (Version 1.5) [Citation80] and the mapping quality was checked using QualiMap (version 2.2) [Citation81].
We used two programs, MethPipe (Version 3.4.3) [Citation82] and Bismark to call the methylation sites and make sure of the accuracy of the methylation levels. To compute single site methylation levels in MethPipe, briefly, the alignment bam file from Bismark converted to mr file using MethPipe ‘to-mr’ function. The methylation level at each cytosine site then was counted using ‘methcounts’ function from MethPipe. To determine the methylated sites in the Bismark program, the bismark_methylation_extractor tool was used (parameter: bismark_methylation_extractor ––paired-end ––no_overlap ––comprehensive ––cytosine_report ––CX ––bedGraph ––report ––gzip ––ignore 12 ––ignore_r2 12 ––ignore_3prime 3 ––ignore_3prime_r2 3). For all analyses, cytosines with at least four reads were filtered. The sodium bisulphite conversion rate was determined from the methylated sites computed by the Bismark program. Ideally, the all Cs in Lambda DNA should be converted to T, as it is an unmethylated genome. Thus, the conversion efficiency was determined as the percentage of converted cytosines in Lambda genome.
Genome-wide analysis of DNA methylation
Genome-wide mean methylation level, weighted methylation levels and fraction of mC [Citation83] was calculated from methylated cytosines computed by Bismark and MethPipe using ‘levels’ function in MethPipe separately for each replicate. The methylation level differences were tested by one-way ANOVA followed by Tukey test for multiple pairwise comparisons in R (R version 3.3.2) [Citation84]. The average of global methylation levels was calculated separately for each of the two replicates for each of the life stages (in total four data points) from each strain. For all other analyses, to increase the coverage per cytosine site, we merged the read information of two biological replicates using the ‘merge-methcounts’ function from MethPipe, resulting in one sample for each life stage and strain. The average methylation level of each genomic feature (genes/TEs/non-annotated regions) for each life stage was normalized to the number of cytosines per feature in both life stages. We plotted the mean methylation, unless the distribution of the data was apparently not normally distributed (e.g., zero-inflated probability distribution, or a binomial/multinomial distribution) at which point we show the median. Bisulphite sequencing reads from N. crassa mat a was mapped to the N. crassa mat A assembly due to the lack of an N. crassa mat a assembly.
Distribution of methylation levels, GC content, gene and TEs across chromosomes were conducted by dividing the genomes into 10 kb windows, using different functions in BEDTools (Version 2.26.0) [Citation85]. Circos plots were generated using the Bioconductor OmicCircos R package [Citation86]. Profile of DNA methylation levels in TEs and genes and their 1 kb flanking regions for all the C contexts and also separately for each C context (CpG, CHG, and CHH, where H is A, C or T) were generated using deepTool (Version 2.3.1) [Citation87]. To make the Circos plots and methylation profile plots, the methylation levels from tissues from the two life stages were merged and the methylated cytosines (mCs) with at least four reads were analysed. Correlations between proportion of TEs and mean methylation levels of genome were tested with linear regression analysis in R.
To calculate the mean methylation level of genomic regions (genes/TEs/non-annotated), the methylation files generated by MethPipe were overlapped onto each genomic region using the ‘map’ function in BEDTools. For all the analyses, we obtained the average methylation levels of two life stages per each genomic region, unless noted in the legend.
To demonstrate DNA methylation leakage from TEs into surrounding regions, the methylation levels for TEs and TE flanking regions (two adjacent 100 bp bins up- and downstream) were computed and compared with the average methylation levels of 100 bp bins on the non-annotated regions (regions that lack TEs and genes). Flank regions that overlapped with other TEs, or had another TE in the next 100 bp up- or downstream, were removed, and TEs with at least one free flank (no overlap with another TE) were kept for further analysis.
TE characteristics
TE length was determined for each TE fragment from the filtered RepeatMasker output. Fragments with the same unique ID, assumed to belong to the same TE, were concatenated. For analyses of long and short TEs, TEs whose length was more than 400 bp was considered as long TEs, and TEs shorter than 400 bp were considered as short TEs. TE distance relative to genes was determined as follows: TEs could be located inside the gene, 1 kb upstream or downstream of the gene, or >1 kb from the gene, which is considered as a gene-poor region, due to the compact nature of the investigated fungal genomes [Citation41]. To maximize congruence of annotations between strains, we computed distance of TE to gene using the coding sequence (CDS) rather than the whole gene length. For each TE, the frequency of [G + C] nucleotides (hereafter GC) was quantified. To obtain a proxy for RIP mutation (1- (frequency of GC nucleotides)) was calculated. The larger the proportion, the higher RIP activity was assumed. Methylation level differences between the TE classes were determined after dividing the TEs into four fractions: Class I LTR and Class I nonLTR elements, Class II DNA elements, and unknown.
Analysis of transcriptome data and connection to methylated regions and TEs
RNA reads were first filtered for rRNA content, then trimmed using Trimmomatic [Citation88] and mapped to their respective strain genome, except for N. crassa where we used the genome of strain FGSC2489 (mat A) as a reference, using STAR [Citation89]. Mapping efficiency was 60–70% on average. ‘Features counts’ from Subread was then used to generate counts at the gene level. Levels of expression were then analysed using the package edgeR in R [Citation90]. After building the DGEList, counts on CDS were normalized across libraries of all strains, using orthologues. Normalization factors were then used on each strain library. Then, FPKM were computed, allowing comparison of the expression of genes within each strain across treatments. FPKM are normalized by length of genes, so expression can also be compared among different genes, for example, between genes nearby TE and genes that are not. Genes were considered expressed if the number of samples above a cpm threshold was 3 or more. Threshold was taken as 10/L, where L is the minimum library size in millions, as recommended in Chen et al. [Citation91]. In doing so, we excluded potential pseudogenes or mis-annotated genes.
The influence of TEs presence on the expression of nearby genes (to 1 kb up- and down-stream, respectively) was determined by sorting the genes (using their CDS) into seven categories according to the presence/distance of the nearest TE: Genes without TE in 1 kb distance, genes having TE inside or overlap with their CDS, and genes that are in proximity of TEs in 200 bp up to 1 kb: the first bin D1 = TE less than 200 bp from CDS, D2: 200–400 bp, D3: 400–600 bp, D4: 600–800 bp, and D5: 800–1000 bp. 95% confidence interval (CI) on expression was computed for each bin. Only expressed genes were kept for this analysis. The number of genes per bin associated with Supplementary Figure S7 is found in Supplementary Table S13.
To analyse the influence of TE methylation level on the expression of genes that contain TEs inside or beside (within 1 kb of gene), these TEs were sorted into five rank-based methylation bins and nearest-gene expression was compared with the genes lacking TEs inside/beside their CDS. The gene expression median and 95% CI were computed for each bin. Only expressed genes were used for this analysis.
Data Access
All raw sequencing reads generated in this study have been deposited at the Sequence Read Archive as BioProjects PRJNA505300 and PRJNA505304. Genome assemblies based on PacBio reads, genome annotation files, and RepeatMasker TE annotation files have been deposited at Figshare (https://doi.org/10.6084/m9.figshare.c.4302929.v1).
Supplemental Material
Download Zip (4.2 MB)Acknowledgments
We thank Nahid Heidari and Markus Hiltunen for excellent technical help. Johan Reimegård is financially supported by the Knut and Alice Wallenberg Foundation as part of the National Bioinformatics Infrastructure Sweden at SciLifeLab. This work was funded from Nilsson-Ehle Endowments and Stiftelsen Lars Hiertas Minne foundations, and a European Research Council grant under the program H2020, ERC-2014-CoG, project 648143 (SpoKiGen; H.J.).
Disclosure statement
The authors declare that they have no competing interests.
Supplementary material
Supplemental data for this article can be accessed here.
Additional information
Funding
References
- Feng SH, Cokus SJ, Zhang XY, et al. Conservation and divergence of methylation patterning in plants and animals. Proc Natl Acad Sci USA. 2010;107:8689–8694.
- Suzuki MM, Bird A. DNA methylation landscapes: provocative insights from epigenomics. Nat Rev Genet. 2008;9:465.
- Zemach A, McDaniel IE, Silva P, et al. Genome-wide evolutionary analysis of eukaryotic DNA methylation. Science. 2010;328:916–919.
- Heard E, Disteche CM. Dosage compensation in mammals: fine-tuning the expression of the X chromosome. Genes Dev. 2006;20:1848–1867.
- Jones PA, Takai D. The role of DNA methylation in mammalian epigenetics. Science. 2001;293:1068–1070.
- Lister R, O’Malley RC, Tonti-Filippini J, et al. Highly integrated single-base resolution maps of the epigenome in arabidopsis. Cell. 2008;133:523–536.
- Lister R, Pelizzola M, Dowen RH, et al. Human DNA methylomes at base resolution show widespread epigenomic differences. Nature. 2009;462:315–322.
- Reik W, Walter J. Genomic imprinting: parental influence on the genome. Nat Rev Genet. 2001;2:21–32.
- Slotkin RK, Martienssen R. Transposable elements and the epigenetic regulation of the genome. Nat Rev Genet. 2007;8:272–285.
- Law JA, Jacobsen SE. Establishing, maintaining and modifying DNA methylation patterns in plants and animals. Nat Rev Genet. 2010;11:204.
- Wang X, Wheeler D, Avery A, et al. Function and evolution of DNA methylation in nasonia vitripennis. PLoS Genet. 2013;9:e1003872.
- Zilberman D, Gehring M, Tran RK, et al. Genome-wide analysis of Arabidopsis thaliana DNA methylation uncovers an interdependence between methylation and transcription. Nat Genet. 2007;39:61–69.
- Doolittle WF, Sapienza C. Selfish genes, the phenotype paradigm and genome evolution. Nature. 1980;284:601–603.
- Lonnig WE, Saedler H. Chromosome rearrangements and transposable elements. Annu Rev Genet. 2002;36:389–410.
- Goll MG, Bestor TH. Eukaryotic cytosine methyltransferases. Annu Rev Biochem. 2005;74:481–514.
- Selker EU. Genome defense and DNA methylation in Neurospora. Cold Spring Harb Sym. 2004;69: 119–124.
- Zhang X. The epigenetic landscape of plants. Science. 2008;320:482–492.
- Lippman Z, Gendrel AV, Black M, et al. Role of transposable elements in heterochromatin and epigenetic control. Nature. 2004;430:471–476.
- Borgognone A, Castanera R, Morselli M, et al. Transposon-associated epigenetic silencing during Pleurotus ostreatus life cycle. DNA Res. 2018;25:451–464.
- Choi JY, Purugganan MD. Evolutionary epigenomics of retrotransposon-mediated methylation spreading in rice. Mol Biol Evol. 2018;35:365–382.
- Eichten SR, Ellis NA, Makarevitch I, et al. Spreading of heterochromatin is limited to specific families of maize retrotransposons. PLoS Genet. 2012;8. DOI:10.1371/journal.pgen.1003127.
- Hollister JD, Gaut BS. Epigenetic silencing of transposable elements: A trade-off between reduced transposition and deleterious effects on neighboring gene expression. Genome Res. 2009;19:1419–1428.
- Lee YCG. The role of piRNA-mediated epigenetic silencing in the population dynamics of transposable elements in Drosophila melanogaster. PLoS Genet. 2015;11. DOI:10.1371/journal.pgen.1005269
- Lee YCG, Karpen GH. Pervasive epigenetic effects of Drosophila euchromatic transposable elements impact their evolution. Elife. 2017;6. DOI:10.7554/eLife.25762
- Li E, Zhang Y. DNA methylation in mammals. Csh Perspect Biol. 2014; 6a019133.
- Seymour DK, Koenig D, Hagmann J, et al. Evolution of DNA methylation patterns in the brassicaceae is driven by differences in genome organization. PLoS Genet. 2014;10:e1004785.
- Legrand S, Caron T, Maumus F, et al. Differential retention of transposable element-derived sequences in outcrossing Arabidopsis genomes. Mob DNA. 2019;10:30.
- Aramayo R, Selker EU. Neurospora crassa, a model system for epigenetics research. Csh Perspect Biol. 2013;5: a017921.
- Rountree MR, Selker EU. DNA methylation and the formation of heterochromatin in Neurospora crassa. Heredity (Edinb). 2010;105:38.
- Foss HM, Roberts CJ, Claeys KM, et al. Abnormal chromosome behavior in Neurospora mutants defective in DNA methylation. Science. 1993;262:1737.
- Russell PJ, Rodland KD, Rachlin EM, et al. Differential DNA methylation during the vegetative life cycle of Neurospora crassa. J Bacteriol. 1987;169:2902.
- Lewis ZA, Honda S, Khlafallah TK, et al. Relics of repeat-induced point mutation direct heterochromatin formation in Neurospora crassa. Genome Res. 2009;19:427–437.
- Selker EU, Fritz DY, Singer MJ. Dense nonsymmetrical DNA methylation resulting from repeat-induced point mutation in Neurospora. Science. 1993;262:1724.
- Tamaru H, Selker EU. A histone H3 methyltransferase controls DNA methylation in Neurospora crassa.. Nature. 2001;414:277–283.
- Tamaru H, Zhang X, McMillen D, et al. Trimethylated lysine 9 of histone H3 is a mark for DNA methylation in Neurospora crassa. Nat Genet. 2003;34:75.
- Montanini B, Chen P-Y, Morselli M, et al. Non-exhaustive DNA methylation-mediated transposon silencing in the black truffle genome, a complex fungal genome with massive repeat element content. Genome Biol. 2014;15:411.
- Castanera R, López-Varas L, Borgognone A, et al. Transposable elements versus the fungal genome: impact on whole-genome architecture and transcriptional profiles. PLoS Genet. 2016;12:e1006108.
- Corcoran P, Anderson JL, Jacobson DJ, et al. Introgression maintains the genetic integrity of the mating-type determining chromosome of the fungus Neurospora tetrasperma. Genome Res. 2016;26:486–498.
- Corcoran P, Dettman JR, Sun Y, et al. A global multilocus analysis of the model fungus Neurospora reveals a single recent origin of a novel genetic system. Mol Phylogenet Evol. 2014;78:136–147.
- Smith KM, Phatale PA, Sullivan CM, et al. Heterochromatin is required for normal distribution of Neurospora crassa CenH3. Mol Cell Biol. 2011;31:2528–2542.
- Galagan JE, Calvo SE, Borkovich KA, et al. The genome sequence of the filamentous fungus Neurospora crassa. Nature. 2003;422:859–868.
- Singer MJ, Marcotte BA, Selker EU. DNA methylation associated with repeat-induced point mutation in Neurospora crassa. Mol Cell Biol. 1995;15:5586.
- Watters MK, Randall TA, Margolin BS, et al. Action of repeat-induced point mutation on both strands of a duplex and on tandem duplications of various sizes in Neurospora. Genetics. 1999;153:705–714.
- Hollister JD, Smith LM, Guo YL, et al. Transposable elements and small RNAs contribute to gene expression divergence between Arabidopsis thaliana and Arabidopsis lyrata. Proc Natl Acad Sci USA. 2011;108:2322–2327.
- Zanni V, Eymery A, Coiffet M, et al. Distribution, evolution, and diversity of retrotransposons at the flamenco locus reflect the regulatory properties of piRNA clusters. Proc Natl Acad Sci USA. 2013;110:19842.
- Jeon J, Choi J, Lee G-W, et al. Genome-wide profiling of DNA methylation provides insights into epigenetic regulation of fungal development in a plant pathogenic fungus, Magnaporthe oryzae. Sci Rep. 2015;5:8567.
- Antequera F, Tamame M, Villanueva JR, et al. DNA methylation in the fungi. J Biol Chem. 1984;259:8033–8036.
- Binz T, D’Mello N, Horgen PA. A comparison of DNA methylation levels in selected isolates of higher fungi. Mycologia. 1998;90:785–790.
- Zhang ZB, Wen JW, Li JZ, et al. The evolution of genomic and epigenomic features in two Pleurotus fungi. Sci Rep. 2018;8:8313.
- Li W, Wang Y, Zhu J, et al. Differential DNA methylation may contribute to temporal and spatial regulation of gene expression and the development of mycelia and conidia in entomopathogenic fungus Metarhizium robertsii. Fungal Biol-Uk. 2017;121:293–303.
- Wang Y-L, Wang Z-X, Liu C, et al. Genome-wide analysis of DNA methylation in the sexual stage of the insect pathogenic fungus Cordyceps militaris. Fungal Biol-Uk. 2015;119:1246–1254.
- Zeng Z, Wu J, Kovalchuk A, et al. Genome-wide DNA methylation and transcriptomic profiles in the lifestyle strategies and asexual development of the forest fungal pathogen Heterobasidion parviporum. Epigenetics. 2019;14:16–40.
- Kinsey JA, Helber J. Isolation of a transposable element from Neurospora crassa. Proc Natl Acad Sci USA. 1989;86:1929–1933.
- Freitag M, Williams RL, Kothe GO, et al. A cytosine methyltransferase homologue is essential for repeat-induced point mutation in Neurospora crassa. Proc Natl Acad Sci USA. 2002;99:8802–8807.
- Kouzminova E, Selker EU. dim-2 encodes a DNA methyltransferase responsible for all known cytosine methylation in Neurospora. Embo J. 2001;20:4309–4323.
- Tamaru H, Selker EU. Synthesis of signals for de novo DNA methylation in Neurospora crassa. Mol Cell Biol. 2003;23:2379–2394.
- Bewick AJ, Hofmeister BT, Powers RA, et al. Diversity of cytosine methylation across the fungal tree of life. Nat Ecol Evol. 2019;3:479–490.
- Wicker T, Sabot F, Hua-Van A, et al. A unified classification system for eukaryotic transposable elements. Nat Rev Genet. 2007;8:973–982.
- Kidwell MG, Lisch D. Transposable elements as sources of variation in animals and plants. Proc Natl Acad Sci USA. 1997;94:7704.
- Venner S, Feschotte C, Biémont C. Dynamics of transposable elements: towards a community ecology of the genome. Trends Genet. 2009;25:317–323.
- Abrusán G, Krambeck H-J. Competition may determine the diversity of transposable elements. Theor Popul Biol. 2006;70:364–375.
- Selker EU, Tountas NA, Cross SH, et al. The methylated component of the Neurospora crassa genome. Nature. 2003;422:893–897.
- Irelan JT, Selker EU. Cytosine methylation associated with repeat-induced point mutation causes epigenetic gene silencing in Neurospora crassa. Genetics. 1997;146:509–523.
- Miao VPW, Freitag M, Selker EU. Short TpA-rich segments of the ζ-η region induce DNA methylation in Neurospora crassa. J Mol Biol. 2000;300:249–273.
- Lee YCG, Langley CH. Transposable elements in natural populations of Drosophila melanogaster. Philos T R Soc B. 2010;365: 1219–1228.
- Menkis A, Bastiaans E, Jacobson DJ, et al. Phylogenetic and biological species diversity within the Neurospora tetrasperma complex. J Evol Biol. 2009;22:1923–1936.
- Vogel HJ. A convenient growth medium for Neurospora (medium N). Microb Genet Bull. 1956;13:42–43.
- Russo V, Sommer T, Chambers J. A modified Vogel’s medium for crossings, mating-type tests and the isolation of female-sterile mutants of Neurospora crassa. Fungal Genetics Reports. 1985;32: 10.
- Ellison CE, Stajich JE, Jacobson DJ, et al. Massive changes in genome architecture accompany the transition to self-fertility in the filamentous fungus Neurospora tetrasperma. Genetics. 2011;189:55–69.
- Sun Y, Svedberg J, Hiltunen M, et al. Large-scale suppression of recombination predates genomic rearrangements in Neurospora tetrasperma. Nat Commun. 2017;8:1140.
- Svedberg J, Hosseini S, Chen J, et al. Convergent evolution of complex genomic rearrangements in two fungal meiotic drive elements. Nat Commun. 2018;9:4242.
- Kurtz S, Phillippy A, Delcher AL, et al. Versatile and open software for comparing large genomes. Genome Biol. 2004;5:R12.
- Kersey PJ, Allen JE, Allot A, et al. Ensembl Genomes 2018: an integrated omics infrastructure for non-vertebrate species. Nucleic Acids Res. 2018;46:D802–D808.
- Cantarel BL, Korf I, Robb SMC, et al. MAKER: an easy-to-use annotation pipeline designed for emerging model organism genomes. Genome Res. 2008;18:188–196.
- Chen C, Huang H, Wu CH. Protein bioinformatics databases and resources. In: Wu CH, editor. Protein bioinformatics: from protein modifications and networks to proteomics. New York, New York, NY: Springer; 2017. p. 3–39. DOI:10.1007/978-1-4939-6783-4_1
- Smit A, Hubley R, Green P. RepeatMasker open-4.0. 2013-2015.
- Gioti A, Mushegian AA, Strandberg R, et al. Unidirectional evolutionary transitions in fungal mating systems and the role of transposable elements. Mol Biol Evol. 2012;29:3215–3226.
- Krueger F, Andrews SR. Bismark: a flexible aligner and methylation caller for Bisulfite-Seq applications. Bioinformatics. 2011;27:1571–1572.
- Langmead B, Salzberg SL. Fast gapped-read alignment with bowtie 2. Nat Methods. 2012;9:357–U354.
- Li H, Handsaker B, Wysoker A, et al. Project data processing, the sequence alignment/map format and SAMtools. Bioinformatics. 2009;25:2078–2079.
- García-Alcalde F, Okonechnikov K, Carbonell J, et al. Qualimap: evaluating next-generation sequencing alignment data. Bioinformatics. 2012;28:2678–2679.
- Song Q, Decato B, Hong EE, et al. A reference methylome database and analysis pipeline to facilitate integrative and comparative epigenomics. PLOS One. 2013;8:e81148.
- Schultz MD, Schmitz RJ, Ecker JR. ‘Leveling’ the playing field for analyses of single-base resolution DNA methylomes. Trends Genet. 2012;28:583–585.
- Core Team R. R: a language and environment for statistical computing. Vienna, Austria: R Foundation for Statistical Computing; 2013.
- Quinlan AR, Hall IM. BEDTools: a flexible suite of utilities for comparing genomic features. Bioinformatics. 2010;26:841–842.
- Hu Y, Yan C, Hsu C-H, et al. OmicCircos: A simple-to-use R package for the circular visualization of multidimensional omics data. Cancer Inform. 2014;13:CIN.S13495.
- Ramírez F, Dündar F, Diehl S, et al. deepTools: a flexible platform for exploring deep-sequencing data. Nucleic Acids Res. 2014;42:W187–W191.
- Bolger AM, Lohse M, Usadel B. Trimmomatic: a flexible trimmer for illumina sequence data. Bioinformatics. 2014;30:2114–2120.
- Dobin A, Davis CA, Schlesinger F, et al. STAR: ultrafast universal RNA-seq aligner. Bioinformatics. 2013;29:15–21.
- Robinson MD, McCarthy DJ, Smyth GK. edgeR: a bioconductor package for differential expression analysis of digital gene expression data. Bioinformatics. 2010;26:139–140.
- Chen Y, Lun A, Smyth G. From reads to genes to pathways: differential expression analysis of RNA-Seq experiments using Rsubread and the edgeR quasi-likelihood pipeline [version 2; referees: 5 approved]. F1000Res. 2016;5:1438.