
ABSTRACT
The historically recent domestication of fishes has been essential to meet the protein demands of a growing human population. Selection for traits of interest during domestication is a complex process whose epigenetic basis is poorly understood. Cytosine hydroxymethylation is increasingly recognized as an important DNA modification involved in epigenetic regulation. In the present study, we investigated if hydroxymethylation plays a role in fish domestication and demonstrated for the first time at a genome-wide level and single nucleotide resolution that the muscle hydroxymethylome changes after a single generation of Nile tilapia (Oreochromis niloticus, Linnaeus) domestication. The overall decrease in hydroxymethylcytosine levels was accompanied by the downregulation of 2015 genes in fish reared in captivity compared to their wild progenitors. In contrast, several myogenic and metabolic genes that can affect growth potential were upregulated. There were 126 differentially hydroxymethylated cytosines between groups, which were not due to genetic variation; they were associated with genes involved in immune-, growth- and neuronal-related pathways. Taken together, our data unveil a new role for DNA hydroxymethylation in epigenetic regulation of fish domestication with impact in aquaculture and implications in artificial selection, environmental adaptation and genome evolution.
Introduction
For thousands of years, domestication of plants and terrestrial mammals has shaped human evolution. Our civilizations, societies, global demography and diet have been inextricably linked with this process [Citation1]. Historical evidence of fish domestication is recorded much later than that of terrestrial animals. Its first documented instance was when freshwater fishes were attracted to rice paddies and managed alongside them [Citation2]. Domestication is a rather long and complex process, whereby wild animals are not simply kept in captivity, but bred for enhanced traits that are beneficial to humans. Phenotypic, behavioural as well as genetic changes are known to be linked to mutations and shifts in allele frequencies that occur gradually after consecutive generations of selection [Citation3–Citation6]. Nevertheless, phenotypic changes are often detected within a single generation of domestication. For example, selection for growth can result in an average increase in body weight of 13% per generation in aquatic species of commercial value [Citation7]. Selected lines of Atlantic salmon (Salmo salar) demonstrate an increase of 4.6% in feed efficiency ratio per generation compared to their wild counterparts, [Citation8] and weight gain in Nile tilapia can reach up to 14% per generation [Citation9]. Epigenetic mechanisms that promote phenotypic remodelling without involving changes in the nucleotide sequence are expected to be involved in domestication. 5-hydroxymethylcytosine (5hmC) is an epigenetic DNA modification produced through the oxidation of 5-methylcytosine (5mC) by ten-eleven translocation enzymes [Citation10]. Recent evidence pinpoints the importance of 5hmC in epigenetics and its association with active histone marks, histone accessibility and gene regulation [Citation11–Citation13]. Its particular enrichment within gene-bodies; mainly within promoters and intragenic regions, as well as its linkage to gene-rich genomic regions suggest that 5hmC is a transcriptionally relevant epigenetic modification [Citation14,Citation15]. Depending on the location, 5hmC enriched regions can be functionally relevant by maintaining an active or inactive chromatin state [Citation14]. Compared to 5mC marks, hydroxymethylation seems to be involved in highly complex mechanisms by activating secondary molecules such as non-coding RNAs. In particular, increased levels of 5hmC at the promoter of microRNA-365-3p, resulted in the regulation of nociceptive behaviours in mice through a potassium channel (Kcnh2), which also pinpoints the accuracy and effectiveness of such modifications to rapidly transfer and regulate environmental signals through the peripheral and central nervous systems [Citation13]. Furthermore, in a state of hypertrophied cardiac muscle cells in mice, 5hmCs are shifting from gene bodies to intergenic regions. Cytosine hydroxymethylation is a pre-activating mark of chromatin remodelling, a process that is crucial for chromatin accessibility [Citation11]. To date, the role of 5hmC in teleosts and their domestication remains unknown.
Here we reveal that the muscle hydroxymethylome changes when the offspring of wild Nile tilapia are reared in captivity for just one generation of domestication. We observed an overall downregulation of immune genes, possibly linked to pathogen exposure and immune cell infiltration in muscle of wild individuals, concomitantly with an upregulation of metabolic and myogenic genes. By focusing on differentially expressed (DE) genes that were associated with differentially hydroxymethylated cytosines (DhmCs), we demonstrate that 5hmC may play a key role in the regulation of cell cycle, metabolism and muscle growth.
Results
The nuclear but not the mitochondrial muscle hydroxymethylome differs between wild Nile tilapia and their offspring reared in captivity
Due to the nature of the reduced representation hydroxymethylation profiling (RRHP) libraries, samples with higher levels of hydroxymethylation produced higher number of hydroxymethylated fragments. Therefore, all libraries were sequenced with equal volumes for proportional sequencing. On average, 69 and 29 M raw reads were obtained per library from the W and D groups, respectively. Approximately 54% of the reads were uniquely mapped to the reference genome, while 14% were multiple mapped (Fig. S1). In total, we covered 1.2 out of 1.8 million possible CCGG sites from both strands across all chromosomes and scaffolds. After removing 5hmC sites having less than 26 counts across 7 or more samples (see Methods), 298,289 CCGG sites were used for further analyses.
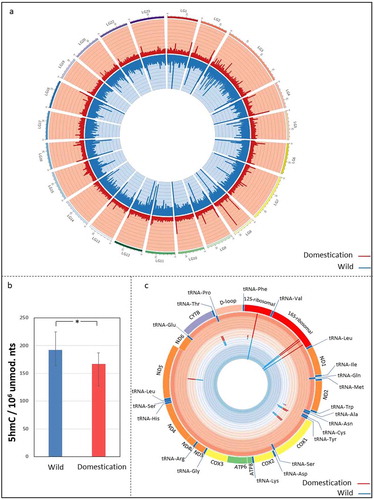
Hydroxymethylation was present throughout the whole genome without forming any particular clusters in specific chromosomes ()). The overall 5hmC pattern across the genome showed increased hydroxymethylation levels in the W group (uniquely mapped CCGG sites; one-tailed Student’s t-test; p < 0.01). Liquid chromatography/mass spectrometry (LC-MS/MS) confirmed that the global 5hmC levels were significantly higher in the W compared to the D group ()).
Figure 1. Hydroxymethylation differences between wild Nile tilapia and their offspring reared in captivity. (a), Circular representation of the Nile tilapia nuclear genome (linkage groups LG1-LG23, no scaffolds included for visualization purposes). Only sites with substantial levels of 5hmC were included (298289 CCGG sites). (b), Histogram with the average number of hydroxymethylated cytosines,5-hm(dC), per 1 million nucleotides, in fast muscle of wild fish compared to their offspring undergoing domestication. Significance was evaluated using the one-tailed Student’s t-test (n = 6, p = 0.04). Standard errors of the means are shown by black bars. (c), Circular representation of the Nile tilapia mitochondrial genome with its gene features in both L and H strands. (a,c), Blue and red peaks (oriented in and out, respectively) represent the hydroxymethylation levels in the groups of wild fish and their offspring undergoing domestication, respectively. The height of each peak is the average count for each group per location (n = 6). The 5hmC counts per genomic location and individual, as well as the standard deviation for the W and D groups in panels 1a and 1 c can be found in Supplementary Table S9.
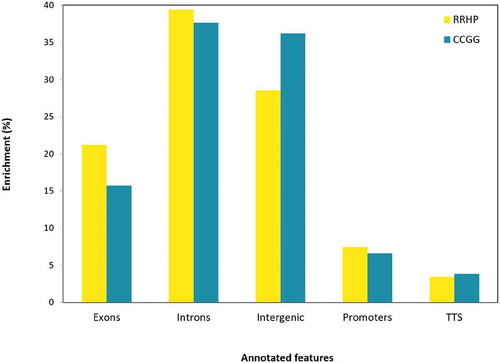
The significant differences in library sizes between the two groups did not reflect similar effects on 5hmC variation, which was higher within the D group (ANOVA; Dvar = 1.54 × 10¹⁴, Wvar = 1.51 × 10¹⁴, F = 9, Fcrit = 5, p = 0.01 with a = 0.05; Table S1), and may be due to relaxed natural selection and phenotypic divergence in captivity conditions [Citation16]. However, the overall variation of individual CCGG sites after filtering was higher in the W group and this variance was mainly associated with large differences between 5hmC sites. The opposite effect was observed in the D group, where the variance was attributed mainly to within-site variation (Table S2). Based on the annotation of all CCGG sites as well as the sites that were hydroxymethylated in our data set, we observed that 5hmCs were relatively depleted within intergenic regions (19%) and enriched in exons (31%) and promoters (33%) ().
Figure 2. Histogram of gene features (Promoters defined from −1kb to +100bp; TTS defined from −100bp to +1kb). Yellow and turquoise represent the enrichment of sites with substantial levels of 5hmC (RRHP – 295720 sites) and total CCGGs (whole genome – 1791,720 sites) across the Nile tilapia genome, respectively.
A total of 13 of the 38 possible mitochondrial CCGG sites were substantially hydroxymethylated ()). Four of these sites were detected within the cox1 (cytochrome c oxidase subunit I) gene, which is involved in a large number of processes including metal ion binding, aerobic respiration, and oxidative phosphorylation. Notably, the highest 5hmC levels per CCGG site were observed within the 12 S and 16 S ribosomal RNA genes.
Differentially hydroxymethylated genes are involved in immunity, as well as in various intra- and extracellular processes
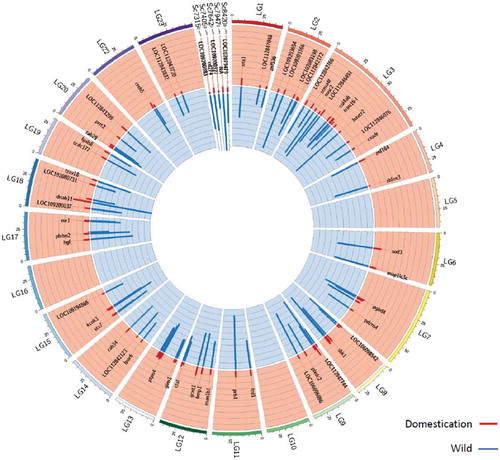
We identified 126 differentially hydroxymethylated cytosines (DhmCs) between the two groups (p adj. val. <0.05; ). All sites were hyper-hydroxymethylated in the wild group compared to the first generation of fish reared in captivity. DhmCs were mostly enriched within linkage group 3 but no DhmCs were found in chromosomes LG5, LG10, LG16 and the mitochondrial genome. Most of these DhmCs were located in gene bodies (79) rather than in intergenic regions (47) (Fig. S2). DhmCs located in intergenic regions were assigned to genes based on their proximal distance to the transcription start site (TSS) of the corresponding gene. In total, 61 and 34 unique genes were linked to intragenic and intergenic DhmC marks, respectively. Proportionally to the genomic and filtered CCGG sites, DhmCs were enriched within transcription termination sites (genomic-TTS; p = 0.055, filtered-TTS; p = 0.041, binomial test). The genes with the highest number of DhmCs were myo5b (myosin Vb) and kmt2e (inactive histone-lysine N-methyltransferase 2E) with 4 DhmCs, as well as the lpar6 (lysophosphatidic acid receptor 6), map1lc3 c (microtubule-associated protein 1 light chain 3 C) and extensin with 3 DhmCs (Table S3). Genes that were differentially hydroxymethylated are involved mainly in immune response (fcgr2b, stx7, cd274, havcr2, ctsl and sh2d1a), intracellular processes (myo5b, rab29, rab34, map1lc3 c, elovl4 and gcnt1), and core extracellular processes (bmp1, col4a6, ctsl, hgf, muc2, plxnc1 and plxdc2) (Table S4). These genes are known to play crucial roles in the modulation of response to growth factors and cell growth inhibition, and they are associated with the canonical pathway of the muscle that is affiliated to structural or functional extracellular matrix proteins (p = 0.007). By using the zebrafish annotated features, we identified genes that are involved in axon (GO:0061564; Log(p) = −2.67), neuron (GO:0048666; Log(p) = −2.37) and neuron projection development (GO:0031175; Log(p) = −2.16) as well as the phagosome pathway (Log(p) = −2.26) (Table S5).
Figure 3. Circular representation of the Nile tilapia nuclear genome (linkage groups LG1-LG23 and scaffolds) showing 126 DhmCs. For visualization purposes the numbers in the scaffold symbols ‘Sc’ represent the last four digits in the accession number starting with ‘NW_02032’ in the NCBI database (e.g. ‘Sc7315’ represents scaffold ‘NW_020327315’). Gene symbols refer to the closest gene to the reported CCGG site. See ,c) for explanations of peaks. The 5hmC counts per genomic location and individual, as well as the standard deviation for the W and D groups in Figure 3 can be found in Supplementary Table S10.
A single generation of domestication is associated with substantial changes in the muscle transcriptome
The average size of the rRNA depleted libraries was 19.2 M raw reads for the W samples and 19.3 M raw reads for the D samples (Fig. S3). Of these, 13.1 M and 12.8 M reads were uniquely mapped to the Nile tilapia for the W and D samples, respectively. Of the mapped reads, 3.6 M and 3.8 M reads were mapped to multiple locations in the genome for the W and D samples, respectively.
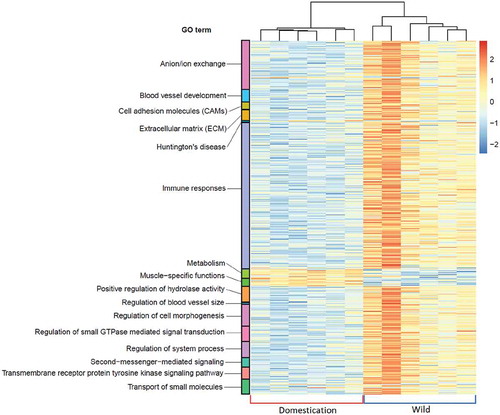
We found 2,121 genes (q < 0.05, |log FC|> 1.5) that were differentially expressed between the W and D generations. A substantial number of genes (2015) were downregulated in the D group, while only 106 genes were upregulated (q < 0.05, |logFC|> 1.5; ). A large proportion of the downregulated genes were enriched for immune functions, such as lymphocyte activation (log(p) = −24.11), cytokine production (log(p) = −21.6), myeloid leukocyte activation (log(p) = −20.49), chemotaxis (log(p) = −20.26) and leukocyte migration (log(p) = −18.86), as well as the cytokine-mediated (log(p) = −15.68) and immune response signalling pathways (log(p) = −16.98) (Fig. S4; Table S6). Upregulated genes were involved in metabolic processes such as monocarboxylic acids (q = 3.43 × 10⁻⁵), fatty acids (q = 15 × 10-2) and glucose catabolic process to pyruvate (q = 3.3 × 10⁻²), as well as the glycine, serine and threonine metabolism KEGG pathway (q = 0.016). Interestingly, significantly enriched genes within biological functions such as striated muscle tissue development (q = 3.4 × 10⁻²) and muscle system process (q = 1.9 × 10⁻³) were also upregulated in the D group, which may indicate a higher growth potential of fish in captivity (Fig. S5, Table S7).
Figure 4. Heatmap showing the differentially expressed genes assigned to their gene ontology (GO) terms between the two clustered groups. Red and blue brackets at the bottom of the heatmap correspond to the ‘Domestication’ and ‘Wild’ groups, respectively. The gradient from blue to red colour represents down- to upregulation, respectively. Each GO term is colour-coded as shown at the left side of this heatmap. All related statistics, including significance of each enriched GO term, are shown in tables S5 and S6.
Hydroxymethylation and gene expression are positively associated
A total of 11 DhmCs were found within 7 DE genes (; q < 0.05, logFC> 1.5). These 7 genes were hyper-hydroxymethylated and upregulated in the wild group, indicating a positive association between hydroxymethylation and gene expression. The gene that displayed the highest fold change in terms of gene expression was sh2d1a (SH2 domain containing protein 1A), which is involved in cellular defence and regulation of immune responses.
Table 1. List of genes that were both differentially hydroxymethylated and differentially expressed between wild Nile tilapia (W) and their offspring undergoing domestication (D). P adj.: FDR adjusted p value (q value), log FC: logarithmic fold-change, where negative values represent upregulation in D and positive values represent upregulation in W .
The remaining DE genes containing DhmCs play roles in cell survival (creb5) and broad neuronal-related effects such as axon guidance and development, neuron projection guidance and development, regulation of axonogenesis and generation of neurons (dok2, plxnc1, dnah11 and myo5b). A gene essential for the structural maintenance of the extracellular matrix and wound healing of the skin in mammals (bmp1) also contained DhmCs and was DE between the two groups. Notably, DhmCs within DE genes were mostly located within introns (8/11), which might affect alternative splicing events or cryptic promoters. Finally, distance-based association between DhmCs and DE genes without the previously mentioned thresholds revealed one additional gene (fzd1; p < 0.05, logFC = 1.3) which is involved in a broad range of processes within the Wnt signalling pathway and was differentially hydroxymethylated at a distance of approximately 23 kbp upstream of its transcription start site.
No evidence of population structure between W and D groups
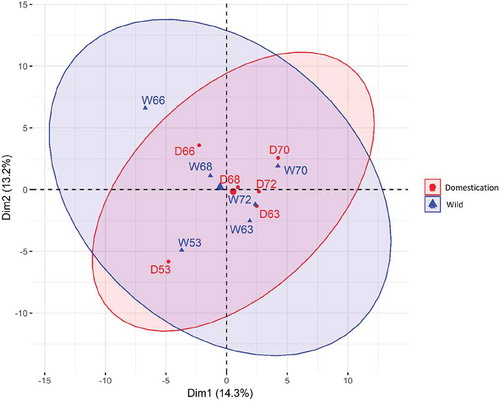
Considering the unknown genetic background of wild Nile tilapia males and their contribution to the D group genotypes, we investigated whether genetic mutations within the restriction sites (CCGG) could potentially explain the observed epigenetic reprogramming during the first generation of domestication. In total, 2,871 single nucleotide polymorphisms (SNPs) were identified among all samples from the same sequencing data that was used to identify 5hmCs. Pairwise SNP distances confirmed that each D-offspring corresponds to each W-parent, considering that the smallest distances were observed between each W-D pair (Fig. S6). The fixation index between the W and D groups was negative (Fst = −0.05), which confirms our hypothesis that there was no genetic structure between the two Nile tilapia populations, as shown in . The within-group nucleotide diversity estimates were similar for both populations.
Figure 5. Principal component analysis (PCA) showing the genetic diversity of the 6 wild and 6 first-generation offspring based on their SNPs. Blue triangles and red circles represent the wild fish (W) and their counterparts in the first generation of domestication (D), respectively.
Discussion
Major leaps in growth rate during the first generation of fish domestication cannot be explained by genetic adaptation alone, such as mutations and selective sweeps that lead to specific shifts in allele frequencies. As shown before, genetic adaptation to captivity is a relatively slow, species-specific process and can only be detected after several generations [Citation3,Citation4,Citation6,Citation17]. Nevertheless, within a single generation, hatchery-reared fish are selected for traits that are advantageous in captivity (e.g., growth rate, egg size, fecundity, physiological processes associated with smoltification and relaxed anti-predator behaviour) but can be maladaptive in the wild, resulting in reduced reproductive fitness [Citation18,Citation19]. Recent evidence has shown that gene expression patterns can be altered within the first generation of captivity rearing and that these changes can be transferred to the next generation [Citation20]. Indeed, wild growth-hormone transgenic coho salmon (Oncorhynchus kisutch) and rainbow trout (Oncorhynchus mykiss), appear to have similar modifications in genetic pathways as their counterparts undergoing domestication [Citation21,Citation22]. However, very limited research has been made to uncover the mechanisms underlying these changes. In the present study, 2,121 DE genes were identified between wild Nile tilapia and their first-generation offspring. A rapid adaptation to captivity conditions was evident at the molecular level, with most genes being downregulated in the group undergoing domestication. In a recent study [Citation20], 723 genes were reported to be DE between wild-born and first generation hatchery-reared offspring Steelhead trout (Oncorhynchus mykiss). Unlike our findings in Nile tilapia, most of these genes were upregulated in hatchery-reared fish and only the muscle-related troponin I gene (tnni1) was found to be upregulated in both steelhead trout and Nile tilapia reared in captivity. This might be an indication of either species- or tissue-specificity (whole fry vs fast muscle) or even differences in environmental factors (e.g., rearing conditions, temperature, dissolved oxygen and pH) that contribute to the expression of these genes.
A total of 316 genes directly associated with the immune response were upregulated in wild Nile tilapia compared to their counterparts undergoing domestication. These results demonstrate the challenging and variable environmental factors affecting wild populations, namely, high water temperatures during the summer months (up to 35°C at river banks and shallows), exposure to viruses, bacteria and parasites, as well as predators and fishing pressure compared to the predator- and pathogen-free conditions of our recirculating aquaculture system. For example, one of the major physiological differences between the W and D group was the obvious presence of endoparasites in the W group (supplementary video 1), which could justify the upregulation of several genes such as interleukins and their receptors (il21 r, il12rb2, il12rb1, il16, il2rb, il7 r, il18rap, il1rap, il17 f, il1r2, il4l1, il1b, il31ra) and other genes previously reported to be upregulated as a response to parasitic load in vertebrates [Citation23] (e.g., irf4, irf1, thbs1b, socs3, junb, prf1, ccr9, itga5 and slc3a2). Based on the tissue enrichment analysis and manual inspection of expression patterns of these genes in humans (p adj. val. ≈ 10−7; Fig. S7), it is plausible that wild fish had a higher degree of immune cell infiltration in muscle tissue than their offspring reared in captivity, even though this could not be confirmed by histological analysis due to the unavailability of necessary chemicals and equipment in the field.
It is noteworthy that T and B cell activation, differentiation, and function is mediated by ten-eleven translocation enzymes and the DNA oxidation and demethylation pathways [Citation24]. We found that tet3 was upregulated in the W group (p < 0.05, logFC = 1.17), which suggests an overall demethylation process within both muscle and immune related cells, with major implications in gene transcription. These findings demonstrate the complexity of epigenetic mechanisms and their roles in gene regulation, cell defence and growth.
The overall muscle composition changes with age and the different cell types present in muscle have distinct DNA methylation patterns [Citation25]. As the exact age of the wild Nile tilapia could not be determined by otolith analysis, one cannot exclude the possibility that the observed upregulation of tet3 in the W group was at least partly due to age differences. Nevertheless, the local fishermen that assisted us in Egypt know that these fish were approximately 4–5 months old due to the fishing pressure imposed by the gill nets and traps used. The changes in gene expression and 5hmC levels identified between wild fish and their progeny undergoing domestication are most likely due to environmental differences, since the latter were also 5 months old at the time of sampling. Stress-related epigenetic changes may also play an important role in immunocompetence and acute stress can increase the transcription of immune-related genes [Citation26]. Even though the authors have taken precautions towards reducing any bias in the experimental design, the collection of fertilized eggs from the mouth of the W females without anaesthesia represented an additional acute stress that could potentially have influenced the epigenome.
Crowded conditions can potentially result in skin abrasions and hypoxia [Citation27] and rearing density plays an important role towards the adaptation to captivity [Citation20]. The rearing density in our recirculating aquaculture system was higher than in the wild but we found few DE genes related to crowding conditions. Specifically, we identified only two genes, grn (granulin) and phb2 (prohibitin-2) that were upregulated in fish reared in captivity and that were related to wound healing and response to hypoxia, respectively.
Studies on commercial fish [Citation28–Citation31] and model organisms [Citation32], have shown that captivity rearing usually offers the appropriate conditions for increased growth rates. Phenotypic selection has led to the development of the genetically improved farmed tilapia strain, which gradually gained up to 15% in body mass per generation within the first six generations of domestication [Citation33]. Considering the impact of environmental factors on the epigenome and the overall health status during the transition from the wild to an enclosed rearing environment, it is plausible that the first signs of growth-gain are strongly associated with a lower pathogen load in captivity. This notion is further supported by the fact that the immune system is closely associated with the muscle development, since chronic inflammation can lead to muscle damage and fibrosis [Citation34]. It is likely that other mechanisms directly affect muscle growth during the first generation of domestication. We found two genes (myo5b and creb5) that are both DE and contain DhmCs between wild and first-generation captive fish. These genes are involved in the PI3K-Akt signalling pathway, which is one of the most important intracellular pathways in muscle that regulate cell cycle, metabolism, proliferation and growth. Myosin Vb targets and activates directly the phosphatase and tensin homolog (PTEN) [Citation35], which in turn dephosphorylates PIP3 (phosphatidylinositol 3,4,5 – trisphosphate) and prevents cells from growing. Both myo5b (LogFC = 1.991; q = 0.009) and pten (LogFC = 1.303; q = 0.043) were upregulated in wild individuals, suggesting a possible epigenetic mechanism that regulates muscle hypertrophy. Additionally, myo5b is directly involved in insulin-dependent glucose transporter 4 (GLUT4) translocation in muscle cells and uses rab8a and rab13 GTPase-activating proteins that require Akt signalling and activation [Citation36,Citation37]. Apart from its involvement within the PI3K-Akt signalling pathway, myo5b plays various roles in neuronal processes. It recycles the endosome delivery into hippocampal neuron spines in dendrites, targets and activates PTEN, which in turn regulates the soma size, and promotes axonal development in conjunction with the Ras-related protein rab10 [Citation38]. It would not be surprising if the epigenetic regulation of neuronal development was associated with muscle development, considering that neurons are an integral part of the skeletal muscle. Creb5 codes for a protein that is a substrate for the Akt/PKB and is involved in cell survival. Among other pathways, creb5 is also involved in insulin resistance and gluconeogenesis in the muscle, which occurs during periods of starvation and low-carbohydrate diets [Citation39]. Myo5b and creb5 seem to be good candidates for further investigation into their epigenetic regulation during domestication. Overall, genes that were upregulated in the D group were mostly related to metabolic processes (43/106). We also identified genes involved in myosin binding and actomyosin structure organization (actc1), regulation of skeletal muscle contraction (casq2, eno1, mb) and skeletal muscle development (srpk3), response to and regulation of glucose import (rtn2, mef2a) as well as calcium release channels and insulin secretion (fkbp1b). Interestingly, srpk3 (serine/arginine-rich specific kinase 3), is a well conserved gene among mammalian species and it is closely related with myocyte-specific enhancers that promote muscle growth in the skeletal muscle tissue [Citation40]. These results coupled with the dietary effects in captivity, such as high-quality diet and regular feeding ad libitum, suggest an increase in metabolic capacity that leads to a higher growth rate from the very first generation of fish undergoing domestication. It is plausible that this effect is partly due to nutritional programming. Previous studies in zebrafish (Danio rerio) have shown that parental nutritional programming through increased dietary intake of arachidonic acid or deficiency in 1-C nutrients results in DNA methylation changes and epigenetic regulation of gene expression in the liver of the offspring [Citation41,Citation42].
The total number of 5hmCs in our reduced representation of the Nile tilapia genome was substantially high, covering ubiquitously the nuclear genome as well as identifying 5hmCs within the mitochondrial genome. High levels of 5hmC within the 12 S and 16 S ribosomal RNA might indicate that epigenetics could have an effect in the translational dynamics of mitochondrial mRNAs. Although studies have shown 5hmCs to be present in mammalian mitochondria [Citation43,Citation44], there are no reports of 5hmCs at single nucleotide resolution in the mitochondria of teleosts. Here we provide the first evidence of 5hmC marks across the mitochondrial genome of Nile tilapia, which also implies the existence or relocation of CpG demethylation mechanisms within the mitochondria. Strikingly, the large differences of the nuclear 5hmC levels between wild and first-generation fish, do not reflect the average 5hmC levels within the mitochondria. This suggests that the two demethylation mechanisms are effectively separated. Similarly to our study, 5hmCs in the muscle of zebrafish occur mainly in bodies of genes, some of which have functions with interesting implications in metabolism, development and other muscle-specific functions [Citation45].
We observed higher hydroxymethylation levels in the W group, which resulted to the identification of 126 DhmCs. A previous study that compared the DNA methylation profiles of hatchery-reared and wild coho salmon (O. kisutch), identified 37 differentially methylated regions (DMRs) that are likely linked with the reduction in fitness of the hatchery-reared fish [Citation46]. These DMRs were found within 52 unique transcripts, but none of them appeared in our DhmC data. Possible explanations for these differences are species-specificity (smoltification related processes that are not present in Nile tilapia), ontogeny stage (fry vs adults), and 5mC/5hmC-specificity (different epigenetic modifications may control different pathways). There were two genes in common between our DE genes and these 52 transcripts, namely ankyrin-1 (ank1), which is involved in cytoskeleton organization, and phb2, which is involved in a large number of processes, such as cellular response to hypoxia and response to wounding. Ank1 was upregulated in W fish, whereas phb2 was upregulated in the D group, which indicates a common regulation of these genes among fish species during the early stages of domestication. This finding possibly indicates that similar stressors might affect the wild populations of fish with major impact on their fitness and growth potential. However, our data indicate that most molecular networks regulated during the early stages of domestication appear to be species-specific.
According to a recent study, DNA methylation of the first intron has a negative effect on gene expression levels across several species and tissues [Citation47]. In our case, the first intron of myo5b is highly hydroxymethylated in the W group (4 DhmCs, logFC = 5.69, q val = 0.0085) compared to the D group. In addition, we observe a positive correlation with its transcript levels (logFC = 1.99, q.val = 0.009). Additionally, a single DhmC was found within the first intron of bmp1 (logFC = 6.48, q val = 0.008) and it was also upregulated in the W group (logFC = 1.6, q val = 0.048). These results indicate the importance of distinguishing 5mC from 5hmC calls. Unlike our RRHP approach, other commonly used methods such as reduced representation bisulphite sequencing (RRBS) are unable to do so, which limits the conclusions from those studies.
While genetic variation alone did not explain the large differences in 5hmC patterns between the W and D groups, it is worth mentioning that the SNP coverage was limited due to the nature of the RRHP libraries. A broader genome-wide approach could potentially identify additional SNPs between the two groups. Furthermore, hydroxymethylation levels at the beginning of the embryonic development in fish are very low [Citation45,Citation48], therefore epigenetic reprogramming is likely occurring as a result of environmental conditions rather than of maternal effects.
Conclusion
The process of domestication affects animals in ways that still remain unknown. Both genetic and epigenetic changes can alter the phenotype within a single generation. Here, we demonstrated for the first time that DNA hydroxymethylation in muscle differs significantly between wild fish and their progeny reared in captivity. We further identified DhmCs mostly within gene bodies, which might indicate their functional role in epigenetic regulation. These DhmCs were associated mainly with immune-, neuronal- and growth-related processes. Concurrently, thousands of genes were differentially expressed between groups, with upregulation of immune related genes in the wild and the upregulation of metabolic and muscle-specific genes in the first generation of fish undergoing domestication. Notably, genes that were found to be both differentially hydroxymethylated and differentially expressed had a consistently positive correlation. Another remarkable finding was the hyper-hydroxymethylation of the first intron of myo5b and its connection with the upregulated pten gene in the wild group. Pten is involved in the PI3K-Akt signalling pathway and muscle atrophy. Further investigation into the PI3K-Akt pathway could reveal one plausible way for rapid regulation of growth and muscle hypertrophy in fish during the first stages of their domestication. Lastly, we found no evidence for genetic differentiation between the two groups, showing that the observed hydroxymethylation changes within the first generation in captivity have an epigenetic rather than genetic basis. Understanding the epigenetic mechanisms, namely hydroxymethylation, involved in early domestication is essential for aquaculture diversification (farming of new species), sustainable production, and wild fish stock management practices.
Materials and methods
Ethics approval
This study was approved by the Nord University (Bodø, Norway) ethics board and all procedures involving animals were performed according to the instructions of the Norwegian Animal Research Authority (FOTS ID 1042).
Experimental design
A total of 6 wild (W) mouthbrooding Nile tilapia females were captured using traps and gill nets along the river Nile in Luxor, Egypt within a 500 m radius from the following coordinates (latitude: 25.6655° N; longitude: 32.6186° E). After collecting approximately 180 fertilized eggs from each female by gently holding their head in containers filled with river water, the fish were placed in 25 L tanks, transferred from the boats to the sampling location and sacrificed by immersion in a clove oil (Sigma Aldrich, USA) emulsion containing 12 ml of a clove oil pre-mix in 96% ethanol (1:10 v/v) in 10 L of water [Citation49].
A 0.5 cm thick cross-section was taken at 0.7 standard length, just anterior to the urogenital opening. Fast (white) skeletal muscle was carefully dissected from the left dorsal quadrant of the section and preserved in DNA/RNA Shield (Zymo Research, USA) at 4°C. Sixteen days post-sampling, all tissues were stored at −20°C. Each batch of eggs was disinfected with hydrogen peroxide (1 g H2O2/L for 10 minutes) and placed in egg rockers (Cobalt Aquatics, USA) installed in a 60 L tank with UV-treated water, containing 5‰ NaCl (w/v). Approximately, 85% of the eggs hatched within 4 days at 28°C. At 9 days post-fertilization, the larvae were placed in fish transport bags filled with UV-treated and 100% oxygen saturated water, and were air freighted to Nord University’s research station (Bodø, Norway). Transportation of the larvae lasted approximately 18 hours and their survival rate exceeded 95%. They were reared for 5 months at a maximum density of 27 fish/m3 in a freshwater recirculating aquaculture system (pH = 7.6, DO = 100%, temperature = 28°C and photoperiod LD 13:11) and were fed ad libitum with 0.15–0.8 mm Amber Neptun pellets (Skretting, Norway). The fish reared in captivity represent the first generation of fish (D) undergoing domestication. Each D group was kept separate in different tanks based on their ancestry. Fast muscle from 6 D females was sampled and stored using the same procedure as above. W and D samples were genetically paired (i.e., each D individual corresponded to a W progenitor) and at approximately the same age and ontogeny stage (i.e., puberty). All sampling conditions at the research facilities were simulated to match the sampling of the wild fish in Egypt. To compensate for the starvation period of wild mouthbrooding females, D individuals were starved for 48 hours prior to sampling. All fish were sampled at approximately the same time of the day (7–10 am). Both W and D fish were removed from their environment (Nile river for W and rearing 1500 L tanks for D) and kept for a maximum period of 30 minutes in a 25 L tank with anaesthetic before sampling. All sampling procedures were performed in an air-conditioned room at 25°C and oxygen was provided by an air pump. Additional information on the animals, such as total and standard lengths, weight and general observations at the time of sampling can be found in supplementary material (Table S8). Aliquots of the same fast muscle sample from each individual were used for DNA and RNA isolation.
Global 5hmC quantification by LC-MS/MS
Genomic DNA from fast muscle was isolated from all 12 individuals (6 D and 6 W) using the Quick-DNA miniprep Plus kit (Zymo Research). The concentration of DNA was determined using the Invitrogen Qubit 3.0 fluorometer (ThermoFisher Scientific, USA). Quality and integrity of the DNA was assessed using the NanoDrop 1000 Spectrophotometer (ThermoFisher Scientific) and the Tapestation 2200 (Agilent Technologies, USA), with absorbance ratios 260/280 > 1.93, 260/230 > 1.89 and minimum DNA integrity number (DIN) of 8.4, respectively. For the global quantification of 5hmC, the internal standard d3-5-hydroxymethyl-2ʹ-deoxycytidine (Toronto Research Chemicals, Canada) was added to the DNA samples. Subsequently, they were hydrolysed completely to deoxynucleosides by 20 U benzonase (Santa Cruz Biotech, USA), 0.2 U nuclease P1, and 0.1 U alkaline phosphatase (Sigma Aldrich) in 10 mM ammonium acetate pH 6.0 and 1 mM magnesium chloride at 40°C for 1 hour. Three volumes of acetonitrile were added to the mix before their centrifugation (16,000 g, 30 min, 4°C). The supernatants were dried and dissolved in 50 µl water for LC-MS/MS analysis of modified and unmodified deoxyribonucleosides. Chromatographic separation was performed using an Agilent 1290 Infinity II UHPLC system with an ZORBAX RRHD Eclipse Plus C18 150 × 2.1 mm ID (1.8 μm) column protected with an ZORBAX RRHD Eclipse Plus C18 5 × 2.1 mm ID (1.8 µm) guard column (Agilent Technologies). The mobile phase consisted of water and methanol (0.1% formic acid was added to both phases). For the initial run of 5-hm(dC), the flow rate was set at 0.15 ml/min with 5% methanol for 30 seconds, which was adjusted to a gradient of 5-15% methanol for the next 4 minutes. The flow rate was increased to 0.25 ml/min in a methanol gradient of 15-90% for 3 minutes, and finally re-equilibration was performed at 5% methanol for 4 minutes. A portion of each sample was diluted for the analysis of unmodified deoxynucleosides. Unmodified deoxynucleosides were chromatographed isocratically with 20% methanol. Mass spectrometric detection was performed using an Agilent 6495 Triple Quadrupole system operating in positive electrospray ionization mode, monitoring the mass transitions 261.1/145.1 (d3-5-hm(dC)), 258.1/142.1 (5-hm(dC)), 252.1/136.1 (dA), 228.1/112.1 (dC), 268.1/152.1 (dG), and 243.1/127.1 (dT).
RRHP library preparation and sequencing
The preparation of the reduced representation hydroxymethylation profiling (RRHP) libraries was carried out according to the manufacturer’s protocol (Zymo Research). Fast muscle stored in DNA/RNA Shield (Zymo Research) was homogenized using ZR bashing beads in lysis tubes (Zymo Research) on a Precellys 24 homogenizer (Bertin Instruments, France) at 5000 rpm for 2 cycles of 20 seconds. DNA was extracted using the Quick-DNA miniprep kit (Zymo Research) with a 25 µg binding capacity. After digestion with the restriction enzyme MspI at 37°C for 8 hours, the DNA was washed using the Zymo-Spin IC columns provided in the RRHP 5-hmC library prep kit. Specific adapters that re-create the MspI cutting site were introduced. After library extension, all fragments were glucosylated at 37°C for 2 hours and washed as recommended. During this step, all 5hmCs at the starting CCGG junction of each fragment were glucosylated and protected from the second MspI digestion. At the end of this procedure, only fragments with hydroxymethylated CCGG junctions remain adapterized. Double indices were introduced after size selection according to Illumina’s instructions [Citation50] for a 6-plex sequencing design. To minimize bias during library preparation, all samples were handled simultaneously, as suggested in the literature [Citation51,Citation52]. In total, 6 D, 6 W and 2 positive control libraries were sequenced. The positive controls were 5hmC independent-libraries and contained all possible CCGG sites across the genome. Thus, we were able to identify biases in fragment amplification within our count-based matrices. All samples were sequenced at the Norwegian Sequencing Centre with equal volumes in three lanes on a HiSeq4000 (Illumina, USA) to obtain 150 bp paired-end reads. The positive controls were sequenced at 1/3 volume in all three lanes to account for possible lane effects. Due to the low complexity of the libraries (CCGG) at the beginning of each read, 30% PhiX control v3 (Illumina) was added to each lane.
Bioinformatic analyses
Adapters and N bases from the 3ʹ end of each read were trimmed using trim_galore v0.4.4 (Babraham Bioinformatics) [Citation53]. Clean reads were aligned to the reference genome O_niloticus_UMD_NMBU [Citation54] with Bowtie v0.12.8 [Citation55] using the parameters -best, -v 1, -n 1 and -m 3. These options compromised alignment rates for robustness and reliability, as they minimized multiple aligned reads. From each SAM alignment file, only reads starting with CCGG from both strands were extracted and their coordinates (chromosome and position) were used as input into R [Citation56]. A count matrix was created for each sample and afterwards all samples were concatenated into one count matrix. With the aim of avoiding false discovery of 5hmCs, mainly due to within-group variation, we applied double filtering and stringent parameters. At first, a filter was applied in order to remove 5hmCs with low number of counts. All 5hmCs were removed from the matrix when 7 out of 12 samples had below 1 count. This filter not only excluded hydroxymethylated cytosines with low counts but it increased the overall median value and ensured that 5hmC on/off switches remained in the data set. After calculating the median, we also removed 5hmC sites when 7 or more samples had counts lower than the median value of the matrix. In order to perform a comparison of the two groups, our design handled the six different families as blocks while the W and D samples were considered as two separate groups. We then used the R package limma to perform a duplicate correlation based on their counts and the RRHP bioinformatics was performed similarly to gene expression (RNA-seq) rather than methylation (RRBS) data analysis. The Benjamini-Hochberg procedure was used to calculate adjusted p-values for each 5hmC and single cytosines with an adjusted p value ≤ 0.05 were counted as DhmCs between the W and D groups. The annotation of all significant positions was performed using the software HOMER, annotatePeaks.pl [Citation57] and the NCBI Oreochromis niloticus annotation release 104. The association of differentially hydroxymethylated genes with their corresponding gene ontology terms was performed with Metascape [Citation58]. Two separate gene ontology analyses for Nile tilapia genes were performed based on known functions for their annotated (i) human (Homo sapiens) and (ii) zebrafish (Danio rerio) orthologs.
RNA library preparation, sequencing and analysis
Fast muscle in DNA/RNA Shield was homogenized as described above. Total RNA from the same 12 individuals was isolated using the Quick-RNA miniprep plus kit (Zymo Research) according to the manufacturer’s protocol and recommendations for samples stored in DNA/RNA Shield. Ribosomal RNA was removed using the Ribo-Zero Gold rRNA Removal kit (Illumina). RNA concentration and integrity were assessed using the RNA High-sensitivity tape on the Tapestation 2200 (Agilent Technologies). RNA-seq libraries were prepared using the NEBNext Ultra II Directional RNA Library Prep Kit for Illumina (NEB, USA), according to the manufacturer’s instructions. A unique barcode was assigned to each sample and all libraries were pooled at equimolar concentrations. They were then sequenced at the Norwegian Sequencing Centre on a single HiSeq 4000 lane (Illumina), yielding 480 million 150bp paired-end reads. The raw sequencing files were trimmed using trimmomatic v0.33 [Citation59] with the following parameters: PE -phred33, LEADING:3 TRAILING:3 SLIDINGWINDOW:4:15 MINLEN:36. The trimmed reads were aligned to the Nile tilapia genome (NCBI assembly GCA_001858045.3) using STAR [Citation60] with default settings and paired-end mode. The mapped reads were used as input to htseq-count [Citation61] to calculate count numbers for each gene using the gff3 genome annotation from the above mentioned genome assembly. Differentially expressed genes were determined using the edgeR package in R. The differentially expression analysis required that each gene should be expressed with at least 1 count per million in more than 25% of the samples. The p-values for the differentially expressed genes were adjusted for multiple testing using the Benjamini-Hochberg correction [Citation62].
Based on the gene ontology and annotated human orthologs, a high number of immune-related genes in the muscle of wild fish was observed. To better understand the role of these genes in the muscle we manually inspected tissue-specific patterns in human tissues. The analysis was performed using the GeneAtlas U133A gcrma dataset [Citation63] and a plot for tissue-specific gene expression was created using the TissueEnrich tool [Citation64].
Genetic diversity using SNPs from the RRHP sequencing
The RRHP method allows extraction of SNP information across the genome using the same sequencing data [Citation52]. After quality control and adapter trimming, the resulting fastq files were sorted in directories as recommended by the CFSAN SNP Pipeline [Citation65]. The output SNP distance matrix was used to plot distance-based radars among samples. The resulting vcf files were then used as input for the R package PopGenome with default parameters to calculate the fixation index (Fst) as well as the nucleotide diversity within and between the two groups. A principal component analysis (PCA) was performed using the R package adagenet and plotted using the R package factoextra.
Authors’ contributions
IK carried out the sampling, wet lab and bioinformatic analysis, interpreted the results and wrote the article. PS contributed significantly to the bioinformatic analysis of the RRHP data set, the interpretation of the results and revised the article. RM contributed significantly to the bioinformatic analysis of the RNA-Seq data set and revised the article. AVN contributed significantly in the wet lab and revised the article. DR contributed significantly to the bioinformatic analysis of the SNP data set. JMOF conceived the study, carried out the sampling, provided reagents and consumables, and contributed significantly to the interpretation of the results and the article revision.
Code availability
The scripts used for transcriptomic and hydroxymethylation analyses are available from the corresponding author upon request.
Supplemental Material
Download Zip (44.2 MB)Acknowledgments
The LC-MS/MS analysis was performed by the Proteomics and Modomics Experimental Core facility (PROMEC), Norwegian University of Science and Technology (NTNU). PROMEC is funded by the Faculty of Medicine and Health Sciences at NTNU and the Central Norway Regional Health Authority.
We are thankful to Hilde Ribe, Øivind Torslett, Steinar Johnsen and Kaspar Klaudiussen for their assistance and unparalleled commitment to the husbandry and welfare of the fish.
Disclosure statement
The authors declare that they have no competing interests.
Data availability statement
The RRHP dataset generated and analysed during the current study is available in the SRA (NCBI) repository, under the accession number PRJNA559277. The RNA-seq dataset generated and analysed during the current study is available in the GEO (NCBI) repository, under the accession number GSE135811.
Supplemental material
Supplemental data for this article can be accessed here.
Additional information
Funding
Related Research Data
References
- Diamond J. Evolution, consequences and future of plant and animal domestication. Nature. 2002;418:700–707.
- Larson G, Fuller DQ. The evolution of animal domestication. Annu Rev Ecol Evol Syst. 2014;45:115–136.
- Makinen H, Vasemagi A, McGinnity P, et al. Population genomic analyses of early-phase Atlantic Salmon (Salmo salar) domestication/captive breeding. Evol Appl. 2015;8:93–107.
- Lopez ME, Neira R, Yanez JM. Applications in the search for genomic selection signatures in fish. Front Genet. 2014;5:458.
- Roberge C, Einum S, Guderley H, et al. Rapid parallel evolutionary changes of gene transcription profiles in farmed Atlantic salmon. Mol Ecol. 2006;15:9–20.
- Sauvage C, Derome N, Normandeau E, et al. Fast transcriptional responses to domestication in the brook charr Salvelinus fontinalis. Genetics. 2010;185:105–112.
- Gjerdem T, Robinson N. Advances by selective breeding for aquatic species: A review. Agri Sci. 2014;5:1152–1158.
- Thodesen J, Grisdale-Helland B, Helland SJ, et al. Feed intake, growth and feed utilization of offspring from wild and selected Atlantic salmon (Salmo salar). Aquaculture. 1999;180:237–246.
- Bentsen HB, Gjerde B, Eknath AE, et al. Genetic improvement of farmed tilapias: response to five generations of selection for increased body weight at harvest in Oreochromis niloticus and the further impact of the project. Aquaculture. 2017;468:206–217.
- Tahiliani M, Koh KP, Shen Y, et al. Conversion of 5-methylcytosine to 5-hydroxymethylcytosine in mammalian DNA by MLL partner TET1. Science. 2009;324:930–935.
- Greco CM, Kunderfranco P, Rubino M, et al. DNA hydroxymethylation controls cardiomyocyte gene expression in development and hypertrophy. Nat Commun. 2016;7:12418.
- Sun F, Abreu-Rodriguez I, Ye S, et al. TET1 is an important transcriptional activator of TNFalpha expression in macrophages. PLoS One. 2019;14:e0218551.
- Pan Z, Zhang M, Ma T, et al. Hydroxymethylation of microRNA-365-3p regulates nociceptive behaviors via Kcnh2. J Neurosci. 2016;36:2769–2781.
- Wu H, D’Alessio AC, Ito S, et al. Genome-wide analysis of 5-hydroxymethylcytosine distribution reveals its dual function in transcriptional regulation in mouse embryonic stem cells. Genes Dev. 2011;25:679–684.
- Song CX, Szulwach KE, Fu Y, et al. Selective chemical labeling reveals the genome-wide distribution of 5-hydroxymethylcytosine. Nat Biotechnol. 2011;29:68–72.
- Runemark A, Brydegaard M, Svensson EI. Does relaxed predation drive phenotypic divergence among insular populations? J Evol Biol. 2014;27:1676–1690. DOI:10.1111/jeb.12421
- Vasemägi A, Nilsson J, McGinnity P, et al. Screen for footprints of selection during domesticatin/captive breeding of Atlantic salmon. Comp Funct Genom. 2012;2012:628204.
- Christie MR, Marine ML, French RA, et al. Genetic adaptation to captivity can occur in a single generation. Proc Natl Acad Sci U S A. 2012;109:238–242.
- Araki H, Cooper B, Blouin MS. Genetic effects of captive breeding cause a rapid, cumulative fitness decline in the wild. Science. 2007;318:100–103.
- Christie MR, Marine ML, Fox SE, et al. A single generation of domestication heritably alters the expression of hundreds of genes. Nat Commun. 2016;7:10676.
- Devlin RH, Sakhrani D, White S, et al. Effects of domestication and growth hormone transgenesis on mRNA profiles in rainbow trout (Oncorhynchus mykiss). J Anim Sci. 2013;91:5247–5258.
- Devlin RH, Sakhrani D, Tymchuk WE, et al. Domestication and growth hormone transgenesis cause similar changes in gene expression in coho salmon (Oncorhynchus kisutch). Proc Natl Acad Sci U S A. 2009;106:3047–3052.
- Haase D, Rieger JK, Witten A, et al. Specific gene expression responses to parasite genotypes reveal redundancy of innate immunity in vertebrates. PLoS One. 2014;9:e108001.
- Lio CJ, Rao A. TET Enzymes and 5hmC in adaptive and innate immune systems. Front Immunol. 2019;10:210.
- Tsumagari K, Baribault C, Terragni J, et al. Early de novo DNA methylation and prolonged demethylation in the muscle lineage. Epigenetics. 2013;8:317–332.
- Uren Webster TM, Rodriguez-Barreto D, Martin SAM, et al. Contrasting effects of acute and chronic stress on the transcriptome, epigenome, and immune response of Atlantic salmon. Epigenetics. 2018;13:1191–1207.
- Sveen LR, Timmerhaus G, Krasnov A, et al. High fish density delays wound healing in Atlantic salmon (Salmo salar). Sci Rep. 2018;8:16907.
- Tymchuk WE, Beckman B, Devlin RH. Altered expression of growth hormone/insulin-like growth factor I axis hormones in domesticated fish. Endocrinology. 2009;150:1809–1816.
- Hassin S, Monbrison D, Hanin Y, et al. Domestication of the white grouper, Epinephelus aeneus 1. Growth and reproduction. Aquaculture. 1997;156:305–316.
- Johnsson JI, Petersson E, Jönsson E, et al. Domestication and growth hormone alter antipredator behaviour and growth patterns in juvenile brown trout, Salmo trutta. Can J Fish Aquat Sci. 1996;53:1546–1554.
- Fleming IA, Agustsson T, Finstad B, et al. Effects of domestication on growth physiology and endocrinology of Atlantic salmon (Salmo salar). Can J Fish Aquat Sci. 2002;59:1323–1330.
- Robison D, Rowland W. A potential model system for studying the genetics of domestication: behavioral variation among wild and domesticated strains of zebra danio (Danio rerio). Can J Fish Aquat Sci. 2005;62:2046–2054.
- Ponzoni RW, Nguyen NH, Khaw HL, et al. Genetic improvement of Nile tilapia (Oreochromis niloticus) with special reference to the work conducted by the WorldFish Center with the GIFT strain. Rev Aquacult. 2011;3:27–41.
- Tidball JG. Regulation of muscle growth and regeneration by the immune system. Nat Rev Immunol. 2017;17:165–178.
- Nascimento AF, Trindade DM, Tonoli CC, et al. Structural insights into functional overlapping and differentiation among myosin V motors. J Biol Chem. 2013;288:34131–34145.
- Sun Y, Bilan PJ, Liu Z, et al. Rab8A and Rab13 are activated by insulin and regulate GLUT4 translocation in muscle cells. Proc Natl Acad Sci U S A. 2010;107:19909–19914.
- Ishikura S, Klip A. Muscle cells engage Rab8A and myosin Vb in insulin-dependent GLUT4 translocation. Am J Physiol Cell Physiol. 2008;295:C1016–25.
- Hammer JA 3rd, Wagner W. Functions of class V myosins in neurons. J Biol Chem. 2013;288:28428–28434.
- Altarejos JY, Montminy M. CREB and the CRTC co-activators: sensors for hormonal and metabolic signals. Nat Rev Mol Cell Biol. 2011;12:141–151.
- Xu Y, Yu W, Xiong Y, et al. Molecular characterization and expression patterns of serine/arginine-rich specific kinase 3 (SPRK3) in porcine skeletal muscle. Mol Biol Rep. 2011;38:2903–2909.
- Adam AC, Lie KK, Whatmore P, et al. Profiling DNA methylation patterns of zebrafish liver associated with parental high dietary arachidonic acid. PLoS One. 2019;14:e0220934.
- Skjaerven KH, Jakt LM, Fernandes JMO, et al. Parental micronutrient deficiency distorts liver DNA methylation and expression of lipid genes associated with a fatty-liver-like phenotype in offspring. Sci Rep. 2018;8:3055.
- Shock LS, Thakkar PV, Peterson EJ, et al. DNA methyltransferase 1, cytosine methylation, and cytosine hydroxymethylation in mammalian mitochondria. Proc Natl Acad Sci U S A. 2011;108:3630–3635.
- Bellizzi D, D’Aquila P, Scafone T, et al. The control region of mitochondrial DNA shows an unusual CpG and non-CpG methylation pattern. DNA Res. 2013;20:537–547.
- Potok ME, Nix DA, Parnell TJ, et al. Reprogramming the maternal zebrafish genome after fertilization to match the paternal methylation pattern. Cell. 2013;153:759–772.
- Le Luyer J, Laporte M, Beacham TD, et al. Parallel epigenetic modifications induced by hatchery rearing in a Pacific salmon. Proc Natl Acad Sci U S A. 2017;114:12964–12969.
- Anastasiadi D, Esteve-Codina A, Piferrer F. Consistent inverse correlation between DNA methylation of the first intron and gene expression across tissues and species. Epigenetics Chromatin. 2018;11:37.
- Jiang L, Zhang J, Wang JJ, et al. Sperm, but not oocyte, DNA methylome is inherited by zebrafish early embryos. Cell. 2013;153:773–784.
- Simões LN, Lombardi DC, Gomide ATM, et al. Efficacy of clove oil as anesthetic in handling and transportation of Nile tilapia, Oreochromis niloticus (Actinopterygii: cichlidae) juveniles. Zoologia. 2011;28:285–290.
- Illumina. Effects of index misassignment on multiplexing and downstream analysis. 2017.
- Sun X, Chung TH, Tan D, et al. Practical guidelines and consideration of using RRHP for 5hmC detectionPractical guidelines and consideration of using RRHP for 5hmC detection. Epigenomics. 2016;8:225–235.
- Petterson A, Chung TH, Tan D, et al. RRHP: a tag-based approach for 5-hydroxymethylcytosine mapping at single-site resolution. Genome Biol. 2014;15:456.
- Martin M. Cutadapt removes adapter sequences from high-throughput sequencing reads. EMBnetjournal. 2011;17:10–12.
- Conte MA, Gammerdinger WJ, Bartie KL, et al. A high quality assembly of the Nile Tilapia (Oreochromis niloticus) genome reveals the structure of two sex determination regions. BMC Genomics. 2017;18:341.
- Langmead B. Aligning short sequencing reads with Bowtie. Curr Protoc Bioinformatics. 2010;32:11.7.1–11.7.14.
- Team RC. R Core Team. R: A Language and Environment for Statistical Computing. R Foundation for Statistical Computing. Vienna, Austria; 2017.
- Heinz S, Benner C, Spann N, et al. Simple combinations of lineage-determining transcription factors prime cis-regulatory elements required for macrophage and B cell identities. Mol Cell. 2010;38:576–589.
- Zhou Y, Zhou B, Pache L, et al. Metascape provides a biologist-oriented resource for the analysis of systems-level datasets. Nat Commun. 2019;10:1523.
- Bolger AM, Lohse M, Usadel B. Trimmomatic: a flexible trimmer for Illumina sequence data. Bioinformatics. 2014;30:2114–2120.
- Dobin A, Davis CA, Schlesinger F, et al. STAR: ultrafast universal RNA-seq aligner. Bioinformatics. 2013;29:15–21.
- Anders S, Pyl PT, Huber W. HTSeq–a Python framework to work with high-throughput sequencing data. Bioinformatics. 2015;31:166–169.
- Benjamini Y, Hochberg Y. Controlling the false discovery rate: A practical and powerful approach to multiple testing. J R Stat Soc Series B. 1995;57:289–300.
- Su A Dataset: GeneAtlas U133A, gcrma. 2019.
- Jain A, Tuteja G. TissueEnrich: tissue-specific gene enrichment analysis. Bioinformatics. 2019;1966–1967. DOI:10.1093/bioinformatics/bty890
- Davis S, Pettengill JB, Luo Y, et al. CFSAN SNP Pipeline: an automated method for constructing SNP matrices from next-generation sequence data. PeerJ Comput Sci. 2015;1:e20.