
ABSTRACT
CTLA-4 blocking therapeutic antibodies are currently under investigation in head and neck squamous cell carcinoma (HNSCC). A better understanding of the epigenetic regulation of the CD28 superfamily members CD28, CTLA-4, and ICOS and their B7 ligands, CD80 and CD86, could support the development of biomarkers for response prediction to anti-CTLA-4 immunotherapy.
We investigated methylation of the encoding genes CD28, CTLA4, ICOS, CD80, and CD86 at single CpG resolution (51 CpG sites) in a cohort of HNSCC (N = 528) and normal adjacent tissue samples (N = 50) provided by The Cancer Genome Research Atlas, in isolated blood leukocytes from healthy individuals (N = 28), and HNSCC cell lines (N = 39). We analysed methylation levels with regard to mRNA expression, overall survival, mutational load, interferon-γ signature, and signatures of immune cell infiltrates.
Depending on the location of the CpG sites (promoter, promoter flank, gene body, and intergenic sites), we found significant differences in methylation levels among isolated leukocytes, between leukocytes and HNSCC cell lines, and among HNSCCs. Methylation of all analysed genes correlated inversely or positively with mRNA expression, depending on the CpG site. CD28, CTLA4, and ICOS revealed almost identical correlation patterns. Furthermore, we found significant correlations with survival and features of response to immunotherapy, i.e. interferon-γ signature, signatures of tumour infiltrating immune cells, and mutational load.
Our results suggest CD28, CTLA4, ICOS, CD80, and CD86 expression levels are epigenetically co-regulated by DNA methylation. This study provides rationale to test their DNA methylation as potential biomarker for prediction of response to CTLA-4 immune checkpoint inhibitors.
Introduction
Head and neck squamous cell carcinomas (HNSCCs), originate from epithelial cells of the lip, oral cavity, oropharynx, larynx, and pharynx [Citation1]. The incidence of HNSCC is rising and lethality is high with an overall five-year survival rate of ~50% [Citation2]. HNSCCs are extremely heterogeneous, differing not only in location but also in risk factors, aetiology, molecular alterations driving carcinogenesis, tumour microenvironment, and prognosis [Citation1–3]. The majority of HNSCCs are associated with tobacco, alcohol, and other noxious agents. However, oral and oropharyngeal HNSCCs can also be linked to an infection with high-risk types of the human papilloma virus (HPV), especially HPV type 16 [Citation1].
Tumour therapy has experienced a striking step forward since immune checkpoint blockade (ICB) has been introduced into this field. ICB is a treatment strategy that blocks immune checkpoint pathways to prevent tumour cells from evading immune control [Citation4]. In 2016, the first immune checkpoint blocking monoclonal antibodies (mAbs), pembrolizumab, and nivolumab, both targeting the programmed cell death protein 1 (PD-1) were approved as second-line treatment for locally advanced and metastatic HNSCC after platinum-based chemotherapy [Citation5,Citation6]. Since June 2019, pembrolizumab has gained Food and Drug Administration (FDA)-approval as first-line treatment of metastatic or recurrent, unresectable HNSCC [Citation7]. Multiple clinical trials investigating different ICB approaches not only in the recurrent/metastatic setting, but also in the neoadjuvant setting of HNSCC are currently ongoing (Clinicaltrials.gov). Antibodies targeting the cytotoxic T lymphocyte antigen 4 (CTLA-4), such as ipilimumab and tremelimumab, are currently under clinical investigation for HNSCC. Beyond the approved anti-CTLA-4 therapeutic mAb ipilimumab (Bristol-Myers Squibb, New York City, NY, USA), several other CTLA-4 mono- or bispecific mAbs and probodies are under investigation in pre-clinical up to phase III trials. Other therapeutic approaches in oncology targeting the immune checkpoint pathway include the inducible co-stimulator (ICOS) agonists and an ICOS antagonist (MEDI-570 (AstraZeneca)), and a CD80 fusion protein (FPT155 (Five Prime Therapeutics, San Francisco, CA)).
CTLA-4 is a well-studied transmembrane protein belonging to the B7-CD28 superfamily [reviewed in Citation8]. It functions as an inhibitory, co-stimulatory molecule which interferes with the process of T cell activation, which is mediated by the interaction between the T-cell receptor (TCR) expressed on T cells and the major-histocompatibility-complex (MHC) expressed on antigen presenting cells (APCs). CTLA-4 is expressed constitutively by FoxP3+ regulatory T cells (Tregs) and can be upregulated upon activation by helper Cluster of Differentiation 4 positive (CD4+) T cells and CD8+ T cells [Citation9–11]. Additionally, CTLA-4 can be expressed by tumour cells [Citation12,Citation13]. The natural ligands of CTLA-4 are CD80 (B7-1) and CD86 (B7-2), which are both expressed by APCs (B cells, dendritic cells (DCs), and macrophages) and T cells [Citation14]. CD86 is expressed constitutively on APCs and can be further upregulated rapidly after activation whereas CD80 is expressed only later following activation [Citation8,Citation14,Citation15]. CTLA-4 competes with a co-stimulatory molecule, CD28, for their shared ligands, CD80 and CD86. In contrast to CTLA-4, CD28 is expressed on naïve and activated CD4+ and CD8+ T cells and promotes the immune response and T cell activation [Citation8,Citation9,Citation16]. In addition to CTLA-4 and CD28, the B7-CD28 superfamily includes the CD28 homologue ICOS [Citation8]. ICOS is upregulated by activated T cells and interacts with the ICOS ligand (ICOS-L, B7 h), expressed by a variety of cell types, particularly APCs [Citation8]. ICOS plays a co-stimulatory role in effector T cell regulation, T helper (Th) cell differentiation, and cytokine production [Citation17–23].
DNA methylation is an epigenetic mechanism of fundamental importance regarding several biological processes, including tumorigenesis. DNA methylation occurs at cytosines of CpG dinucleotides [Citation24]. Immune checkpoint DNA methylation is linked to immunological processes, such as T cell differentiation and T cell exhaustion, and terminal T cell exhaustion which is associated with ICB failure [Citation25–27]. Furthermore, immune checkpoint methylation has been suggested as a prognostic or predictive biomarker in prior studies investigating different tumours, among them HNSCC [Citation28–32].
Although CTLA-4 and its functionally related molecules CD28, CD80, CD86, and ICOS are well studied especially regarding their functions and interactions with one another, little is known regarding their epigenetic regulation. Understanding the regulation of the immune checkpoint genes is critical for the development of mechanism-driven predictive biomarkers for response to immunotherapies. At present, predictive biomarkers for response to immune checkpoint blockade include immune cell infiltration, immune checkpoint expression by tumour and/or immune cells, tumour mutational burden, and an interferon-γ (IFN-γ) signature [Citation33–36]. In the present study, we performed detailed DNA methylation analyses of CTLA4 and its opponent CD28, their ligands CD80 and CD86, and the related immune checkpoint molecule ICOS in The Cancer Genome Atlas (TCGA) HNSCC cohort at single CpG resolution. We examined the relationships between DNA methylation and mRNA expression of the respective genes and investigated potential correlations with mutational load, immune infiltrates, interferon-γ signature, and survival.
Results
Methylation of CD28, CTLA-4, ICOS, CD80, and CD86, and its correlation with mRNA expression
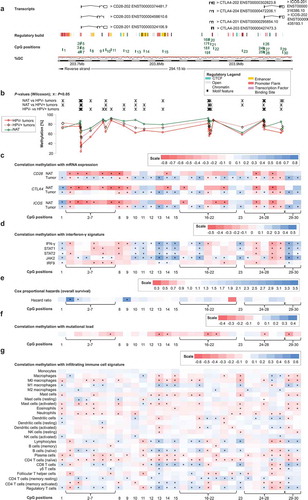
Firstly, we analysed 30 CpG sites within the locus on the long arm of chromosome 2 that encompasses the adjacent genes CD28, CTLA4, and ICOS in a large cohort provided by TCGA Research Network (). Sites 1–14 were located within the CD28 encoding gene and the intergenic region between CD28 and CTLA4. CpG positions 15–23 were located within the CTLA4 gene locus and its regulatory elements. ICOS was targeted by CpG sites 24–30. We analysed DNA methylation levels in normal adjacent tissue (NAT) and tumour tissue, stratified according to HPV-status. We found a high variance of DNA methylation depending of the specific locus under investigation. DNA methylation of most CpG sites differed significantly between NAT, HPV-positive (HPV+), and HPV-negative (HPV–) tumour tissues (). For the vast majority of CpG sites, we observed significantly higher mean methylation in NAT compared to tumour tissue and higher methylation levels in HPV+ compared to HPV– tumour tissue ().
Figure 2. Genomic organization of CD80 (a); CD80 methylation in normal adjacent and tumour tissues (b); correlations with mRNA expression (c), interferon-γ signature (d), overall survival (e), mutational load (f), and tumour infiltrating immune cells (g). a) Shown are CG-density and eight target sites of HumanMethylation450 BeadChip beads. CpGs 31–38 (31–32: gene body, 33–34: central promoter, 35–38: promoter flank). b) Shown are methylation levels within the eight targeted CpG loci within CD80 in normal adjacent tissue (NAT), HPV+ and HPV– tumour tissue. c) Shown are Spearman’s ρ of CD80 methylation and CD80 mRNA expression and d) with interferon-γ signature. e) Cox proportional hazards with regard to CD80 methylation. f) Correlations between CD80 methylation and mutational load. g) Correlations between CD80 methylation and signatures of tumour infiltrating leukocytes. Statistically significant features are marked with asterisks. P-values refer to Wilcoxon-Mann-Whitney U test for comparisons, to Spearman’s ρ for correlations, and Wald test for Cox proportional hazard analysis
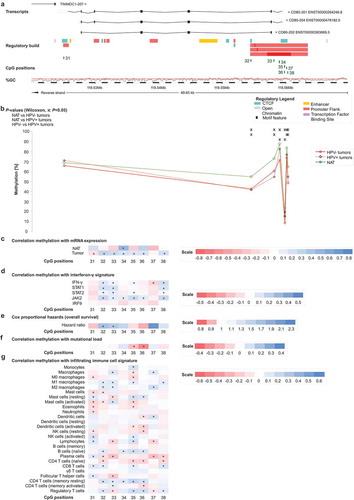
Next, we performed Spearman´s rank correlation analysis (Spearman´s ρ) to investigate potential relationships between DNA methylation and mRNA expression (). Since the analysed CpG sites within CD28, CTLA4, and ICOS were located in close proximity, we expected that co-methylation would occur and thus correlated DNA methylation of all CpG sites with mRNA expression of each of the three respective genes. In NAT, we observed predominantly positive correlations between mRNA expression and gene body methylation and, in contrast, negative correlations for CpG sites within the promoter (). Methylation of the CpG sites 2–7, targeting the promoter region of CD28, showed strong inverse correlations, not only with CD28 mRNA, but also with mRNA expression of CTLA-4 and ICOS. Furthermore, in normal tissue, DNA methylation of CpG sites 8 (gene body of CD28), 14 (intergenic), 16 and 21 (CTLA4 promoter), and 25 and 27 (ICOS promoter) correlated inversely with mRNA expression of the three genes. However, correlation patterns in tumour tissue differed significantly from NAT. In tumour tissue, all three genes showed similar correlation patterns, with methylation and mRNA expression correlating positively or negatively depending on the specific CpG site (). Additionally, mRNA expression of the respective genes showed strong, significantly positive mutual correlations (CD28/CTLA-4: ρ = 0.752; CD28/ICOS: ρ = 0.840; CTLA-4/ICOS: ρ = 0.909; all P < 0.001).
In addition, we investigated two genomic regions, both located on chromosome 3, encoding for genes CD80 and CD86 ( and ). CpG sites 31–38 were located within the CD80 gene (), and the CD86 gene was targeted by CpG sites 39–51 (). Again, DNA methylation levels of most CpG sites were higher in NAT compared to tumour tissue and HPV+ tumours exhibited predominantly higher methylation levels compared to HPV– tumours regarding most of the analysed CpG sites. However, differences between the subgroups of HPV-positive and -negative tumours were not statistically significant at most CpG sites ( and ).
Figure 3. Genomic organization of CD86 (a); CD86 methylation in normal adjacent and tumour tissues (b); correlations with mRNA expression (c), interferon-γ signature (d), overall survival (e), mutational load (f), and tumour infiltrating immune cells (g). a) Shown are CG-density and 13 target sites of HumanMethylation450 BeadChip beads. CpGs 39–51 (including two alternative promoters: 39–41 and 45–48 promoter centres, 42–44 and 49 promoter flanks, 50–51 gene body). b) Shown are methylation levels within the 13 targeted CpG loci within CD86 in normal adjacent tissue (NAT), HPV+ and HPV– tumour tissue. c) Shown are Spearman’s ρ of CD86 methylation and CD86 mRNA expression and d) with interferon-γ signature. e) Cox proportional hazards with regard to CD86 methylation. f) Correlations between CD86 methylation and mutational load. g) Correlations between CD86 methylation and signatures of tumour infiltrating leukocytes. Statistically significant features are marked with asterisks. P-values refer to Wilcoxon-Mann-Whitney U test for comparisons, to Spearman’s ρ for correlations, and Wald test for Cox proportional hazard analysis
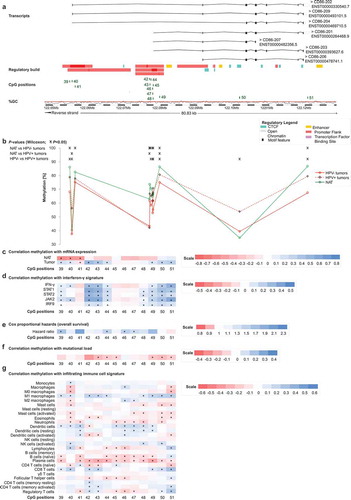
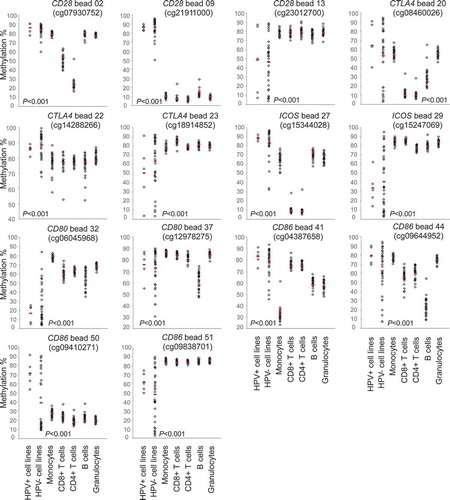
Figure 4. CD28, CTLA4, ICOS, CD80, and CD86 methylation in isolated immune cells and HNSCC cell lines. Shown are methylation levels in isolated immune cell subsets (N = 28) from healthy donors, and in HPV-negative (N = 34) and HPV-positive (N = 5) HNSCC cell lines exemplarily at three CpGs targeting CD28, three CpGs targeting CTLA4, two CpGs targeting ICOS, two CpGs targeting CD80 and four CpGs targeting CD86. Red bars indicate median methylation levels
For both, CD80 and CD86, most statistically significant correlations of methylation and mRNA expression were found in HPV– tumours, whereas in NAT the majority of correlations were not statistically significant ().
Correlation of CD28, CTLA4, ICOS, CD80, and CD86 DNA methylation with interferon-γ signature
The co-stimulatory molecule CD28, together with the ligands CD80 and CD86, play important roles in T cell activation and consequently in cytokine secretion such as IFN-γ needed for an effective immune response. CTLA-4 is upregulated on the cell surface of effector T cells secreting IFN-γ and expression of ICOS is induced in the presence of IFN-γ [Citation11,Citation21,Citation37]. We used IFN-γ and IFN-γ regulated genes (signal transducer and activator of transcription 1 and 2 (STAT1, STAT2), janus kinase 2 (JAK2), interferon regulatory factor 9 (IRF9)) as markers for an IFN-γ signature and consequently a predicted immune-infiltrated tumour microenvironment. We investigated potential correlations of IFN-γ signature genes with DNA methylation of CD28, CTLA4, ICOS, CD80, and CD86 in HPV+ and HPV– tumours (). Overall, we saw a similar pattern to the correlations between DNA methylation and mRNA expression of the respective genes in HNSCC. Methylation of CpG sites located in intergenic regions and in the gene bodies of CD28, CTLA4, and ICOS (CpG sites 1, 10–15, 23, 29–30) correlated predominantly positively with the IFN-γ signature, while CpG sites located in promoters correlated negatively (). As seen previously, CpG sites 8–9 correlated negatively despite located in the CD28 gene body, while sites 17–18 (CTLA4 promoter flank) correlated positively. Regarding CD80 and CD86, methylation of the vast majority of CpG sites correlated positively with an IFN-γ signature ( and ). Of note, at the significantly positively correlating CpG sites, methylation correlated positively with mRNA expression in our prior analyses as described above.
CD28, CTLA4, ICOS, CD80, and CD86 DNA methylation in isolated leukocytes and HNSCC cell lines
We analysed methylation levels of the immune checkpoint genes in pure cell populations of blood leukocytes (including CD8+ and CD4+ T cells, B cells, monocytes, and granulocytes) from healthy donors and in HNSCC cell lines (five HPV+ and 34 HPV– cell lines), respectively. Altogether, methylation levels varied significantly depending on the specific CpG site assessed (). We performed cluster analysis in order to examine methylation patterns of different leukocytes and tumour cell lines (). Altogether, granulocytes and monocytes formed a cluster, differing only minimally from B cells. They all presented high methylation of CTLA4 and ICOS, and several CpG sites within CD28, CD80, and CD86. We were able to distinguish monocytes and granulocytes from B cells via hypomethylation of the CD80 gene body (site 31). At site 41 (CD86 promoter), monocytes exhibited low methylation and granulocytes exhibited high methylation ( and ). Hypomethylation of the CD86 promoter (site 44) was unique to B cells ( and ). CD4+ and CD8+ T cells formed a cluster. Compared to granulocytes, monocytes, and B cells, T cells exhibited lower methylation at promoter sites 20 (CTLA4), 27 and 28 (both ICOS), and higher methylation at site 45 (CD86, and ). Among T cells, we observed differences in methylation of promoter CpG sites within CD28, CTLA4, and ICOS (sites 2–4, 19, 33), at which CD4+ T cells displayed significantly lower methylation compared to CD8+ T cells and all other cells analysed. In comparison to immune cells, methylation levels in HNSCC cell lines differed significantly. HPV+ and HPV– cell lines clustered, however, the cluster was heterogeneous (). The most striking difference between HNSCC cell lines and immune cells was at locus 9 (CD28 gene body), where immune cells were hypomethylated and tumour cells hypermethylated. Furthermore, we observed high tumour and low immune cell methylation at several CpG sites targeting the CD86 gene body (site 50), as well as at the CD86, CD80, and CD28 promoter (sites 45–48, 35–36, and 5–6; and ).
Figure 5. Cluster analysis of methylation in HNSCC cell lines and isolated leukocytes. Methylation levels of isolated leukocytes (N = 28, granulocytes, monocytes, B cells, CD4+ T cells, CD8+ T cells) and HNSCC cell lines (N = 5 HPV+, N = 34 HPV–). Methylation levels of 47 CpG sites targeting CD28, CTLA4, ICOS, CD80, and CD86 are investigated. The position of the CpG site (promoter, gene body, intergenic) and the correlation with the respective mRNA expression are illustrated
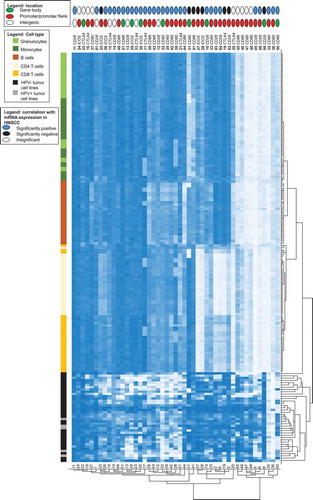
Figure 6. Unsupervised clustering of correlation coefficients between methylation and signatures of tumour infiltrating immune cells. Shown is a heat map of Spearman’s ρ between methylation and signatures of tumour infiltrating immune cells. RNAseq signatures provided by Thorsson et al. [Citation38] were used to quantify distinct immune cell subsets in the tumour microenvironment. The position of the CpG site (promoter, gene body, intergenic) and the correlation with the respective mRNA expression are illustrated
![Figure 6. Unsupervised clustering of correlation coefficients between methylation and signatures of tumour infiltrating immune cells. Shown is a heat map of Spearman’s ρ between methylation and signatures of tumour infiltrating immune cells. RNAseq signatures provided by Thorsson et al. [Citation38] were used to quantify distinct immune cell subsets in the tumour microenvironment. The position of the CpG site (promoter, gene body, intergenic) and the correlation with the respective mRNA expression are illustrated](/cms/asset/c97f4830-0412-47e1-86c4-8ef862eae31d/kepi_a_1754675_f0006_c.jpg)
Correlations of CD28, CTLA4, ICOS, CD80, and CD86 DNA methylation with signatures of infiltrating leukocytes
Next, we investigated correlations of methylation and mRNA expression with leukocytes in the tumour microenvironment from the TCGA cohort. RNA sequencing (RNAseq) signatures were used as surrogate markers for identifying different immune cell types as described previously by Thorsson et al. [Citation38]. We observed positive correlations between all CD28, CTLA-4, and ICOS mRNA expression and signatures of CD8+ T cells, Tregs, naïve B cells, total lymphocytes, CD4+ memory T cells, T follicular helper cells, M1 macrophages, and resting mast cells. Expression of all three genes correlated inversely with signatures of naïve CD4+ T, naïve B cells, plasma cells, M0 and total macrophages, total mast cells, eosinophils, activated and total mast, and dendritic cells. CD80 mRNA expression correlated positively with signatures of M1 macrophages, resting CD4+ memory T cells, Tregs, naïve B cells and CD8+ T cells, and total lymphocytes and correlated inversely with signatures of naïve CD4+ T cells, plasma cells, total mast cells, eosinophils, M0 macrophages, memory B cells, total and activated DCs. CD86 expression correlated positively with signatures of Tregs, M1 macrophages, CD8+ T cells, activated memory CD4+ T cells, naïve B cells, M2 macrophages, resting memory CD4+ T cells, and total lymphocytes, and inversely with signatures of naïve CD4+ T cells, plasma cells, total mast cells, activated and total DCs, activated mast cells, M0 macrophages and memory B cells. Correlations between signatures of the aforementioned immune cell subsets and methylation at all analysed CpG sites are illustrated in , , and .
In order to examine relationships between methylation and the signatures of distinct subsets of immune cells, we conducted cluster analysis of correlations between immune cells and methylation. Altogether, we observed that, on the one hand, distinct immune cell subsets formed clusters and, on the other hand, several CpG sites clustered (). Strikingly, we found two groups of cell types that showed opposing correlation patterns at identical CpG sites. The first cluster was formed by M1 macrophages, CD8+ T cells, total lymphocytes, Tregs, and naïve B cells. The second cluster was comprised of M0 macrophages, total and activated mast cells, and naïve CD4+ T cells. For the first cluster, we observed positive correlations with methylation of CpG sites located in intergenic regions (1, 12, 14), the promoters of CD28 (4–6), CTLA4 (17, 21), and ICOS (26), and within the gene bodies of CD80 (31), CD86 (50), and CD28 (8). In contrast, the subset of cells forming the second cluster correlated negatively with methylation at those sites. The first cluster additionally revealed equally positive correlations with methylation of CpG sites located in intergenic regions (13, 23), CD28 (15, 18) and CD86 (40) promoter, and ICOS (29, 30) and CD86 (51) gene bodies, while at those CpG sites negative correlations appeared for the second cluster. Furthermore, we observed a third small cluster containing activated memory CD4+ T and follicular Th cells which correlated positively with methylation at those CpG sites. Total lymphocytes, Tregs, and naïve B cells differed from M1 macrophages and CD8+ T cells at the CD86 promoter (39, 44, 48, 49), since the former cells correlated positively with methylation and the latter correlated negatively. Furthermore, total lymphocytes, Tregs, naïve B cells, and additionally plasma cells displayed similar inverse correlations of the intergenic regions and promoter areas of CTLA4, ICOS, CD80, and CD86 (CpG sites 2, 11, 19; 27, 28, 33, 37, 39, 41, 44–49). We observed that plasma cells and eosinophils displayed similarities. However, the remaining cell types did not form remarkable clusters.
Figure 1. Genomic organization of CD28, CTLA4, and ICOS (a); CD28, CTLA4, and ICOS methylation in normal adjacent and tumour tissues (b); correlations with mRNA expression (c), interferon-γ signature (d), overall survival (e), mutational load (f), and tumour infiltrating immune cells (g). a) Shown are CG-density and 30 target sites of HumanMethylation450 BeadChip beads. CD28: CpGs 1–14 (1 intergenic region, 2–7 central promoter, 8–10 gene body, 11–14 intergenic region); CTLA4: CpGs 15–23 (15 intergenic region, 16–18 promoter flank, 19–21 central promoter, 22 gene body, 23 intergenic region); ICOS: CpGs 24–30 (24–25 promoter flank, 26–28 central promoter, 29–30 gene body). b) Shown are methylation levels within the 30 targeted CpG loci within CD28, CTLA4, and ICOS in normal adjacent tissue (NAT), HPV+ and HPV– tumour tissue. c) Shown are Spearman’s ρ between CD28, CTLA4, and ICOS methylation and CD28, CTLA-4, and ICOS mRNA expression and D) with interferon-γ signature. e) Cox proportional hazards with regard to CD28, CTLA4, and ICOS methylation. f) Correlations between CD28, CTLA4, and ICOS methylation and mutational load. g) Correlations between CD28, CTLA4, and ICOS methylation and signatures of tumour infiltrating leukocytes. Statistically significant features are marked with asterisks. P-values refer to Wilcoxon-Mann-Whitney U test for comparisons, to Spearman’s ρ for correlations, and Wald test for Cox proportional hazard analysis, respectively
Correlations of CD28, CTLA4, ICOS, CD80, and CD86 with tumour mutational load
For all analysed genes, DNA methylation showed a strong inverse correlation with tumour mutational load (, , and ). These correlations occurred at CpG sites where mRNA expression of the respective genes correlated positively with methylation in our prior analyses, with the exception of CpG site 19 (CTLA4 promoter), at which mRNA expression and methylation had an inverse correlation.
Correlations of CD28, CTLA4, ICOS, CD80, and CD86 methylation with overall survival
Lastly, we analysed CD28, CTLA4, ICOS, CD80, and CD86 mRNA expression and methylation with regard to overall survival (OS). For both mRNA and methylation analyses, we used log2-transformed variables. Methylation of distinct CpG sites was significantly associated with poor OS (, , and ). CD28 (CpG sites 2, 3), CD80 (CpG site 33), and CD86 (CpG sites 39, 44, 46, 47) promoter methylation was associated with an increased risk of death, as was gene body methylation within CD28 (CpG site 9) and CD80 (CpG site 32) (site 2: Hazard Ratio (HR) = 3.45, [95% Confidence Interval (95%CI) = 1.34–8.89], P = 0.010; site 3: HR = 1.63, 95%CI = 1.00–2.63], P = 0.049; site 9: HR = 3.17, [95%CI = 1.25–8.06], P = 0.015; site 32: HR = 1.70, [95%CI = 1.19–2.41], P = 0.003; site 33: HR = 1.59, [95%CI = 1.07–2.35], P = 0.021; site 39: HR = 1.65, [95%CI = 1.13–2.41], P = 0.010; site 44: HR = 1.47, [95%CI = 1.01–2.14], P = 0.049; site 46: HR = 1.50, [95%CI = 1.05–2.15], P = 0.025; site 47: HR = 1.37, [95%CI = 1.06–1.77], P = 0.016). CTLA4 and ICOS methylation was not significantly associated with survival.
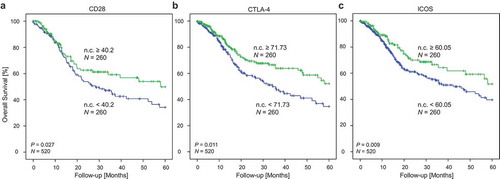
Log2-transformed mRNA expression levels of CD28, CTLA-4, and ICOS were significantly associated with better OS (CD28: HR = 0.86, [95%CI = 0.78–0.95], P = 0.003; CTLA-4: HR = 0.86, [95%CI = 0.78–0.95], P = 0.004; ICOS: HR = 0.86, [95%CI = 0.78–0.95], P = 0.003). CD80 and CD86 mRNA expression was not significantly associated with OS. When the cohort was stratified according to HPV-status, statistically significant results were only obtained for HPV–, but not for HPV+ patients. In order to evaluate survival differences in patients with high and low mRNA expression of checkpoint molecules in tumours, we classified the HNSCC cohort with regard to mRNA expression above and below the median. We observed significantly better overall survival in patients with high CD28, CTLA-4, and ICOS expression in the tumours compared to patients with low expression of these mRNAs (CD28: P = 0.027, CTLA-4: P = 0.011, ICOS: P = 0.009; ).
Figure 7. Kaplan Meier analysis of overall survival in HNSCC patients stratified according to CD28 (a), CTLA-4 (b), and ICOS (c) mRNA expression. Patient samples (N = 520) from the TCGA were dichotomized based on median cut-offs (median cut-off CD28: 40.2 n.c.; CTLA-4: 71.73 n.c.; ICOS: 60.05 n.c.). P-values refer to log-rank test
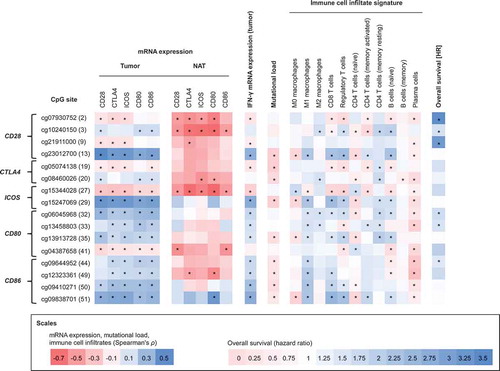
In order to give an overview about the most significant findings of the study, we selected the CpG sites showing strongest correlations and summarized these in .
Figure 8. Correlations between methylation of selected CpG sites with mRNA expression, interferon-γ, mutational load, immune cell infiltrates, and survival. Spearman’s rank correlations between methylation of 16 selected CpG sites within CD28, CTLA4, ICOS, CD80, and CD86 with mRNA expression in HNSCCs (N = 528), mRNA expression in normal adjacent tissues (N = 50), interferon-γ, mutational load, selected immune infiltrates, and overall survival
Discussion
Methylation is an epigenetic modification which is known to regulate mRNA expression of many genes. Promoter methylation and gene body methylation are commonly associated with a decrease and increase in mRNA expression, respectively [Citation24]. We found strong, significant correlations between methylation and mRNA expression of the analysed immune checkpoints, suggesting an epigenetic regulation via DNA methylation. Interestingly, promoter methylation of CD28 was not only associated with CD28 mRNA expression but also with mRNA expression of CTLA-4 and ICOS. In accordance, mRNA expression of CD28, CTLA-4, and ICOS showed mutual strong, positive correlations. Since CTLA4 and ICOS are located in close proximity to, and downstream of, CD28, the parallel expression suggests the genes are co-regulated.
In the context of the analysed immune checkpoints, the individual CpG sites need to be taken into account individually, independent of the location in promoter or gene body areas. One limitation of the study is that the Infinium HumanMethylation450 BeadChip only covers a small fraction of all CpGs in the gene areas. Therefore, further studies covering the entirety of CpGs, e.g. examined via whole genome bisulphite sequencing, need to be carried out. Nevertheless, our study provides a first insight into the methylation landscape of CD28, CTLA4, ICOS, CD80, and CD86. In , we depict CpG sites of interest for potential future studies regarding methylation testing for prediction of response to immunotherapies.
Since anti-CTLA-4 antibodies are associated with more severe side effects and have worse response rates compared to anti-PD-1 antibodies [Citation38], there is an urgent need for reliable predictive biomarkers to select patients who could potentially profit from this therapy. Recently, Goltz and colleagues presented the first study showing the feasibility of DNA methylation as a predictive biomarker for the response to PD-1 and CTLA-4 ICB [Citation39]. In the context of biomarker development, DNA methylation testing holds several prominent advantages compared to RNA or protein testing. DNA methylation is biologically and chemically more stable, which is of interest for the sample processing procedure. Furthermore, methylation can be quantified from only small amounts of formalin-fixed and paraffin-embedded tissues [Citation40,Citation41]. One major problem in RNA and protein testing can be a misinterpretation of a heterogeneous sample as different cell types can express vastly different quantities of RNA and protein. In contrast, each diploid cell contains the same amount (two copies) of DNA. This is an advantage of DNA methylation testing over RNA and protein testing. However, a limitation that needs to be considered is that cancer cells can be aneuploidy, or genes can be amplified.
In the context of tumour immunogenicity, ICOS signalling can have opposing effects. On one hand, it enhances anti-tumour immunity via augmentation of anti-tumour immune response [reviewed in Citation42]. On the other hand, ICOS expression on Tregs and on tumour cells is associated with immune inhibition and tumour immune escape mechanisms, which has been observed in several solid malignancies [reviewed in Citation42]. Therefore, clinical trials are currently investigating both ICOS agonists and antagonists in several different malignancies, among them HNSCC (ClinicalTrials.gov Identifier: NCT03752398, NCT03693612, NCT04128696, NCT03989362, NCT03251924, NCT03829501, NCT02520791). ICOS expression has also been investigated with regard to CTLA-4-targeting antibodies. Fu et al. indicated that the efficacy of CTLA-4 ICB depends on the expression of ICOS [Citation43], and the frequency of ICOS+ CD4 T cells has been suggested as a biomarker for anti-CTLA-4 immune therapy [Citation44]. Interestingly, a prior study carried out by Di Giacomo and colleagues observed an upregulation of circulating ICOS+ T cells during ipilimumab treatment of melanoma patients [Citation45]. Patients exhibiting an increase in ICOS+ T cells were more likely to respond to ipilimumab [Citation45]. Consequently, as ICOS is involved in treatment response to CTLA-4 ICB, ICOS methylation analysis should be tested not only in context of prediction to anti-ICOS antibodies but also in the context of CTLA-4 ICB in future studies.
Similar to ICOS, CD80 holds potential to be a next-generation immune-therapeutic agent [Citation46,Citation47]. High expression of CD80 on tumour lead to anti-tumour immunogenicity in prior studies [Citation48,Citation49]. Haile et al. showed that transfection of the CD80 gene into tumour cell lines lead to reduced PD-L1-associated immune suppression and to enhanced T cell activation [Citation46]. Likewise, Singh et al. showed that integration of a molecule containing the extracellular domain of CD80 into the cell surface of tumour cells resulted in augmented immune response in vitro and in vivo, in cell lines from gynaecologic cancers and in a lymphoma mouse model [Citation50]. However, knowledge about CD80 is sparse, particularly with regard to immune-therapeutics. Nevertheless, we found methylation of CD80 to be associated with poor prognosis of HNSCC patients in the present study. CD80 methylation testing represents a promising approach as prognostic biomarker for HNSCC patients and its performance should be elucidated in further studies.
As the TCGA obtained their data from whole tissue samples, methylated DNA either originates from tumour cells or from cells in the tumour microenvironment. The origin being unknown is a major limitation of our study. To partly overcome this limitation, we additionally examined methylation data of isolated blood leukocytes and HNSCC cell lines. Generally, HNSCCs tumours are highly infiltrated by immune cells [Citation51]. Methylation levels varied significantly between NAT and tumour tissue in our analysis. Additionally, immune checkpoint methylation correlated positively with an IFN-γ signature. Hence, the methylation signal we analysed in tumour samples is likely to originate from immune cells and could serve as a surrogate marker for tumour immune infiltration in HNSCC. However, in order to gain a deeper functional insight, single-cell methylation analysis of immune and HNSCC cells should be carried out in future studies.
The prognosis of HNSCC depends, amongst other factors, on the HPV-status, with HPV+ HNSCCs being associated with a favourable outcome compared to smoking-related HNSCCs [Citation1,Citation2]. As in several other malignancies, an increased tumour infiltration with TILs is associated with favourable prognosis in HNSCC, and prior studies found higher immune infiltrates in HPV+ HNSCCs compared to smoking-related HNSCCs [Citation51–53]. It is not surprising that we found high mRNA expression of immune stimulatory molecule CD28 was associated with favourable prognosis. Prior studies analysing the prognostic value of the inhibitory CTLA-4 came to opposing conclusions. In different studies, high CTLA-4 mRNA expression was linked to better OS in non-small cell lung cancer [Citation54], or worse OS in nasopharyngeal carcinoma [Citation55] and thymoma [Citation56]. Similarly, while ICOS expression was associated with improved prognosis in colorectal carcinomas [Citation57], it was associated with poor prognosis in breast [Citation58], and renal cell carcinoma [Citation59]. One explanation for better OS of patients with high CTLA-4 and ICOS expression found in our study is a generally higher immune infiltration of those tumours, regardless of the activation state. This is further supported by the hypothesis of CD28, CTLA-4, or ICOS expression being a surrogate measure for immune infiltration.
Prior studies showed that HPV is able to manipulate the hosts´ immune response by inducing hypermethylation causing alterations of immune-related gene expression [Citation60–65]. We confirmed molecular differences between HPV+ and HPV–HNSCCs on an epigenetic level. However, it must be noted that in contrast to the larger cohort of HPV– samples and cell lines, only a small sample size of HPV+ tumours and cell lines were available. Hence, the analyses regarding methylation of different immune cell subsets should be conducted with a higher number of HPV+ tumours in order to examine whether statistically non-significant results of our analyses are due to the small sample size.
In conclusion, our results suggest CTLA-4, CD28, CD80, CD86, and ICOS expression levels are epigenetically regulated by DNA methylation. Depending on the specific CpG site, methylation correlated with features which are known to have prognostic value for response to ICB, i.e. immune checkpoint mRNA expression, CD8+ T cell infiltration, tumour mutational burden, and an IFN-γ signature. Our study provides rationale to test DNA methylation as potential biomarker for prediction of response to CTLA-4 immune checkpoint inhibitors.
Materials and methods
Patient samples and ethics
Data on molecular and clinical-pathological features were obtained from TCGA Research Network (http://cancergenome.nih.gov/). In accordance with the guidelines of the Declaration of Helsinki of 1975, all patients included into the TCGA cohort signed informed consent. Data on N = 50 normal adjacent tissue samples and N = 528 HNSCC tissue samples and were included. Thereof, N = 279 tumour samples displayed a known HPV status (N = 36 HPV+ and N = 243 HPV–).
Signatures of immune cell infiltrates
Quantitative data on tumour immune infiltrates (RNASeq signatures calculated with the CIBERSORT algorithm) in samples of the TCGA cohort were obtained from Thorsson et al. [Citation37,Citation66]. We investigated signatures of infiltrating lymphocytes (CD8+ T cells, regulatory T cells, T follicular helper cells, γδ T cells, naïve CD4+ T cells, resting and activated memory CD4+ T cells, naïve B cells, memory B cells, plasma cells, resting and activated natural killer (NK) cells), monocytes and macrophages (M0/M1/M2 macrophages), resting and activated dendritic cells, resting and activated mast cells, eosinophils, and neutrophils.
Tumour cell lines and isolated immune cells
We additionally included methylation data of isolated peripheral leukocytes (N = 28) generated by Mill et al. (Gene Expression Omnibus (GEO) accessions: GSE103541; National Centre for Biotechnology Information (NCBI), Bethesda, MD, USA). Isolated immune cells were obtained from healthy donors and comprised monocytes, B cells, CD4+ and CD8+ T cells, and granulocytes. Additionally, we included data of six HNSCC cell lines (N = 3 HPV+: UPCI:SCC090, 93VU-147 T, UM:SCC047; and N = 3 HPV: UPCI:SCC003, UPCI:SCC036, and PCI-30) provided by Lechner et al. (GEO accession number: GSE38271), N = 20 HPV– HNSCC cell lines (BHY, BICR22, CAL-27, CAL-33, Detroit562, FADU, HN, JHU-011, JHU-022, SAS, SAT, SCC-4, SCC-9, SCC-15, SCC-25, SKN-3, A253, HSC-3, OSC-19, Ca9-22) provided by Iorio et al. (GSE68379) [Citation67,Citation68], and N = 13 HNSCC cell lines (eleven HPV–: UM-SCC-14A, UM-SCC- 14B, UM-SCC-24A, UM-SCC-24B, UD-SCC-1, UD-SCC-4, UD-SCC-5, UM-SCC-11B, UM-SCC-10BPT, UT-SCC-33, UT-SCC-60B; two HPV+: UD-SCC-2, UM-SCC-104) provided by the University Hospital of Dusseldorf, Germany.
Methylation and mRNA expression analysis
Methylation analysis of the CD28, CTLA4, ICOS, CD80, and CD86 genes was performed targeting the following 51 CpG sites: CD28 (CpG sites 1–14): cg25683810 (1), cg07930752 (2), cg10240150 (3), cg13651908 (4), cg04098585 (5), cg02099418 (6), cg22309950 (7), cg13790288 (8), cg21911000 (9), cg24336674 (10), cg09861034 (11), cg01206398 (12), cg23012700 (13), and cg09345839 (14); CTLA4 (CpG sites 15–23): cg12005412 (15), cg22572158 (16), cg05092371 (17), cg24077172 (18), cg05074138 (19), cg08460026 (20), cg26091609 (21), cg14288266 (22), cg18914852 (23); ICOS (CpG sites 24–30): cg18219180 (24), cg00372692 (25), cg21423458 (26), cg15344028 (27), cg18561976 (28), cg15247069 (29), and cg17751550 (30); CD80 (CpG sites 31–38): cg21139795 (31), cg06045968 (32), cg13458803 (33), cg21572897 (34), cg13913728 (35), cg02470871 (36), cg12978275 (37), cg06300880 (38); and CD86 (CpG sites 39–51): cg11874272 (39), cg01878435 (40), cg04387658 (41), cg00697440 (42), cg06327732 (43), cg09644952 (44), cg13069531 (45), cg01436254 (46), cg16331599 (47), cg13617155 (48), cg12323361 (49), cg09410271 (50), cg09838701 (51).
Methylation data (β-values) were generated using the Infinium HumanMethylation450 and the Infinium MethylationEPIC BeadChips (Illumina, Inc., San Diego, CA, USA), respectively. Data were downloaded from the UCSC Xena browser (TCGA cohort, www.xena.ucsc.edu) and GEO webpage (blood leukocytes and HNSCC cell lines) [Citation67,Citation68]. In addition, we performed methylation analysis of cell lines provided by the University Hospital of Dusseldorf using the Infinium MethylationEPIC BeadChip (Illumina, Inc., San Diego, CA, USA) following the manufacturer’s instructions. The MethylationEPIC BeadChip does not cover CpG sites 7, 8, 18, and 40.
mRNA expression data was provided by the TCGA Research Network and was available for N = 521 tumour samples and N = 21 NAT samples. Illumina HiSeq 2000 RNA Sequencing Version 2 analysis (Illumina, Inc., San Diego, CA, USA) was used to generate this data. Normalized counts (n.c.) per genes were calculated using the SeqWare framework via the RSEM algorithm [Citation69].
Statistics
SPSS, version 25.0 (SPSS Inc., Chicago, IL, USA), was used to perform statistical analysis. Correlation analysis was performed with Spearman’s rank correlation in bivariat analyses. Wilcoxon-Mann-Whitney U test for comparison between two groups served as mean value comparison tests. Multiple comparisons between groups were executed by one-way analysis of variance (ANOVA) and post-hoc Bonferroni test. Survival analyses were performed using dichotomized values (median cut-off) for Kaplan-Meier analyses. Log2-transformed mRNA expression and methylation levels were used for Cox Proportional Hazard analyses. Survival data for OS calculation was censored after 60 months in order to avoid the inclusion of tumour-unrelated deaths. P-values refer to log-rank test for Kaplan-Meier and Wald test for Cox Proportional hazard analysis, respectively. Two-sided P-values<0.05 were considered statistically significant.
Supplemental Material
Download MS Excel (17.5 KB)Disclosure statement
Dimo Dietrich owns patents and patent applications on biomarker technologies and methylation of immune checkpoint genes as predictive and prognostic biomarkers (DE 10 2016 005 947.8, DE 10 2015 009 187.5, DE 10 2017 125 780.2, PCT/EP2016/001237). The patents are licensed to Qiagen GmbH (Hilden, Germany). Dimo Dietrich is a consultant of Qiagen. The University Hospital Bonn (PI Dimo Dietrich) receives research funding from Qiagen. The other authors have declared that no conflict of interest exists. Dimo Dietrich is a consultant for AJ Innuscreen GmbH (Berlin, Germany), a 100% daughter company of Analytik Jena AG (Jena, Germany), and receives royalties from product sales (innuCONVERT kits). The other authors have declared that no conflict of interest exists.
Supplementary material
Supplemental data for this article can be accessed here.
Additional information
Funding
References
- Leemans CR, Snijders PJF, Brakenhoff RH. The molecular landscape of head and neck cancer. Nat Rev Cancer. 2018 May;18(5):269–282.
- Canning M, Guo G, Yu M, et al. Heterogeneity of the Head and Neck Squamous Cell Carcinoma Immune Landscape and Its Impact on Immunotherapy. Front Cell Dev Biol. 2019;7:52.
- Cancer Genome Atlas Network. Comprehensive genomic characterization of head and neck squamous cell carcinomas. Nature. 2015 Jan 29;517(7536):576–582.
- Pardoll DM. The blockade of immune checkpoints in cancer immunotherapy. Nat Rev Cancer. 2012 Mar 22;12(4):252–264.
- Larkins E, Blumenthal GM, Yuan W, et al. FDA approval summary: pembrolizumab for the treatment of recurrent or metastatic head and neck squamous cell carcinoma with disease progression on or after platinum-containing chemotherapy. Oncologist. 2017 Jul;22(7):873–878.
- Guidi A, Codecà C, Ferrari D. Chemotherapy and immunotherapy for recurrent and metastatic head and neck cancer: a systematic review. Med Oncol. 2018 Feb 13;35(3):37.
- Cohen EEW, Bell RB, Bifulco CB, et al. The Society for Immunotherapy of Cancer consensus statement on immunotherapy for the treatment of squamous cell carcinoma of the head and neck (HNSCC). J Immunother Cancer. 2019 Jul 15;7(1):184.
- Sharpe AH, Freeman GJ. The B7-CD28 superfamily. Nat Rev Immunol. 2002. 2. Feb(2):116–126.
- Chikuma S. CTLA-4, an essential immune-checkpoint for T-cell activation. Curr Top Microbiol Immunol. 2017;410:99–126.
- Read S, Malmström V, Powrie F. Cytotoxic T lymphocyte-associated antigen 4 plays an essential role in the function of CD25(+)CD4(+) regulatory cells that control intestinal inflammation. J Exp Med. 2000 Jul 17;192(2):295–302.
- Buchbinder EI, Desai A. CTLA-4 and PD-1 Pathways: similarities, Differences, and Implications of Their Inhibition. Am J Clin Oncol. 2016 Feb;39(1):98–106.
- Mo X, Zhang H, Preston S, et al. Interferon-γ signaling in melanocytes and melanoma cells regulates expression of CTLA-4. Cancer Res. 2018 Jan 15;78(2):436–450.
- Contardi E, Palmisano GL, Tazzari PL, et al. CTLA-4 is constitutively expressed on tumor cells and can trigger apoptosis upon ligand interaction. Int J Cancer. 2005 Nov 20;117(4):538–550.
- Hathcock KS, Laszlo G, Pucillo C, et al. Comparative analysis of B7-1 and B7-2 costimulatory ligands: expression and function. J Exp Med. 1994 Aug 1;180(2):631–640.
- Freeman GJ, Gribben JG, Boussiotis VA, et al. Cloning of B7-2: a CTLA-4 counter-receptor that costimulates human T cell proliferation. Science. 1993 Nov 5;262(5135):909–911.
- Alegre ML, Frauwirth KA, Thompson CB. T-cell regulation by CD28 and CTLA-4. Nat Rev Immunol. 2001 Dec;1(3):220–228.
- Hutloff A, Dittrich AM, Beier KC, et al. ICOS is an inducible T-cell co-stimulator structurally and functionally related to CD28. Nature. 1999 Jan 21;397(6716):263–266.
- Dong C, Juedes AE, Temann UA, et al. ICOS co-stimulatory receptor is essential for T-cell activation and function. Nature. 2001 Jan 4;409(6816):97–101.
- McAdam AJ, Chang TT, Lumelsky AE, et al. Mouse inducible costimulatory molecule (ICOS) expression is enhanced by CD28 costimulation and regulates differentiation of CD4+ T cells. J Immunol. 2000 Nov 1;165(9):5035–5040.
- Beier KC, Hutloff A, Dittrich AM, et al. Induction, binding specificity and function of human ICOS. Eur J Immunol. 2000 Dec;30(12):3707–3717.
- Coyle AJ, Lehar S, Lloyd C, et al. The CD28-related molecule ICOS is required for effective T cell-dependent immune responses. Immunity. 2000 Jul;13(1):95–105.
- McAdam AJ, Greenwald RJ, Levin MA, et al. ICOS is critical for CD40-mediated antibody class switching. Nature. 2001 Jan 4;409(6816):102–105.
- Tafuri A, Shahinian A, Bladt F, et al. ICOS is essential for effective T-helper-cell responses. Nature. 2001 Jan 4;409(6816):105–109.
- Jones PA. Functions of DNA methylation: islands, start sites, gene bodies and beyond. Nat Rev Genet. 2012 May 29;13(7):484–492.
- Taby R, Issa JP. Cancer epigenetics. CA Cancer J Clin. 2010 Nov-Dec;60(6):376–392. Epub 2010 Oct 19.
- Schmidl C, Delacher M, Huehn J, et al. Epigenetic mechanisms regulating T-cell responses. J Allergy Clin Immunol. 2018 Sep;142(3):728–743.
- Ghoneim HE, Zamora AE, Thomas PG, et al. Cell-Intrinsic Barriers of T Cell-Based Immunotherapy. Trends Mol Med. 2016 Dec;22(12):1000–1011.
- Gevensleben H, Holmes EE, Goltz D, et al. PD-L1 promoter methylation is a prognostic biomarker for biochemical recurrence-free survival in prostate cancer patients following radical prostatectomy. Oncotarget. 2016 Nov 29;7(48):79943–79955.
- Goltz D, Gevensleben H, Dietrich J, et al. Promoter methylation of the immune checkpoint receptor PD-1 (PDCD1) is an independent prognostic biomarker for biochemical recurrence-free survival in prostate cancer patients following radical prostatectomy. Oncoimmunology. 2016 Sep 2;5(10):e1221555.
- Micevic G, Thakral D, McGeary M, et al. PD-L1 methylation regulates PD-L1 expression and is associated with melanoma survival. Pigment Cell Melanoma Res. 2019 May;32(3):435–440.
- Goltz D, Gevensleben H, Dietrich J, et al. PDCD1 (PD-1) promoter methylation predicts outcome in head and neck squamous cell carcinoma patients. Oncotarget. 2017 Jun 20;8(25):41011–41020.
- Goltz D, Gevensleben H, Dietrich J, et al. PD-L1 (CD274) promoter methylation predicts survival in colorectal cancer patients. Oncoimmunology. 2016 Nov 10;6(1):e1257454.
- Keenan TE, Burke KP, Van Allen EM. Genomic correlates of response to immune checkpoint blockade. Nat Med. 2019 Mar;25(3):389–402.
- Gibney GT, Weiner LM, Atkins MB. Predictive biomarkers for checkpoint inhibitor-based immunotherapy. Lancet Oncol. 2016 Dec;17(12):e542–e551.
- Topalian SL, Taube JM, Anders RA, et al. Mechanism-driven biomarkers to guide immune checkpoint blockade in cancer therapy. Nat Rev Cancer. 2016 May;16(5):275–287.
- Ayers M, Lunceford J, Nebozhyn M, et al. IFN-γ-related mRNA profile predicts clinical response to PD-1 blockade. J Clin Invest. 2017 Aug 1;127(8):2930–2940.
- Thorsson V, Gibbs DL, Brown SD, et al. The Immune Landscape of Cancer. Immunity. 2018 Apr 17;48(4):812–830.e14.
- Havel JJ, Chowell D, Chan TA. The evolving landscape of biomarkers for checkpoint inhibitor immunotherapy. Nat Rev Cancer. 2019 Mar;19(3):133–150.
- Goltz D, Gevensleben H, Vogt TJ, et al. CTLA4 methylation predicts response to anti-PD-1 and anti-CTLA-4 immunotherapy in melanoma patients. JCI Insight. 2018 Jul 12;3(13):96793.
- Dietrich D, Lesche R, Tetzner R, et al. Analysis of DNA methylation of multiple genes in microdissected cells from formalin-fixed and paraffin-embedded tissues. J Histochem Cytochem. 2009 May;57(5):477–489.
- Dietrich D, Hasinger O, Bañez LL, et al. Development and clinical validation of a real-time PCR assay for PITX2 DNA methylation to predict prostate-specific antigen recurrence in prostate cancer patients following radical prostatectomy. J Mol Diagn. 2013 Mar;15(2):270–279.
- Amatore F, Gorvel L, Olive D. Inducible Co-Stimulator (ICOS) as a potential therapeutic target for anti-cancer therapy. Expert Opin Ther Targets. 2018 Apr;22(4):343–351.
- Fu T, He Q, Sharma P. The ICOS/ICOSL pathway is required for optimal antitumor responses mediated by anti-CTLA-4 therapy. Cancer Res. 2011 Aug 15;71(16):5445–5454.
- Ng Tang D, Shen Y, Sun J, et al. Increased frequency of ICOS+ CD4 T cells as a pharmacodynamic biomarker for anti-CTLA-4 therapy. Cancer Immunol Res. 2013 Oct;1(4):229–234.
- Di Giacomo AM, Calabrò L, Danielli R, et al. Long-term survival and immunological parameters in metastatic melanoma patients who responded to ipilimumab 10 mg/kg within an expanded access programme. Cancer Immunol Immunother. 2013 Jun;62(6):1021–1028.
- Haile ST, Bosch JJ, Agu NI, et al. Tumor cell programmed death ligand 1-mediated T cell suppression is overcome by coexpression of CD80. J Immunol. 2011 Jun 15;186(12):6822–6829.
- Haile ST, Dalal SP, Clements V, et al. Soluble CD80 restores T cell activation and overcomes tumor cell programmed death ligand 1-mediated immune suppression. J Immunol. 2013 Sep 1;191(5):2829–2836.
- Tirapu I, Huarte E, Guiducci C, et al. Low surface expression of B7-1 (CD80) is an immunoescape mechanism of colon carcinoma. Cancer Res. 2006 Feb 15;66(4):2442–2450.
- Foreman KE, Wrone-Smith T, Krueger AE, et al. Expression of costimulatory molecules CD80 and/or CD86 by a Kaposi’s sarcoma tumor cell line induces differential T-cell activation and proliferation. Clin Immunol. 1999 Jun;91(3):345–353.
- Singh NP, Yolcu ES, Taylor DD, et al. A novel approach to cancer immunotherapy: tumor cells decorated with CD80 generate effective antitumor immunity. Cancer Res. 2003 Jul 15;63(14):4067–4073.
- Mandal R, Şenbabaoğlu Y, Desrichard A, et al. The head and neck cancer immune landscape and its immunotherapeutic implications. JCI Insight. 2016 Oct 20;1(17):e89829.
- de Ruiter EJ, Ooft ML, Devriese LA, et al. The prognostic role of tumor infiltrating T-lymphocytes in squamous cell carcinoma of the head and neck: A systematic review and meta-analysis. Oncoimmunology. 2017 Aug 9;6(11):e1356148.
- Sailer V, Sailer U, Bawden EG, et al. DNA methylation of indoleamine 2,3-dioxygenase 1 (IDO1) in head and neck squamous cell carcinomas correlates with IDO1 expression, HPV status, patients’ survival, immune cell infiltrates, mutational load, and interferon γ signature. EBioMedicine. 2019Oct;48:341–352.
- Salvi S, Fontana V, Boccardo S, et al. Evaluation of CTLA-4 expression and relevance as a novel prognostic factor in patients with non-small cell lung cancer. Cancer Immunol Immunother. 2012 Sep;61(9):1463–1472.
- Huang PY, Guo SS, Zhang Y, et al. Tumor CTLA-4 overexpression predicts poor survival in patients with nasopharyngeal carcinoma. Oncotarget. 2016 Mar 15;7(11):13060–13068.
- Santoni G, Amantini C, Morelli MB, et al. High CTLA-4 expression correlates with poor prognosis in thymoma patients. Oncotarget. 2018 Mar 30;9(24):16665–16677.
- Zhang Y, Luo Y, Qin SL, et al. The clinical impact of ICOS signal in colorectal cancer patients. Oncoimmunology. 2016 Mar 10;5(5):e1141857.
- Faget J, Sisirak V, Blay JY, et al. ICOS is associated with poor prognosis in breast cancer as it promotes the amplification of immunosuppressive CD4+ T cells by plasmacytoid dendritic cells. Oncoimmunology. 2013 Mar 1;2(3):e23185.
- Giraldo NA, Becht E, Vano Y, et al. Tumor-Infiltrating and Peripheral Blood T-cell Immunophenotypes Predict Early Relapse in Localized Clear Cell Renal Cell Carcinoma. Clin Cancer Res. 2017 Aug 1;23(15):4416–4428.
- Rincon-Orozco B, Halec G, Rosenberger S, et al. Epigenetic silencing of interferon-kappa in human papillomavirus type 16-positive cells. Cancer Res. 2009 Nov 15;69(22):8718–8725.
- Reiser J, Hurst J, Voges M, et al. High-risk human papillomaviruses repress constitutive kappa interferon transcription via E6 to prevent pathogen recognition receptor and antiviral-gene expression. J Virol. 2011 Nov;85(21):11372–11380.
- Cicchini L, Blumhagen RZ, Westrich JA, et al. High-Risk Human Papillomavirus E7 Alters Host DNA Methylome and Represses HLA-E Expression in Human Keratinocytes. Sci Rep. 2017 Jun 16;7(1):3633.
- Cicchini L, Westrich JA, Xu T, et al. Suppression of antitumor immune responses by human papillomavirus through epigenetic downregulation of CXCL14. MBio. 2016 May 3;7(3):e00270–16.
- Kuss-Duerkop SK, Westrich JA, Pyeon D. DNA tumor virus regulation of host dna methylation and its implications for immune evasion and oncogenesis. Viruses. 2018 Feb 13;10(2):E82.
- Minarovits J, Demcsák A, Banati F, et al. Epigenetic Dysregulation in Virus-Associated Neoplasms. Adv Exp Med Biol. 2016;879:71–90.
- Chen B, Khodadoust MS, Liu CL, et al. Profiling Tumor Infiltrating Immune Cells with CIBERSORT. Methods Mol Biol. 2018;1711:243–259.
- Iorio F, Knijnenburg TA, Vis DJ, et al. A landscape of pharmacogenomic Interactions in cancer. Cell. 2016 Jul 28;166(3):740–754.
- Lechner M, Fenton T, West J, et al. Identification and functional validation of HPV-mediated hypermethylation in head and neck squamous cell carcinoma. Genome Med. 2013 Feb 5;5(2):15.
- Li B, Dewey CN. RSEM: accurate transcript quantification from RNA-Seq data with or without a reference genome. BMC Bioinformatics. 2011 Aug 4;12: 323.