
ABSTRACT
In addition to multi-nucleated muscle fibres, numerous resident and infiltrating mononuclear cells populate the muscle compartment. As most epigenetic assays in skeletal muscle are conducted on whole tissue homogenates, essentially nothing is known about regulatory processes exclusively within muscle fibres in vivo. Utilizing a novel genetically modified mouse model developed by our laboratory, we (1) outline a simple and rapid workflow for isolating pure myonuclei from small tissue samples via fluorescent activated cell sorting and extracting high-quality large-fragment DNA for downstream analyses, and (2) provide information on myonuclear and interstitial cell nuclear CpG DNA methylation via reduced representation bisulphite sequencing (RRBS) using mice that were subjected to an acute mechanical overload of the plantaris muscle. In 3-month-old mice, myonuclei are ~50% of total nuclei in sham and ~30% in 3-d overloaded muscle, the difference being attributable to mononuclear cell infiltration and proliferation with overload. In purified myonuclei, pathway analysis of hypomethylated promoter regions following overload was distinct from interstitial nuclei and revealed marked regulation of factors that converge on the master regulator of muscle growth mTOR, and on autophagy. Specifically, acute hypomethylation of Rheb, Rictor, Hdac1, and Hdac2, in addition to a major driver of ribosome biogenesis Myc, reveals the epigenetic regulation of hypertrophic signalling within muscle fibres that may underpin the long-term growth response to loading. This study provides foundational information on global myonuclear epigenetics in vivo using RRBS, and demonstrates the importance of isolating specific nuclear populations to study the epigenetic regulation of skeletal muscle fibre adaptation.
Introduction
Muscle fibres are multi-nucleated and comprise the majority of whole muscle tissue volume, but various resident and infiltrating mononuclear cells also populate the muscle compartment including interstitial muscle stem cells (e.g., satellite cells), endothelial cells, fibrogenic cells, and macrophages, among others [Citation1,Citation2]. From a technical perspective, the cellular heterogeneity of muscle tissue and syncytial nature of fibres makes it difficult to determine the internal molecular machinery regulating muscle cell size in vivo. Nearly all the data at any level of regulation in muscle in vivo (epigenetic, mRNA, or protein) come from homogenized whole tissue samples that contain all resident/infiltrating cell types as well as blood, which confounds the interpretation of muscle fibre contributions [Citation3]. When molecular assays are carried out on isolated muscle fibres [Citation4–7], various adherent cells may contaminate the preparation, even if precautions are taken to remove these cells [Citation8]. Furthermore, the proportion of myonuclei versus interstitial non-myonuclei may shift due to mononuclear cell proliferation and infiltration after various perturbations (e.g., injury or exercise), further obscuring our understanding of regulatory processes specific to the muscle fibre. Collectively, our understanding of the factors mediating muscle mass specifically within muscle fibres in vivo is limited.
DNA methylation is an epigenetic modification that is a crucial regulator of gene expression. Methylation at CpG sites influences gene transcription and ultimately cell phenotype [Citation9]; in broad terms, promoter and first exon demethylation enhance gene expression [Citation10,Citation11], while gene body hypermethylation downstream of transcription start sites is complex but usually positively correlates with gene expression levels and splicing [Citation12,Citation13]. In humans, acute resistance exercise modifies the DNA methylome in homogenized skeletal muscle samples [Citation14–16], but the methylation events specific to the muscle fibre are not clear. To study the epigenetic landscape following acute loading stress exclusively within muscle fibres, we employed a novel genetically modified mouse model developed by our laboratory which allows for highly specific, inducible, and temporally mediated fluorescent labelling of myonuclei [Citation17]. After creating a simple and rapid workflow for purifying myonuclei via fluorescent activated cell sorting (FACS), we exposed mice with labelled myonuclei to 3 d of synergist ablation mechanica overload, which is well established as a method for inducing pronounced skeletal muscle adaptation and ultimately hypertrophy [Citation18–20]. We then analysed high-quality large-fragment DNA from purified myonuclei as well as interstitial cell nuclei (a combination of all non-myonuclei generally comprised of satellite, endothelial, fibrogenic, and immune cell nuclei among others) via reduced representation bisulphite sequencing (RRBS) to create a portrait of the DNA methylation landscape in skeletal muscle during acute skeletal muscle remodelling.
Results
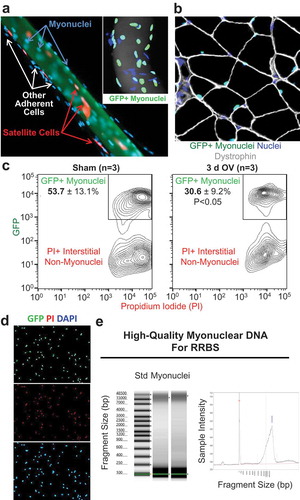
To illustrate how manually isolating muscle fibres can result in adherent cell contamination that may affect downstream molecular analyses, we utilized a genetically modified mouse model to fluorescently label satellite cells in vivo [Citation21]. We euthanized the mouse following labelling, harvested a plantaris muscle, fixed it at resting length as previously described by our laboratory [Citation22,Citation23], then teased apart individual fibres using a light microscope and fine tweezers [Citation4]. Satellite cells can remain attached to individual muscle fibres isolated with this method (), which is consistent with what has been reported using an enzymatic digestion procedure before downstream molecular analyses [Citation8]. Furthermore, we observed that other interstitial cells may decorate individual muscle fibres after manual dissection ( and 1a inset), further emphasizing the importance of myonuclear-specific isolation techniques to provide a more accurate picture of skeletal muscle fibre epigenetic regulation. We, therefore, turned to our recently described mouse model for genetically labelling myonuclei in vivo [Citation17]. This model utilizes a human skeletal actin promoter (HSA) driving expression of a reverse tetracycline transactivator (rtTA) that, only in the presence of doxycycline, allows for activation of a tetracycline response element that regulates transcription of a histone 2B-green fluorescent fusion protein (TetO-H2BGFP); we call this mouse HSA-GFP onward. GFP is specifically localized to myonuclei (), with myonuclear labelling efficiency >95% and <2% off-target labelling, as previously reported [Citation17].
Figure 1. Workflow for isolating myonuclei from HSA-GFP mice (a) Example of a manually isolated muscle fibre from the plantaris muscle of a Pax7-tdT mouse that illustrates satellite cells (tdT, red) and adherent mononuclear cells (DAPI, blue) decorating the cell (phalloidin, green). The inset shows a manually dissected muscle fibre from the plantaris muscle of an HSA-GFP mouse where myonuclei fluoresce green (GFP+/DAPI+), and adherent cells are labelled blue (DAPI+/GFP-) (b) Immunohistochemical analysis of a cross-section from an HSA-GFP plantaris showing GFP+ myonuclei (green) within muscle fibre borders (dystrophin, grey), and interstitial non-myonuclei located outside of dystrophin (blue) (c) FACS data from sham and 3-d overload HSA-GFP plantaris muscles (n = 3 per group, *p < 0.05) (d) GFP+ myonuclei from an HSA-GFP plantaris that were mounted on a slide using a Cytospin, co-labelled using DNA stains PI (red) and DAPI (blue), and imaged on a fluorescent microscope (e) DNA quality control analysis showing large-fragment DNA suitable for reduced representation bisulphite sequencing (RRBS)
More than 14,000 CpG sites were differentially methylated (DM) in myonuclei following overload (p < 0.05, ≥5x coverage, and >10% DM); 11,210 sites were hypomethylated and 3,491 sites were hypermethylated (). Thus, we infer that CpG sites mapped in myonuclei from overloaded muscles were predominantly demethylated. Of the top 3,000 DM CpG sites in myonuclei between sham and 3-d overload (n = 2 sham and 3 overload, p ≤ 0.023 at 14x coverage on average, and ≥38% DM), 655 were hypomethylated sites in promoters (22%) and 84 were hypermethylated (3%). Of DM sites in gene bodies (i.e., non-promoter regions, intragenic), 1,157 were hypomethylated (39%, 464 exonic, 693 intronic) and 665 were hypermethylated (22%, 244 exonic, 421 intronic). Of the top 3,000 DM sites, 704 were located in CpG islands (24%), and 439 were not annotated (15%); these un-annotated sites are generally located between promoter regions and transcription start sites, meaning they are likely enhancers. The marked differences in methylation between sham and 3-d overload are illustrated by the heatmap in .
Figure 2. Myonuclear CpG methylation analysis (a) Scatterplot showing all differentially methylated (DM) sites in sham versus 3-d overloaded mice (b) Heatmap showing marked differences in global myonuclear methylation between sham (n = 2) and 3-d overloaded plantaris muscles (n = 3, p < 0.05); blue is hypomethylated and red is hypermethylated (c) Pathway analysis of hypomethylated promoters after 3 d of overload, organized in ascending p-value order from top to bottom (all p < 0.05, top 10 pathways) (d) Promoter CpG methylation levels of genes found in PTEN, PIP3, and p53 pathways, *p < 0.05. Note: Hdac2, Xiap, Uba52, and Cdk13 had two distinct methylation sites (e) Elevated expression of genes in 3-d overloaded C57BL/6J mice that relates to myonuclear CpG methylation of genes in the PTEN, PIP3, and p53 pathways, *p < 0.05
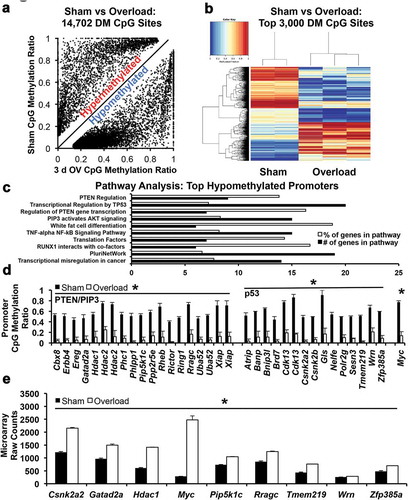
Pathway analysis on myonuclear DM promoter regions revealed robust CpG hypomethylation of phosphatase and tensin homologue (PTEN), phosphatidylinositol triphosphate (PIP3), and TP53 (p53) pathways (). Although PTEN, PIP3, and p53 genes themselves were not DM, constituents of these pathways influence mechanistic target of rapamycin (mTOR), a master regulator of skeletal muscle growth [Citation24,Citation25], and autophagy, a key process in cellular quality control [Citation26–29]. Specifically, the promoter regions of Casein kinase 2 beta (Csnk2b), Erb-b2 receptor tyrosine kinase 4 (Erbb4), Histone deacetylase 1 and 2 (Hdac1 and Hdac2), Ras homolog mTORC 1 binding (Rheb), and Rapamycin-insensitive companion of mTOR (Rictor), along with others implicated in growth were significantly hypomethylated after overload (p < 0.05, ). Furthermore, Myc, a master regulator of ribosome biogenesis that increases translational capacity during muscle hypertrophy [Citation30–33], was also hypomethylated. The majority of promoter hypomethylation events in these pathways were located in CpG islands (23 of 31). Pathway analysis of the top genes hypermethylated promoters only showed 2–3 genes per pathway, but the primary process was related to apoptosis. The complete list of the top genes hypo- and hypermethylated promoter regions in myonuclei following overload is in Supplemental Table 1. Utilizing a more stringent cut-off for significance (p < 0.01), we still observe many of the same DM sites in genes within the aforementioned pathways, including Csnk2b, Hdac2, Rictor, and Myc (Supplemental Table 2).
The majority of DM CpG sites in myonuclei in the top 3000 list were located within gene bodies (exons and introns). Methylation within the gene bodies can have varied effects, such as increasing or decreasing gene expression, influencing splicing, regulating alternative promoters, altering chromatin structure, and/or preventing spurious transcription initiation, among other functions [Citation9,Citation34–38]. With these complexities in mind, we conducted pathway analysis on the top genes hypo-and hypermethylated intragenic CpG sites following overload. The major distinct pathways with hypomethylation in intragenic regions were MAP kinase and WNT signalling, and by hypermethylation were Developmental Biology, Axon Guidance, NCAM Signalling, and ECM Organization (p < 0.05). The list of the top genes hypo- and hypermethylated gene body CpG sites is found in Supplemental Table 3. Complete pathway overrepresentation analyses for myonuclear promoter and intragenic methylation are found in Supplemental Table 4.
To provide insight into the interstitial cell nuclear methylation landscape with overload, we pooled PI+/GFP-nuclei from sham (n = 3) and overloaded muscles (n = 3) into two samples for RRBS (n = 1 sham and n = 1 overload). More than 36,000 CpG sites were DM in sham versus overloaded interstitial cell nuclei (p < 0.05, Fisher’s exact test); 12,216 sites were hypomethylated and 24,649 were hypermethylated. While not a statistical comparison, of the 260 genes with DM promoters within the top 3,000 CpG sites in sham versus overloaded interstitial cell nuclei (136 hypomethylated and 124 hypermethylated, p < 0.05), 18 overlapped (i.e., were in the same gene) in myonuclei (9%). Of the 1,403 differentially methylated intragenic regions in interstitial nuclei, 261 overlapped in myonuclei (19%). Pathway analysis of genes with hypomethylated promoters revealed adipocytokine signalling, while hypermethylation was associated with phospholipid metabolism. Distinct methylation patterns in interstitial cell nuclei versus myonuclei illustrate the potential contribution of non-myonuclei to whole muscle methylation patterns. The lists of the top genes with DM promoter and intragenic regions in interstitial nuclei are found in Supplemental Tables 5 and 6.
To evaluate the relationship between myonuclear CpG DNA methylation patterns and whole muscle gene expression between sham and 3-d overloaded mice, we utilized a sham and 3-d overload microarray dataset from C57BL/6J mice published previously by our laboratory [Citation39]. We reasoned that if a myonuclear DNA promoter was hypomethylated after 3 d of overload, this could present as elevated expression of that gene in a whole muscle at that same time point. Of the top 614 genes with hypomethylated promoters after overload in myonuclei, expression was elevated for 148 of those genes (24%). Of the 73 genes with hypermethylated promoters, 14 had lower gene expression (19%). The same analysis in interstitial cell nuclei revealed a similar pattern; 18% agreement with gene expression for hypomethylated and 20% for hypermethylated promoters. With the limitation that the gene expression data came from muscle homogenates in different mice, these relationships suggest that there is somewhat modest agreement between myonuclear promoter DNA methylation and gene expression from a numerical standpoint in skeletal muscle at this time point in response to acute overload. On balance, many CpG methylation events were at a single site in a gene promoter region, so any agreement between methylation and gene expression is noteworthy. To this point, a single promoter CpG site is indeed capable of controlling transcription factor binding and gene expression [Citation40,Citation41]. To determine whether an increase in gene expression was delayed following myonuclear hypomethylation during adaptation, we compared myonuclear promoter methylation after 3 d of overload to the whole muscle transcriptional profile reported at 5 d of overload [Citation39]. Elevated transcription of 146 genes overlapped with hypomethylated promoters for those genes (24%), suggesting that delayed timing may not be the explanation for transcriptional uncoupling. The lists of genes with DM promoters and gene expression that differed in the same direction (up for hypomethylation and down for hypermethylation with overload) can be found in Supplemental Table 7. Of the 31 genes that showed myonuclear promoter hypomethylation in PTEN, PIP3, and p53 pathways (see above), Csnk2a2, Gatad2a, Hdac1, Myc, Pip5k1 c, Rragc, Tmem219, Wrn, and Zfp385a had elevated gene expression in 3-d overloaded C57BL/6J mice (p < 0.05, ).
Discussion
The current investigation is the first to provide information on the myonuclear methylome and how it changes in response to an acute hypertrophic stimulus. Pathway analysis of DM sites derived via RRBS suggests that 3 d of overload strongly demethylates promoters of mTOR and autophagy-related genes specifically in myonuclei, while Myc hypomethylation may influence ribosome biogenesis. The 23% lower proportion of myonuclei after overload is likely the result of mononuclear cell proliferation and infiltration, and emphasizes the importance of nuclear-specific epigenetic analyses in skeletal muscle during times of dynamic remodelling, as does the distinct methylation pattern observed in interstitial cell nuclei.
CpG hypermethylation of gene promoter regions silences gene transcription, whereas hypomethylation enhances it [Citation9,Citation11]. Since this function of methylation is well characterized, we focused on pathway analysis of genes with DM promoter CpG methylation throughout the genome using RRBS. Our approach provides a global picture of the myonuclear methylation landscape in response to an acute hypertrophic stimulus. Of the top 3,000 DM sites in the myonuclear genome following mechanical overload, 23% were in promoter regions, and of those promoter CpG sites, 89% were hypomethylated. Widespread promoter hypomethylation in myonuclei after 3 d of overload in mice is congruent with the acute and chronic methylation response to exercise reported in human muscle biopsy samples [Citation16,Citation42–45], as is the relative uncoupling of promoter methylation and gene expression early after exercise [Citation16,Citation45,Citation46]; however, the specific methylation signature we report here in myonuclei is unique. Since the relationship between myonuclear promoter methylation status and whole muscle transcription does not converge by 5 d of overload, we speculate that acute myonuclear methylation could signify a ‘primed’ state of transcriptional readiness [Citation47,Citation48] that underpins enhanced molecular responsiveness to chronic stimulation, thereby supporting long-term hypertrophic adaptation [Citation16]. A primed methylation state in myonuclear DNA promoters may also have meaning in light of the daily oscillatory expression of circadian-controlled genes in skeletal muscle [Citation40], given recent advances in our understanding of this area [Citation49–51], specifically as it relates to exercise [Citation52–54]. Future experiments involving myonuclear RNA coupled with DNA methylation profiling over a protracted time course may help address the aforementioned possibilities.
The mTOR signalling pathway is considered a master governor of skeletal muscle hypertrophy in response to mechanical loading [Citation24,Citation25,Citation55]. In alignment with the central importance of this signalling cascade for growth, we found that promoter regions in genes that encode mTOR activators after 3 d of overload were hypomethylated in myonuclei, suggesting an increased likelihood of transcription. Specifically, hypomethylation of Rheb and Rictor as well as Erbb4 could ultimately facilitate mTOR activity [Citation25,Citation56–59] and contribute to muscle growth. In human biopsy samples obtained after acute resistance exercise, promoter hypomethylation broadly associates with ‘cancer’ pathways [Citation45], which are fundamentally growth pathways that involve mTOR signalling, and our murine data provide more detailed and comprehensive information on these specific processes at the myonuclear level. Furthermore, mTOR is known to regulate ribosome biogenesis [Citation60–62], which is emerging as a key facet of the hypertrophic response to loading [Citation20,Citation30–33]. Hypomethylation of Myc may also facilitate a robust induction of ribosome biogenesis [Citation63,Citation64].
In addition to mTOR signalling, genes in the p53 pathway were differentially methylated, which points to autophagy regulation [Citation65]. Promoter regions of the chromatin-modifying enzymes Hdac1 and Hdac2 as well as Csnk2b were hypomethylated after overload, and all are implicated in skeletal muscle autophagy [Citation26,Citation66,Citation67]. Specifically, Hdac1/2 [Citation28] and Csnk2b [Citation26] directly regulate skeletal muscle autophagic flux and mitophagy, respectively, and protein turnover via autophagy is an integral process for skeletal muscle mass maintenance [Citation68–70]. Although autophagy is generally inhibited by mTOR activation via Ulk1 [Citation71], it can also occur independently from mTOR during exercise [Citation72]. Autophagy is perhaps activated in a temporal fashion that complements mTOR signalling, promotes amino acid availability for anabolism, and facilitates proper protein turnover during muscle adaptation [Citation73]. Finally, some evidence indicates that gene body methylation is positively associated with active transcription or may serve to enhance transcription [Citation9,Citation74]. As such, gene body hypomethylation of MAPK pathway constituents simultaneous with hypomethylation of promoters that affect mTOR activation could represent pathway integration cross-talk [Citation75], helping to ensure successful hypertrophic adaptation to overload.
Our approach for studying myonuclear epigenetics as well as the data presented herein will serve as a guide for future epigenetic research in skeletal muscle, specifically as it relates to the potentially long-lasting cellular ‘muscle memory’ effects of exercise [Citation16,Citation22,Citation45,Citation76,Citation77]. Evidence for the epigenetic regulation of mTOR and autophagy via promoter methylation opens the door for exploration into new epigenetic therapeutic strategies directed towards promoting gains in skeletal muscle mass.
Methods/Materials
Ethical Approval All animal procedures were approved by the IACUC of the University of Kentucky. Mice were housed in a temperature and humidity-controlled room, maintained on a 14:10-h light-dark cycle, and food and water were provided ad libitum throughout the study. Animals were sacrificed via a lethal dosage of sodium pentobarbital injected intraperitoneally, followed by cervical dislocation.
Experimental Design Female HSA+/–GFP+/– mice were generated by crossing homozygous human skeletal actin reverse tetracycline transactivator (HSA-rtTA) mice generated by our laboratory [Citation17] with homozygous Tetracycline response element histone 2B green fluorescent protein mice (TetO-H2B-GFP) obtained from the Jackson Laboratory (005104, bred to homozygosity by our laboratory) [Citation78]. All mice used for experiments were ~3 months of age at the time of surgery. Mice were treated with doxycycline in drinking water (0.5 mg/ml with 2% sucrose) as previously described for 1 week, which results in 90–95% labelling of myonuclei in the plantaris muscle and negligible off-target labelling of non-myonuclei [Citation17]. Following doxycycline treatment, mice were allowed a 6-d washout, underwent sham surgery or synergist ablation overload of the plantaris as described previously [Citation20], then were euthanized 3 d later. Briefly, synergist ablation overload of the plantaris involves careful removal of ~50% of the gastrocnemius/soleus complex while under anaesthesia, followed by ambulatory cage behaviour for 3 d. Sham surgery involved all the same steps as synergist ablation, only without the removal of any muscle. In order to generate a mouse with fluorescent satellite cells, a Pax7CreERT2+-tdTomatofl/- (Pax7-tdT) mouse was generated by crossing a Pax7CreERT2 mouse with an R26LSL-tdTomato mouse (007909, Jackson Laboratory). Recombination of the stop cassette in front of tdT in vivo was accomplished via intraperitoneal injection of tamoxifen, as previously described [Citation21].
Fluorescent Activated Cell Sorting (FACS) to Purify Myonuclei After euthanization via lethal pentobarbital administration, plantaris muscles were harvested and processed according to the modified procedure of Okada et al. [Citation79]. Our pilot experiments revealed that skeletal muscle homogenization via manual Dounce as opposed to using a powered wand homogenizer produced higher DNA yield (data not shown). Thus, we proceeded with a manual Dounce homogenizer for all experiments. Plantaris muscles were harvested and placed in a homogenization buffer containing 5 mM PIPES, 85 mM KCl, 1 mM CaCl2, and 5% sucrose supplemented with 2x protease inhibitors and 0.25% NP-40 prepared in ddH2O; after the addition of PIPES to ddH2O during the first step, the solution was titrated to a pH of 7.2 before the addition of the remaining chemicals. The tissue was minced in 1 ml of buffer into very small pieces using scissors, then transferred to the Dounce homogenizer where nuclei where liberated using 15 strokes. The muscle suspension was diluted in 10–15 ml of buffer, and then this volume was passed through a 70 µm filter atop a 50 ml conical tube. The crude nuclear suspension was further diluted with an additional 5 ml of buffer, passed through a 40 µm filter, then centrifuged for 5 min at 3,000 RPM at 4°C with a swinging-bucket rotor. The supernatant was then aspirated, the crude nuclear pellet was re-suspended in 2 ml of buffer that did not contain NP-40, and transferred to a FACS tube. The entire procedure takes 20–30 min per sample and can be completed in batches.
The crude nuclear suspension was spiked with 4 µl of propidium iodide (PI, 1 mg/ml stock), and then subjected to FACS analysis. To prevent nuclear membrane rupture, we sorted with low pressure (15 PSI) using a 100 µm nozzle on a Sony iCyt Cell Sorter System. Muscle from a control mouse (sucrose-only treated HSA-GFP) was used to determine background fluorescence (not shown), and myonuclei were classified as GFP+/PI+ after elimination of doublets via forward scatter area versus height, and were collected in 15 ml conical tubes in buffer without NP-40. GFP-/PI+ nuclei from sham (n = 3) and overload (n = 3) were collected in a single tube per condition. An aliquot of myonuclei was mounted on charged slides using a Cytospin, cover-slipped with DAPI, and imaged on a Zeiss Axioimager M1 fluorescent microscope at 20x (see ). Myonuclear suspensions were pelleted at 500 x g for 5 min using a swinging bucket rotor.
Myonuclear DNA Isolation DNA isolation was carried out according to the detailed protocol of Begue et al. with minimal modification [Citation4]. Briefly, using the QIAamp DNA micro kit (Qiagen), myonuclear pellets were re-suspended in ‘buffer ATL’ supplemented with proteinase K overnight at 56°C. DNA binding to the column was conducted using 1 µg of carrier RNA, and washes and centrifugations were carried out according to the manufacturer’s instructions. DNA was eluted in 20 µl of molecular grade H2O, and was stored at −80°C until the time of analysis.
Myonuclear Reduced Representation Bisulphite Sequencing (RRBS) DNA quality assessment and RRBS were conducted in collaboration with Zymo Research. Quality and concentration were assessed using a Fragment Analyser (AATI), and an average DNA fragment size was generally >40,000 bp. ‘Classic’ RRBS library preparation was performed by digesting 5 ng of genomic DNA with 30 units of MspI enzyme (New England BioLabs), and fragments were ligated to pre-annealed adapters containing 5ʹ-methyl-cytosine. Adapter-ligated fragments ≥50 bp were recovered using the DNA Clean & Concentrator Kit (Zymo Research, D4003) and bisulphite-treated using the EZ DNA Methylation-Lightning Kit (Zymo Research, D5030). Preparative-scale PCR was performed and the products were purified again using the Clean and Concentrator kit. Paired-end sequencing was performed on an Illumina HiSeq, and sequence reads from bisulphite-treated libraries were identified using standard Illumina base-calling software. Raw FASTQ files were adapter, filled-in nucleotides, and quality-trimmed using TrimGalore 0.6.4. FastQC 0.11.8 was used to assess the effect of trimming and the overall quality of the data. Alignment to the mm10 reference genome was performed using Bismark 0.19.0, and methylated and unmethylated read totals for each CpG site were collected using the Methylation Extractor tool. The methylation level of each sampled cytosine was estimated as the number of reads reporting a ‘C’, divided by the total number of reads reporting a ‘C’ or ‘T’. The raw data were deposited in the NCBI Gene Expression Omnibus database (GSE144774).
Microarray Analysis of Gene Expression in the Plantaris Muscle We utilized a publicly available microarray dataset previously published by our laboratory that included sham, 3-d overload, and 5-d overload time points for comparison to myonuclear RRBS data [Citation39]. Briefly, male C57BL/6J was subjected to sham, 3-d, or 5-d overload surgery (n = 6 per group). RNA from right and left plantaris muscles from mice in each group were pooled (two pools per time point), and microarrays were conducted at the University of Kentucky Microarray Core Facility using Affymetrix mouse gene 1.0 ST chips.
Single Muscle Fibre Isolation and Immunohistochemistry (IHC) For single muscle fibre analysis, whole hindlimbs from a doxycycline-treated HSA-GFP and tamoxifen-treated Pax7-tdT mouse were fixed at a 90° angle for 48 h, as previously described by our laboratory [Citation19,Citation22,Citation23]. Plantaris muscles were harvested, and muscle fibres were manually dissected in PBS using a light microscope and fine tweezers [Citation4,Citation5]. Individual muscle fibres were transferred to a fresh tube containing PBS and incubated with phalloidin at 1:100 for 2 h in order to visualize F-actin within the muscle fibres (ThermoFisher A12379 or A12381). Single muscle fibres were mounted on glass slides using VectaShield with DAPI (Vector, H-1200), and visualized using 20x magnification Z-stacks on a Zeiss AxioImager microsocope. A plantaris muscle from a doxycycline-treated HSA-GFP mouse was prepared for IHC as previously described [Citation17]. Briefly, frozen muscle was sectioned, incubated in an antibody against dystrophin overnight (1:100, Abcam, ab15277), washed with PBS, incubated with the appropriate secondary antibody for 1 h at room temperature, then mounted using Vectashield with DAPI and imaged at 20x on a Zeiss microscope (Oberkochen, Germany). Quantification tools in the Zeiss Zen software were used to determine DAPI+ and GFP+ nuclei.
Statistics For FACS nuclear proportion data, unpaired t-tests were performed for sham (n = 3) versus overload (n = 3), and p was set at <0.05. For methylation data, an unpaired t-test was performed for sham (n = 2) versus overload (n = 3) on each CpG site that had at least 5x read coverage and a 10% difference in methylation value between groups. Differential methylation with p < 0.05 was classified as hyper- or hypo-methylated [Citation4]. For the top 3,000 DM sites across the five myonuclear samples, which are the data from which our primary conclusions were derived, average p-value was ≤0.023, average read coverage was 14x, and DM was ≥38%. Worth noting is that 37% of CpG sites mapped to promoter regions in myonuclear DNA were also mapped to exons, which is likely explained by splice variants of the given gene, or methylation of the first exon around the transcription start site that has a similar effect as promoter methylation [Citation10]; nevertheless, in instances where promoter and exonic methylation were mapped, we included it for pathway analysis in both locations. A Fisher’s exact test was used to detect differences in methylation between sham and overloaded interstitial cell nuclei with p < 0.05. Pathway analysis was carried out in ConcensusPathDB with a priori directional data in the overrepresentation feature, using KEGG, Wikipathway, and Reactome databases in the mouse module, with a list overlap of ‘2’ and p < 0.05. Raw counts from the two pools of plantaris RNA at each time point were used for analysis, and unpaired t-tests (sham versus 3-d overload and sham versus 5-d overload) were used to help discriminate genes that moved in an up or down direction to be collated with methylation data with p < 0.05. All data presented as mean ± standard error.
Supplemental Material
Download MS Excel (72.2 KB)Acknowledgments
The authors wish to thank Keith Booher, PhD, of Zymo Research for his technical assistance and timely management of this project, Jennifer Strange of the University of Kentucky Flow Cytometry Core for her expertise in FACS, Cory Dungan, PhD, for his thoughtful review of our manuscript, and the Ball State Human Performance Laboratory for publishing clear and detailed methods.
Disclosure statement
No potential conflict of interest was reported by the authors.
Supplementary material
Supplemental data for this article can be accessed here.
Additional information
Funding
References
- Murach KA, Fry CS, Kirby TJ, et al. Starring or supporting role? Satellite cells and skeletal muscle fiber size regulation. Physiology. 2018;33:26–38.
- Tedesco FS, Moyle LA, Perdiguero E. Muscle interstitial cells: a brief field guide to non-satellite cell populations in skeletal muscle. Muscle Stem Cells: Methods Protoc. Methods Mol Biology. 2017;1556:129–147.
- Lindholm ME, Marabita F, Gomez-Cabrero D, et al. An integrative analysis reveals coordinated reprogramming of the epigenome and the transcriptome in human skeletal muscle after training. Epigenetics. 2014;9:1557–1569.
- Begue G, Raue U, Jemiolo B, et al. DNA methylation assessment from human slow-and fast-twitch skeletal muscle fibers. J Appl Physiol. 2017;122:952–967.
- Murach KA, Raue U, Wilkerson BS, et al. Fiber type-specific gene expression with taper in competitive distance runners. PLoS One. 2014;9(9):e108547.
- Murgia M, Toniolo L, Nagaraj N, et al. Single muscle fiber proteomics reveals fiber-type-specific features of human muscle aging. Cell Rep. 2017;19:2396–2409.
- Raue U, Trappe TA, Estrem ST, et al. Transcriptome signature of resistance exercise adaptations: mixed muscle and fiber type specific profiles in young and old adults. J Appl Physiol. 2012;112:1625–1636.
- Blackburn DM, Lazure F, Corchado AH, et al. High-resolution genome-wide expression analysis of single myofibers using SMART-Seq. J Biol Chem. 2019;294:20097–20108.
- Jones PA. Functions of DNA methylation: islands, start sites, gene bodies and beyond. Nat Rev Genet. 2012;13:484.
- Brenet F, Moh M, Funk P, et al. DNA methylation of the first exon is tightly linked to transcriptional silencing. PloS One. 2011;6:e14524.
- Feinberg AP, Vogelstein B. Hypomethylation distinguishes genes of some human cancers from their normal counterparts. Nature. 1983;301:89.
- Bender CM, Gonzalgo ML, Gonzales FA, et al. Roles of cell division and gene transcription in the methylation of CpG islands. Mol Cell Biol. 1999;19:6690–6698.
- Yang X, Han H, De Carvalho DD, et al. Gene body methylation can alter gene expression and is a therapeutic target in cancer. Cancer Cell. 2014;26:577–590.
- Bagley JR, Burghardt KJ, McManus R, et al. Epigenetic responses to acute resistance exercise in trained vs. sedentary men. J Strength Cond Res. 2019. DOI:10.1519/JSC000000000000.3185,
- Seaborne R, Strauss J, Cocks M, et al. Methylome of human skeletal muscle after acute & chronic resistance exercise training, detraining & retraining. Sci Data. 2018;5:180213.
- Seaborne RA, Strauss J, Cocks M, et al. Human skeletal muscle possesses an epigenetic memory of hypertrophy. Sci Rep. 2018;8:1898.
- Iwata M, Englund DA, Wen Y, et al. A novel tetracycline-responsive transgenic mouse strain for skeletal muscle-specific gene expression. Skelet Muscle. 2018;8:33.
- Kirby TJ, McCarthy JJ, Peterson CA, et al. Synergist ablation as a rodent model to study satellite cell dynamics in adult skeletal muscle. Skeletal muscle regeneration in the mouse: methods and protocols. 2016; 43–52.
- Murach KA, White SH, Wen Y, et al. Differential requirement for satellite cells during overload-induced muscle hypertrophy in growing versus mature mice. Skelet Muscle. 2017;7:14.
- von Walden F, Casagrande V, Östlund Farrants A-K, et al. Mechanical loading induces the expression of a Pol I regulon at the onset of skeletal muscle hypertrophy. Am J Physiol Cell Physiol. 2012;302:C1523–C1530.
- Pawlikowski B, Pulliam C, Betta ND, et al. Pervasive satellite cell contribution to uninjured adult muscle fibers. Skelet Muscle. 2015;5:42.
- Dungan CM, Murach KA, Frick KK, et al. Elevated myonuclear density during skeletal muscle hypertrophy in response to training is reversed during detraining. Am J Physiol Cell Physiol. 2019;316:C649–C654.
- McCarthy JJ, Mula J, Miyazaki M, et al. Effective fiber hypertrophy in satellite cell-depleted skeletal muscle. Development. 2011;138:3657–3666.
- Bodine SC, Stitt TN, Gonzalez M, et al. Akt/mTOR pathway is a crucial regulator of skeletal muscle hypertrophy and can prevent muscle atrophy in vivo. Nat Cell Biol. 2001;3:1014.
- McCarthy JJ, Murach KA. Anabolic and catabolic signaling pathways that regulate skeletal muscle mass. In: Debasis Bagchi, Sreejayan Nair, & Chandan K Sen, editors. Nutrition and enhanced sports performance. London: Elsevier 2019. p. 275–290.
- Kravic B, Harbauer AB, Romanello V, et al. In mammalian skeletal muscle, phosphorylation of TOMM22 by protein kinase CSNK2/CK2 controls mitophagy. Autophagy. 2018;14:311–335.
- Mammucari C, Milan G, Romanello V, et al. FoxO3 controls autophagy in skeletal muscle in vivo. Cell Metab. 2007;6:458–471.
- Moresi V, Carrer M, Grueter CE, et al. Histone deacetylases 1 and 2 regulate autophagy flux and skeletal muscle homeostasis in mice. Proc Nat Acad Sci. 2012;109:1649–1654.
- Mukhopadhyay S, Panda PK, Sinha N, et al. Autophagy and apoptosis: where do they meet? Apoptosis. 2014;19:555–566.
- Figueiredo VC, McCarthy JJ. Regulation of ribosome biogenesis in skeletal muscle hypertrophy. Physiology. 2018;34:30–42.
- Nakada S, Ogasawara R, Kawada S, et al. Correlation between ribosome biogenesis and the magnitude of hypertrophy in overloaded skeletal muscle. PloS One. 2016;11:e0147284.
- von Walden F. Ribosome biogenesis in skeletal muscle: coordination of transcription and translation. J Appl Physiol. 2019;127(2):591–598.
- Wen Y, Alimov AP, McCarthy JJ. Ribosome biogenesis is necessary for skeletal muscle hypertrophy. Exerc Sport Sci Rev. 2016;44:110.
- Lorincz MC, Dickerson DR, Schmitt M, et al. Intragenic DNA methylation alters chromatin structure and elongation efficiency in mammalian cells. Nat Struct Mol Biol. 2004;11:1068.
- Maunakea AK, Chepelev I, Cui K, et al. Intragenic DNA methylation modulates alternative splicing by recruiting MeCP2 to promote exon recognition. Cell Res. 2013;23:1256.
- Maunakea AK, Nagarajan RP, Bilenky M, et al. Conserved role of intragenic DNA methylation in regulating alternative promoters. Nature. 2010;466:253.
- Neri F, Rapelli S, Krepelova A, et al. Intragenic DNA methylation prevents spurious transcription initiation. Nature. 2017;543:72.
- Rea M, Eckstein M, Eleazer R, et al. Genome-wide DNA methylation reprogramming in response to inorganic arsenic links inhibition of CTCF binding, DNMT expression and cellular transformation. Sci Rep. 2017;7:1–14.
- Chaillou T, Lee JD, England JH, et al. Time course of gene expression during mouse skeletal muscle hypertrophy. J Appl Physiol. 2013;115:1065–1074.
- Altıntaş A, Laker RC, Garde C, et al. Transcriptomic and epigenomics atlas of myotubes reveals insight into the circadian control of metabolism and development. Epigenomics. 2020. DOI:10.2217/epi-2019-0391,
- Santoro R, Grummt I. Molecular mechanisms mediating methylation-dependent silencing of ribosomal gene transcription. Mol Cell. 2001;8:719–725.
- Laker R, Garde C, Camera D, et al. Transcriptomic and epigenetic responses to short-term nutrient-exercise stress in humans. Sci Rep. 2017;7:1–12.
- Rowlands DS, Page RA, Sukala WR, et al. Multi-omic integrated networks connect DNA methylation and miRNA with skeletal muscle plasticity to chronic exercise in Type 2 diabetic obesity. Physiol Genomics. 2014;46:747–765.
- Sailani MR, Halling JF, Møller HD, et al. Lifelong physical activity is associated with promoter hypomethylation of genes involved in metabolism, myogenesis, contractile properties and oxidative stress resistance in aged human skeletal muscle. Sci Rep. 2019;9:1–11.
- Turner DC, Seaborne RA, Sharples AP. Comparative transcriptome and methylome analysis in human skeletal muscle anabolism, hypertrophy and epigenetic memory. Sci Rep. 2019;9:1–12.
- Barres R, Yan J, Egan B, et al. Acute exercise remodels promoter methylation in human skeletal muscle. Cell Metab. 2012;15:405–411.
- Hodges E, Molaro A, Dos Santos CO, et al. Directional DNA methylation changes and complex intermediate states accompany lineage specificity in the adult hematopoietic compartment. Mol Cell. 2011;44:17–28.
- Xie W, Ling T, Zhou Y, et al. The chromatin remodeling complex NuRD establishes the poised state of rRNA genes characterized by bivalent histone modifications and altered nucleosome positions. Proc Nat Acad Sci. 2012;109:8161–8166.
- Cedernaes J, Schönke M, Westholm JO, et al. Acute sleep loss results in tissue-specific alterations in genome-wide DNA methylation state and metabolic fuel utilization in humans. Sci Adv. 2018;4:eaar8590.
- Harfmann BD, Schroder EA, Esser KA. Circadian rhythms, the molecular clock, and skeletal muscle. J Biol Rhythms. 2015;30:84–94.
- McCarthy JJ, Andrews JL, McDearmon EL, et al. Identification of the circadian transcriptome in adult mouse skeletal muscle. Physiol Genomics. 2007;31:86–95.
- Gabriel BM, Zierath JR. Circadian rhythms and exercise—re-setting the clock in metabolic disease. Nat Rev Endocrinol. 2019;15:197–206.
- Schroder EA, Esser KA. Circadian rhythms, skeletal muscle molecular clocks and exercise. Exerc Sport Sci Rev. 2013;41:224–229.
- Wolff CA, Esser KA. Exercise timing and circadian rhythms. Curr Opin Physiol. 2019;10:64–69.
- Goodman CA, Frey JW, Mabrey DM, et al. The role of skeletal muscle mTOR in the regulation of mechanical load‐induced growth. J Physiol. 2011;589:5485–5501.
- Bai X, Ma D, Liu A, et al. Rheb activates mTOR by antagonizing its endogenous inhibitor, FKBP38. Science. 2007;318:977–980.
- Goodman CA. Role of mTORC1 in mechanically induced increases in translation and skeletal muscle mass. J Appl Physiol. 2019;127:581–590.
- Sarbassov DD, Guertin DA, Ali SM, et al. Phosphorylation and regulation of Akt/PKB by the rictor-mTOR complex. Science. 2005;307:1098–1101.
- Yu T, Li J, Yan M, et al. MicroRNA-193a-3p and-5p suppress the metastasis of human non-small-cell lung cancer by downregulating the ERBB4/PIK3R3/mTOR/S6K2 signaling pathway. Oncogene. 2015;34:413–423.
- Mayer C, Grummt I. Ribosome biogenesis and cell growth: mTOR coordinates transcription by all three classes of nuclear RNA polymerases. Oncogene. 2006;25:6384–6391.
- Nader GA, McLoughlin TJ, Esser KA. mTOR function in skeletal muscle hypertrophy: increased ribosomal RNA via cell cycle regulators. Am J Physiol Cell Physiol. 2005;289:C1457–C1465.
- von Walden F, Liu C, Aurigemma N, et al. mTOR signaling regulates myotube hypertrophy by modulating protein synthesis, rDNA transcription, and chromatin remodeling. Am J Physiol Cell Physiol. 2016;311:C663–C672.
- Arabi A, Wu S, Ridderstråle K, et al. c-Myc associates with ribosomal DNA and activates RNA polymerase I transcription. Nat Cell Biol. 2005;7:303–310.
- Van Riggelen J, Yetil A, Felsher DW. MYC as a regulator of ribosome biogenesis and protein synthesis. Nat Rev Cancer. 2010;10:301.
- Maiuri MC, Galluzzi L, Morselli E, et al. Autophagy regulation by p53. Curr Opin Cell Biol. 2010;22:181–185.
- Beharry AW, Judge AR. Differential expression of HDAC and HAT genes in atrophying skeletal muscle. Muscle Nerve. 2015;52:1098–1101.
- Beharry AW, Sandesara PB, Roberts BM, et al. HDAC1 activates FoxO and is both sufficient and required for skeletal muscle atrophy. J Cell Sci. 2014;127:1441–1453.
- Bell RA, Al-Khalaf M, Megeney LA. The beneficial role of proteolysis in skeletal muscle growth and stress adaptation. Skelet Muscle. 2016;6:16.
- Masiero E, Agatea L, Mammucari C, et al. Autophagy is required to maintain muscle mass. Cell Metab. 2009;10:507–515.
- von Walden F, Jakobsson F, Edström L, et al. Altered autophagy gene expression and persistent atrophy suggest impaired remodeling in chronic hemiplegic human skeletal muscle. Muscle Nerve. 2012;46:785–792.
- Sanchez AM, Bernardi H, Py G, et al. Autophagy is essential to support skeletal muscle plasticity in response to endurance exercise. Am J Physiol Regul Integr Comp Physiol. 2014;307:R956–R969.
- He C, Bassik MC, Moresi V, et al. Exercise-induced BCL2-regulated autophagy is required for muscle glucose homeostasis. Nature. 2012;481:511.
- Saxton RA, Sabatini DM. mTOR signaling in growth, metabolism, and disease. Cell. 2017;168:960–976.
- Suzuki MM, Bird A. DNA methylation landscapes: provocative insights from epigenomics. Nat Rev Genet. 2008;9:465.
- Mendoza MC, Er EE, Blenis J. The Ras-ERK and PI3K-mTOR pathways: cross-talk and compensation. Trends Biochem Sci. 2011;36:320–328.
- Murach KA, Dungan CM, Dupont-Versteegden EE, et al. “Muscle memory” not mediated by myonuclear number?: secondary analysis of human detraining data. J Appl Physiol. 2019;127:1814–1816.
- Sharples AP, Stewart CE, Seaborne RA. Does skeletal muscle have an ‘epi’‐memory? The role of epigenetics in nutritional programming, metabolic disease, aging and exercise. Aging Cell. 2016;15:603–616.
- Tumbar T, Guasch G, Greco V, et al. Defining the epithelial stem cell niche in skin. Science. 2004;303:359–363.
- Okada S, Saiwai H, Kumamaru H, et al. Flow cytometric sorting of neuronal and glial nuclei from central nervous system tissue. J Cell Physiol. 2011;226:552–558.