
ABSTRACT
Aberrant DNA methylation is significantly associated with the prognosis of patients with colorectal cancer (CRC). Therefore, the aim of this study was to develop a CpG-methylation-based nomogram for prognostic prediction in CRC. First, 378 CRC patients with methylation data from The Cancer Genome Atlas were randomly divided into training cohort (n = 249) and test cohort (n = 129). A multistep screening strategy was performed to identify six CpG sites that were significantly associated with overall survival in the training cohort. Then, Cox regression modelling was performed to construct a prognostic signature based on the candidate CpG sites. The six-CpG signature successfully separated patients into high-risk and low-risk groups in both training and test cohorts, and its performance was superior to that of previously published methylation markers (P < 0.05). Furthermore, we established a prognostic nomogram incorporating this signature, TNM stage, and age. The nomogram exhibited better prediction for overall survival in comparison with the three independent prognostic factors in the training cohort (C-index: 0.798 vs 0.620 to 0.737; P < 0.001). In the test cohort, the performance of nomogram was also superior to that of the three independent prognostic factors (C-index: 0.715 vs 0.590 to 0.665; P < 0.05). Meanwhile, the calibration curves for survival probability showed good agreement between prediction by nomogram and actual observation in both training and test cohorts. Together, the present study provides a novel CpG-methylation-based nomogram as a promising predictor for overall survival of CRC patients, which may help improve decision-making regarding the personalized treatments of patients with CRC.
Introduction
Colorectal cancer (CRC) is the third most common form of cancer and the second leading cause of cancer-related death worldwide [Citation1]. Currently, TNM staging system is widely used to predict the prognosis of CRC patients. However, CRC patients with the same TNM stage often have distinct prognoses in clinical practice. For instance, patients with stage I and II CRC generally have a favourable prognosis and are treated by surgical resection alone. Unfortunately, approximately 10%~30% of stage I and II CRC patients experience tumour recurrence within 5 years after curative surgery and require more intense treatment, such as adjuvant chemotherapy [Citation2,Citation3]. Therefore, more precise prognostic tools for CRC will enable individualized therapy and improve patient prognosis.
DNA methylation, the major epigenetic modification, is involved in the regulation of gene expression. Aberrant promoter hypermethylation silences tumour suppressor genes and global DNA hypomethylation causes genomic instability, leading to CRC initiation and progression [Citation4]. The potential prognostic utility of DNA methylation in CRC has been increasingly highlighted. For instance, CpG island methylator phenotype (CIMP), characterized by a high prevalence of promoter CpG island methylation, have been demonstrated to be an independent prognostic factor in CRC [Citation5,Citation6]. Hypermethylation of IGFBP3 was associated with poor CRC prognosis in three separate studies [Citation7–9]. Two panels of CpG sites (CpGs) were recently reported as prognostic biomarkers for patients with CRC [Citation10,Citation11]. Nevertheless, most studies have focused on only one or a few genes or on a subgroup of CRC patients with specific clinical features. In addition, some methylation panels comprise a large number of markers and lack a prognostic score formula, making them unfeasible in clinical practice.
Based on genome-wide DNA methylation data for tumour tissues from CRC patients in The Cancer Genome Atlas (TCGA) database, the present study established and validated a six-CpG signature to predict overall survival (OS). We then investigated the potential biological processes underlying the involvement of the six-CpG signature in CRC. Moreover, we compared the predictive ability of the methylation signature and previous CpG methylation markers. As a result, a prognostic nomogram was built that encompasses the methylation signature and several independent clinical prognostic factors to improve the predictive accuracy of OS for patients with CRC.
Results
Patient characteristics
The clinicopathological characteristics of the study populations are listed in . The median age of these 378 patients was 66 years (range, 31 ~ 90 years). The median OS and progression-free survival (PFS) were 676 days and 588 days, respectively. The 3-year and 5-year OS rates were 63.7% and 39.0%, respectively. The 3-year and 5-year PFS rates were 42.1% and 23.3%, respectively. OS was defined as the time from the date of initial diagnosis to the date of death or last contact. PFS was defined as the time from the date of initial diagnosis to the date of disease progression, death, or last contact. The TNM stage was determined according to the seventh edition of the American Joint Commission on Cancer staging system. The right-sided colon includes from the caecum to the transverse colon, and the left-sided colon includes from the splenic flexure to the rectosigmoid junction.
Table 1. Clinicopathological characteristics of CRC patients from TCGA database
Identification of candidate CpG sites in the training cohort
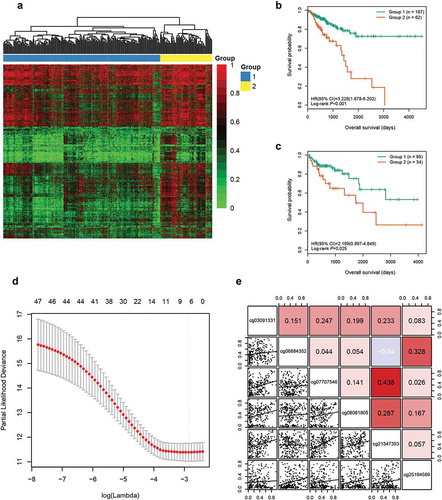
A multistep screening strategy was performed to screen a panel of CpGs as prognostic markers in CRC. First, 42,632 CpGs that had a standard deviation of greater than 0.2 in tumour tissues of the training cohort were selected to fit univariate Cox regression models. Then, using unsupervised hierarchical clustering based on the 3299 CpGs significantly associated with OS (P < 0.05), patients in training cohort were clustered into two groups with a significant difference in survival (hazard ratio [HR], 3.228; 95% confidence interval [CI], 1.678 ~ 6.202; P < 0.001, ,). Based on 1526 differentially methylated CpGs (Wilcoxon rank test P value <0.05 and |CpG methylation difference| >0.15) between the two groups generated by the clustering (Supplementary Figure S1A), we further identified 47 labelled CpGs by executing Least Absolute Shrinkage and Selector Operation (LASSO) logistic regression (Supplementary Figure S1B). Meanwhile, supervised hierarchical clustering of test cohort with the 47 labelled CpGs showed that patients were segregated into two distinct survival groups (HR, 2.199; 95% CI, 0.997 ~ 4.849; P = 0.025; )). Finally, regularized Cox regression of the 47 CpGs was performed to identify six candidate CpGs ()), including cg03091331, cg06884352, cg07707546, cg08081805, cg21347353, and cg25164589. No significant collinearity was observed among these CpGs ()).
Figure 1. Identification of six candidate CpGs in the training cohort. (a) Unsupervised hierarchical clustering and heatmap for 249 CRC patients based on 3299 CpGs associated with OS. Each column corresponds to an individual patient and each row corresponds to an individual CpG. (b) Kaplan-Meier survival curves of the two groups generated by the clustering. (c) Kaplan-Meier survival curves of the two groups generated by the supervised hierarchical clustering in the test cohort. (d) Ten-fold cross-validation for regularized cox regression with L1 penalty identified six candidate CpGs. The two dotted vertical lines are drawn at the optimal values by minimum criteria and 1-standard error criteria, respectively. The tuning parameter λ = 0.057 with log (λ) = −2.863 was determined by minimum criteria. (e) Correlations among the methylation levels of the six CpGs
Building and validating a CpG methylation signature for survival prediction
Using the six candidate CpGs, we constructed a prognostic signature in training cohort, and obtained a CpG methylation risk score formula: risk score = 0.919 × β value of cg03091331 + 0.963 × β value of cg06884352 + 0.703 × β value of cg07707546 + 0.721 × β value of cg08081805 + 0.587 × β value of cg21347353 + 0.528 × β value of cg25164589 (). The distribution of risk score, survival status, and CpG methylation level for patients in training cohort showed that patients with lower risk score generally had better survival and lower methylation levels of the six CpGs than patients with higher risk score ()). Using the optimal risk score cut-off of 2.020 generated by X-tile plots (Supplementary Figure S2), patients in training cohort were separated into high-risk group (n = 63, 25.3%) and low-risk group (n = 186, 74.7%). Kaplan-Meier survival curves, depicted in ), indicated that high-risk patients had worse OS (HR, 4.129; 95% CI, 2.101 ~ 8.011; P < 0.001) and PFS (HR, 1.988; 95% CI, 1.184 ~ 3.338; P = 0.002) than low-risk patients.
Table 2. Characteristics of six CpG markers in the methylation signature
Figure 2. Risk score distribution and survival analysis of the six-CpG signature in training and test cohorts. The distribution of risk score, survival status, and CpG methylation level for patients in training cohort (a) and test cohort (c). Kaplan–Meier survival curves of the OS and PFS of patients using the six-CpG signature in training cohort (b) and test cohort (d)
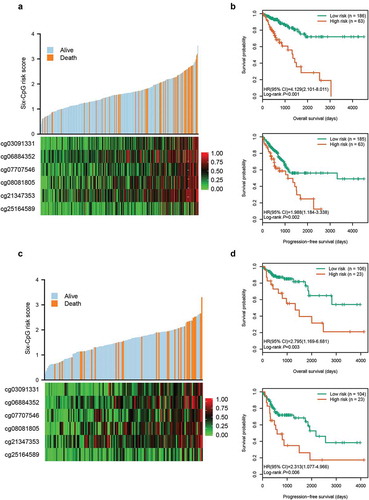
Meanwhile, the risk score of patients in the test cohort was also calculated according to the risk score formula. Compared to patients with a higher risk score, patients with lower risk score exhibited better survival and lower methylation levels of the six CpGs ()). Based on the same risk score cut-off used in the training cohort, patients in test cohort were divided into high-risk group (n = 23, 17.8%) and low-risk group (n = 106, 82.2%) (Supplementary Table S1). As shown in ), patients in the high-risk group had worse OS (HR, 2.795; 95% CI, 1.169 ~ 6.681; P = 0.003) and PFS (HR, 2.313; 95% CI, 1.077 ~ 4.966; P = 0.006) than patients in the low-risk group.
Correlations among CpG methylation, gene expression, and OS
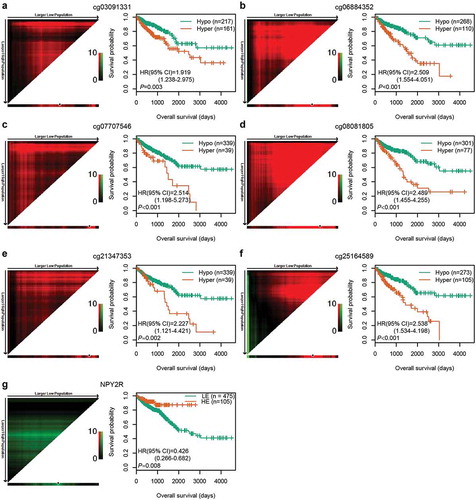
After the optimal cut-off for each CpG was determined using X-tile plots, CRC patients in the entire cohort were classified into hypermethylation and hypomethylation groups. Kaplan-Meier survival analysis showed that the OS of patients in hypomethylation group was significantly better than in hypermethylation group (P < 0.01, f)). Among the six CpGs, two (cg07707546 and cg08081805) are located in the promoter region of NPY2R and the gene body of RASIP1, respectively. Spearman rank correlation test was performed to analyse the relationship between the methylation levels of the two CpGs and the expression of the corresponding genes using TCGA methylation and expression data. As expected, cg07707546 methylation was negatively correlated with NPY2R expression (rho = −0.135, P = 0.008). Higher expression of NPY2R gene was significantly associated with better OS in 580 CRC patients with expression data ()). However, cg08081805 methylation was not significantly correlated with RASIP1 expression (rho = 0.077, P = 0.130).
Figure 3. Correlations among CpG methylation, gene expression, and OS. (a–f) Kaplan‐Meier survival curves of six CpGs in 378 CRC patients. (g) Kaplan‐Meier survival curves of NPY2R gene in 580 CRC patients. The optimal cut-off was determined by the X-tile plots. Colouration of the plot represents the strength of the association at each division, ranging from low (dark, black) to high (green or red). Red represents the inverse association between the risk score and OS, whereas green represents a direct association. The dark dots in the X-tile plots are the cut-off points based on the highest χ2-value with Kaplan–Meier survival analysis. Hyper: Hypermethylation; Hypo: Hypomethylation; HE: High expression; LE: Low expression
Potential biological processes associated with high-risk group identified by the six-CpG signature
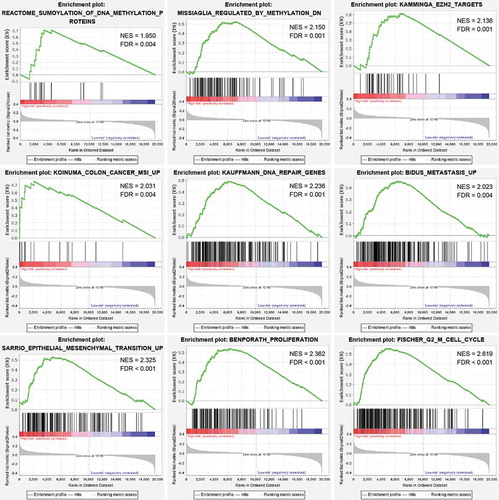
Based on gene set enrichment analysis (GSEA) [Citation12] between high- and low-risk groups in the entire cohort, we found that the gene expression signatures of ‘Sumoylation of DNA methylation proteins’, ‘Regulated by methylation down’, ‘EZH2 targets’, ‘Colon cancer MSI up’, ‘DNA repair genes’, ‘Metastasis up’, ‘Epithelial-mesenchymal transition up’, ‘Proliferation’, and ‘G2 M cell cycle’ were significantly enriched in high-risk group defined by the six-CpG signature (false discovery rate [FDR] <0.01, , Supplementary Table S2). The results revealed that methylation of the six identified CpGs may play an important role in the development of CRC through regulating the aforementioned biological pathways.
Figure 4. GSEA analysis between the high- and low-risk groups in the entire cohort. Enrichment plots of representative gene sets in the high-risk group (FDR < 0.01)
Comparison of predictive ability between the six-CpG signature and previous methylation markers
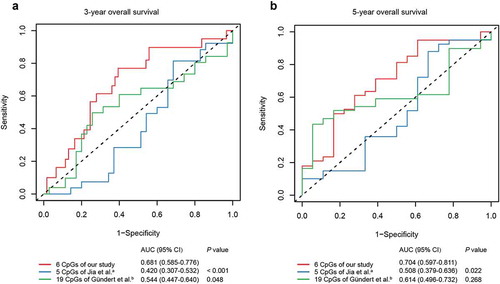
To verify whether our six-CpG signature was superior to other markers at predicting survival in CRC, we compared the predictive efficacy of our methylation signature and previous methylation markers by the same methodology. Cox regression models were first established in training cohort using the six CpGs from our study, five CpGs from Jia et al. [Citation11], and 19 CpGs from Gündert et al. [Citation10] (Supplementary Table S3), respectively. Then, ROC analyses of different methylation panels were performed in the test cohort and the area under ROC curve (AUC) values were compared by Z test. The results suggested that our six-CpG signature outperformed previous CpG methylation markers at predicting the 3-year and 5-year OS of CRC patients (, P < 0.05).
Figure 5. ROC curves of the six-CpG signature and other prognostic methylation markers in test cohort for predicting OS at 3 years (a) and 5 years (b). aJia et al. reported seven CpGs as prognostic markers in CRC. Five of them had methylation values in TCGA-COAD and TCGA-READ datasets. bGündert et al. reported 20 CpGs as prognostic markers in CRC. Nineteen of them had methylation values in TCGA-COAD and TCGA-READ datasets
Identification of independent prognostic factors
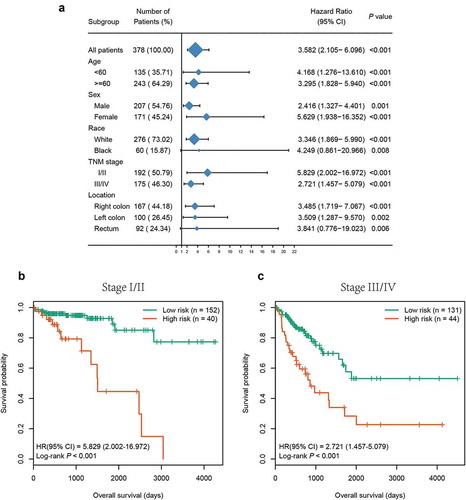
To substantiate whether the six-CpG signature was an independent prognostic factor for OS, Kaplan–Meier survival analysis was performed in patients stratified by different clinicopathological characteristics, including age, gender, race, TNM stage, and tumour location. Irrespective of clinicopathological characteristics, the six-CpG signature remained significantly associated with OS (P < 0.01, , Supplementary Figure S3). For instance, CRC patients in the same TNM stage, including early stage (stage I/II) and advanced stage (stage III/IV), could be successfully divided into two groups with significant differences in survival (P < 0.001, ,). Additionally, the abovementioned clinicopathological characteristics and our six-CpG signature were entered in univariate and multivariate Cox regression analyses in the entire cohort. The results demonstrated that the six-CpG signature, TNM stage, and age were independent prognostic factors for OS ().
Table 3. Univariate and multivariate Cox regression analyses of clinicopathological characteristics and six-CpG signature in the entire cohort
Figure 6. Subgroup analysis of the six-CpG signature in the entire cohort. (a) The results of Kaplan–Meier survival analysis of the six-CpG signature in different subgroups stratified by clinicopathological characteristics. Kaplan–Meier survival curves of the six-CpG signature in patients with different TNM stage, including stage I/II (b) and stage III/IV (c)
Building and validating a nomogram for OS prediction
Based on the three independent prognostic factors, we established a prognostic nomogram for predicting the 3-year and 5-year OS in the training cohort ()). The total points (Nomo-score) of each patient in the training cohort were calculated according to the nomogram. Using the Nomo-score cut-off values of 91.65 and 117.06 generated by X-tile plots (Supplementary Figure S4), patients in the training cohort were separated into high-risk, intermediate-risk, and low-risk groups. Kaplan-Meier survival curves showed significant survival differences among the three groups (P < 0.05) ()). The concordance index (C-index) of the nomogram for predicting OS was 0.798 (95% CI, 0.742 ~ 0.854), and calibration curves for the 3-year and 5-year OS probability showed optimal agreement between the prediction and actual observation ())
Figure 7. Construction and validation of the prognostic nomogram. (a) Nomogram for predicting the 3-year and 5-year OS of patients with CRC. Kaplan‐Meier curves of three subgroups stratified by the total points of the nomogram in training cohort (b) and test cohort (d). The calibration curves for predicting the 3-year and 5-year OS in the training cohort (c) and test cohort (e)
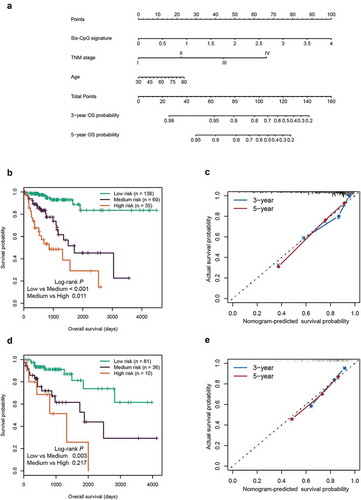
Furthermore, the Nomo-score of each patient in the test cohort was also calculated according to the nomogram. Using the same cut-off values used in the training cohort, patients in the test cohort were divided into three groups with significant differences in survival (P < 0.05, )). In the test cohort, the C-index of the nomogram for OS prediction was 0.715 (95% CI, 0.601 ~ 0.829). The calibration curves displayed good agreement between prediction and actual observation in the 3-year and 5-year OS probability ()).
Comparison of predictive ability between the nomogram and independent prognostic factors
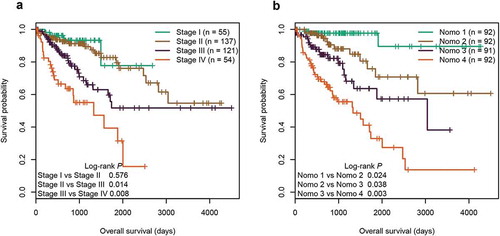
Currently, the TNM staging system is widely used to predict the survival of CRC patients in clinical practice. In the entire cohort, we found that the TNM staging system showed good prognostic differentiation for patients between stage III and IV, and yet poor prognostic differentiation for patients between stage I and II ()). In contrast, using the quartiles of Nomo-score as cut-off values (67.368, 84.095, and 105.121), our nomogram successfully segregated patients into four groups with significant differences in survival (P < 0.05, )). We further compared the predictive accuracy for OS between our nomogram and the three independent factors in both training and test cohorts. In the training cohort, the C-index of the nomogram (0.798) was significantly higher than that of the six-CpG signature (0.702), combined clinical factors (TNM and age, 0.737), TNM staging system (0.713), and age (0.620) (P < 0.001). Likewise, the C-indexes of the six-CpG signature, combined clinical factors, TNM staging system, and age were 0.642, 0.665, 0.635, and 0.590, respectively, all of which were significantly lower than that of the nomogram (0.715) in test cohort (P < 0.05). Overall, our prognostic nomogram had better predictive performance than the three independent factors.
Figure 8. Kaplan‐Meier survival curves of four subgroups stratified by TNM staging system (a) or the total points of the nomogram (b) in the entire cohort
Discussion
CRC is a highly heterogeneous disease that comprises a variety of molecular subtypes with distinct prognoses [Citation13,Citation14]. The current widely used TNM staging system alone cannot precisely identify CRC patients with poor prognosis and frequently leads to improper treatments in clinical practice. In this study, based on genome-wide DNA methylation profiling, we identified six CpGs significantly correlated with OS of patients with CRC. Then, a signature based on the six CpGs was constructed and validated as a promising predictor of OS in CRC. The six-CpG signature still performed well in patients regrouped by different clinicopathological characteristics. Moreover, GSEA analysis revealed that the high-risk group defined by the six-CpG signature was significantly enriched with gene sets associated with DNA methylation, tumour proliferation, and metastasis.
An increasing number of studies have suggested that CpG methylation signature can act as a reliable prognostic biomarker in multiple human cancers [Citation10,Citation11,Citation15–19]. For instance, Jia et al. [Citation11] found that a panel of seven CpGs located in CIMP-related genes served as a prognostic marker for OS of patients with CRC. A classifier based on 20 CpGs was reported by Gündert et al. [Citation10] to predict the prognosis of non-metastatic CRC patients. ROC analysis showed that our six-CpG signature outperformed these two previously published panels of CpG methylation markers for predicting OS of CRC patients. In addition, unlike the two studies where hypomethylation of CpGs was associated with poor prognosis in CRC, hypermethylation of each CpG in our methylation signature predicted poor survival. Among the six CpGs identified in our study, four (cg03091331, cg06884352, cg21347353, and cg25164589) are located in intergenic regions, and the remaining two (cg07707546 and cg08081805) are located in the promoter region of NPY2R and the gene body of RASIP1, respectively. The results indicated that methylation of intergenic regions may play an important role in tumorigenesis. In fact, intergenic DNA methylation has been suggested to affect alternative splicing and the expression of noncoding RNAs in cancer development [Citation20,Citation21]. In addition, hypermethylation of NPY2R has been reported to be associated with poor prognosis in head and neck cancer [Citation22]. BIM-43,004-1, a NPY2R agonist, was found to inhibit pancreatic cancer growth in mice [Citation23]. RASIP1, essential for blood vessel development, has been demonstrated to be overexpressed and promote cancer cell migration in nonsmall-cell lung cancer [Citation24]. Nevertheless, the function of RASIP1 methylation in cancer remains unclear.
Several studies have revealed that nomograms display better predictive efficacy than conventional TNM staging system for prognosis in some cancers [Citation25–27]. Although prognostic nomograms comprising important clinicopathologic characteristics have been reported in CRC [Citation28–30], methylation markers are not included. Herein, we built a prognostic nomogram encompassing the six-CpG signature, TNM stage, and age in CRC. Moreover, we demonstrated that the methylation-based nomogram was more accurate than TNM staging system for predicting OS of CRC patients.
Compared with previous methylation studies in CRC prognosis, our study has several strengths. First, due to the inclusion of relatively few markers, our methylation signature is cheaper and easier to be measured in clinical practice. Second, most studies on CRC prognosis have not investigated the CpG methylation of intergenic regions. The value of intergenic DNA methylation in predicting the prognosis of CRC patients was suggested in our study. Third, our study is the first to use the nomogram, an easily understandable and acceptable method by clinicians, to incorporate methylation markers and independent clinicopathologic prognostic factors for prognostic prediction of patients with CRC. Nevertheless, some limitations of this study need to be noted. For instance, our nomogram did not encompass some important pathological features, such as microsatellite instability (MSI) status and KRAS/BRAF mutations, which are considered prognostic factors in CRC [Citation31–33]. In addition, more validation cohorts are required to further confirm the stability of the prognostic nomogram.
Conclusions
In summary, we developed a CpG-methylation-based nomogram for prognostic prediction of patients with CRC that is superior to conventional TNM staging system. The prognostic nomogram may guide personalized treatments and enhance the postoperative surveillance of CRC patients.
Materials and methods
DNA methylation, gene expression, and related clinical data
Methylation data (level 3, Illumina HumanMethylation450 BeadChip), gene expression data (level 3, Illumina HiSeq_RNASeq Version 2), and related clinical information on tumour tissues from patients with colon cancer (COAD) or rectum cancer (READ) were retrieved from TCGA database up to January 2019. The methylation level of each CpG was expressed as a β value, calculated as M/(M + U + 100), where M and U represent fully methylated and unmethylated signal intensities, respectively. The log2 (normalized count + 1) was used as a gene expression level. Data preprocessing was performed as described in our previous study [Citation34]. Only data for patients who had complete survival information and did not receive neoadjuvant chemotherapy were selected. Consequently, 378 patients (286 colon cancer and 92 rectum cancer) with methylation data and 580 patients (428 colon cancer and 156 rectum cancer) with gene expression data were included in this study. PCA and unsupervised hierarchical clustering showed no significant differences between TCGA-COAD and TCGA-READ datasets (Supplementary Figure S5). The 378 patients with methylation data were randomly divided into training cohort (n = 249) and test cohort (n = 129) with a 2:1 ratio.
Selection of candidate CpG sites
To identify a panel of CpGs significantly associated with OS, a multistep screening strategy was conducted in the training cohort. First, similar to previous studies where the most variably methylated CpGs were used to divide tumour patients into distinct survival subgroups [Citation35,Citation36], we selected the CpGs with a standard deviation of greater than 0.2 in tumour tissues to fit univariate Cox regression models in the training cohort. Then, the prognosis-related CpGs (P < 0.05) were used for hierarchical clustering with the complete method for agglomerating the manhattan distances to divide the samples of training cohort into two groups with a difference in survival. The labelled CpGs between the two groups were identified by successively executing differential methylation analysis (Wilcoxon rank test P value <0.05 and |CpG methylation difference| >0.15) and LASSO logistic regression with ten-fold cross-validation, and then validated in test cohort using supervised hierarchical clustering. Finally, regularized Cox regression, implemented in R ‘glmnet’ package, was performed with 10-fold cross-validation to identify the candidate CpGs with nonzero coefficients.
Statistical analysis
All the statistical analyses were performed with R software version 3.6.0 unless otherwise stated. Using the candidate CpGs as covariates in Cox regression model, a prognostic methylation signature was constructed in the training cohort. The CpG methylation risk score for each patient was calculated by multiplying the methylation values of candidate CpGs by the corresponding regression coefficients. The differences in biological pathways between high-risk and low-risk groups defined by the methylation signature were identified by GSEA analysis in GSEA v4.02 software. The reference gene sets (c2.all.v7.0.symbols) were obtained from Molecular Signatures Database (MSigDB, www.broadinstitute.org/msigdb). Time-dependent ROC analysis, implemented in R ‘timeROC’ package, was used to assess the predictive ability of our methylation signature and previous methylation markers in predicting the prognosis of CRC patients, and the AUC values were compared with Z test. The larger the AUC value is, the more accurate the risk prediction. Univariate and multivariate Cox regression analyses were used to assess the relationships between clinical characteristics and OS. Using the R ‘rms’ package, a nomogram for predicting 3-year and 5-year OS was constructed based on independent prognostic factors. The performance of the nomogram was assessed by the C-index and calibration curves. Bootstraps with 1,000 resamples were used for these activities. The nomogram and independent prognostic factors were compared with R ‘Hmisc’ package and evaluated by the C-index. The larger the C-index is, the more accurate the prognostic prediction. The total points (Nomo-score) for each patient were calculated based on the prognostic nomogram. The optimal cut-off values for CpG methylation risk score and Nomo-score were determined by X-tile software version 3.6.1 based on the highest χ2-value with Kaplan–Meier survival analysis. Survival curves of the groups were plotted using Kaplan–Meier method and compared with log-rank test. A two-sided P value <0.05 was considered statistically significant.
Supplemental Material
Download PDF (817.6 KB)Acknowledgments
We would like to thank TCGA Research Network for its contribution.
Disclosure statement
No potential conflict of interest was reported by the authors.
Supplementary material
Supplemental data for this article can be accessed here.
Additional information
Funding
References
- Bray F, Ferlay J, Soerjomataram I, et al. Global cancer statistics 2018: GLOBOCAN estimates of incidence and mortality worldwide for 36 cancers in 185 countries. CA Cancer J Clin. 2018 Nov;68(6):394–424. .
- Guraya SY, Pattern S. Time of recurrent colorectal cancer after curative surgery. Clin Colorectal Cancer. 2019 Jun;18(2):e223–e228.
- Lin HH, Wei NC, Chou TY, et al. Building personalized treatment plans for early-stage colorectal cancer patients. Oncotarget. 2017 Feb 21;8(8):13805–13817.
- Sahnane N, Magnoli F, Bernasconi B, et al. Aberrant DNA methylation profiles of inherited and sporadic colorectal cancer. Clin Epigenetics. 2015 Dec 21;7:131. .
- Weisenberger DJ, Siegmund KD, Campan M, et al. CpG island methylator phenotype underlies sporadic microsatellite instability and is tightly associated with BRAF mutation in colorectal cancer. Nat Genet. 2006 Jul;38(7):787–793. .
- Juo YY, Johnston FM, Zhang DY, et al. Prognostic value of CpG island methylator phenotype among colorectal cancer patients: a systematic review and meta-analysis. Ann Oncol. 2014 Dec;25(12):2314–2327. .
- Yi JM, Dhir M, Van Neste L, et al. Genomic and epigenomic integration identifies a prognostic signature in colon cancer. Clin Cancer Res. 2011 Mar 15;17(6):1535–1545.
- Fu T, Pappou EP, Guzzetta AA, et al. IGFBP-3 gene methylation in primary tumor predicts recurrence of stage II colorectal cancers. Ann Surg. 2016 Feb;263(2):337–344. .
- Perez-Carbonell L, Balaguer F, Toiyama Y, et al. IGFBP3 methylation is a novel diagnostic and predictive biomarker in colorectal cancer. PLoS One. 2014 Aug 15;9(8):e104285.
- Gundert M, Edelmann D, Benner A, et al. Genome-wide DNA methylation analysis reveals a prognostic classifier for non-metastatic colorectal cancer (ProMCol classifier). Gut. 2019 Jan;68(1):101–110. .
- Jia M, Zhang Y, Jansen L, et al. A prognostic CpG score derived from epigenome-wide profiling of tumor tissue was independently associated with colorectal cancer survival. Clin Epigenetics. 2019 Jul 24;11(1):109.
- Subramanian A, Tamayo P, Mootha VK, et al. Gene set enrichment analysis: a knowledge-based approach for interpreting genome-wide expression profiles. Proc Natl Acad Sci U S A. 2005 Oct 25;102(43):15545–15550.
- Sadanandam A, Lyssiotis CA, Homicsko K, et al. A colorectal cancer classification system that associates cellular phenotype and responses to therapy. Nat Med. 2013 May;19(5):619–625. .
- Suzuki H, Yamamoto E, Maruyama R, et al. Biological significance of the CpG island methylator phenotype. Biochem Biophys Res Commun. 2014 Dec 5;455(1–2):35–42.
- Xu RH, Wei W, Krawczyk M, et al. Circulating tumour DNA methylation markers for diagnosis and prognosis of hepatocellular carcinoma. Nat Mater. 2017 Nov;16(11):1155–1161.
- Wei JH, Haddad A, Wu KJ, et al. A CpG-methylation-based assay to predict survival in clear cell renal cell carcinoma. Nat Commun. 2015 Oct 30;6:8699. .
- Guo W, Zhu L, Yu M, et al. A five-DNA methylation signature act as a novel prognostic biomarker in patients with ovarian serous cystadenocarcinoma. Clin Epigenetics. 2018 Nov 16;10(1):142.
- Guo W, Zhu L, Zhu R, et al. A four-DNA methylation biomarker is a superior predictor of survival of patients with cutaneous melanoma. Elife. 2019 Jun 6;8. DOI:10.7554/eLife.44310
- Shen S, Wang G, Shi Q, et al. Seven-CpG-based prognostic signature coupled with gene expression predicts survival of oral squamous cell carcinoma. Clin Epigenetics. 2017 Aug 24;9:88. .
- Cheung HH, Lee TL, Davis AJ, et al. Genome-wide DNA methylation profiling reveals novel epigenetically regulated genes and non-coding RNAs in human testicular cancer. Br J Cancer. 2010 Jan 19;102(2):419–427.
- Cheung HH, Lee TL, Rennert OM, et al. DNA methylation of cancer genome. Birth Defects Res C Embryo Today. 2009 Dec;87(4):335–350. .
- Misawa K, Imai A, Mochizuki D, et al. Genes encoding neuropeptide receptors are epigenetic markers in patients with head and neck cancer: a site-specific analysis. Oncotarget. 2017 Sep 29;8(44):76318–76328.
- Liu CD, Slice LW, Balasubramaniam A, et al. Y2 receptors decrease human pancreatic cancer growth and intracellular cyclic adenosine monophosphate levels. Surgery. 1995 Aug;118(2):229–235. .
- Chen Y, Zhang L, Liu L, et al. Rasip1 is a RUNX1 target gene and promotes migration of NSCLC cells. Cancer Manag Res. 2018 Oct 12;10:4537–4552. .
- Wang Y, Ruan Z, Yu S, et al. A four-methylated mRNA signature-based risk score system predicts survival in patients with hepatocellular carcinoma. Aging (Albany NY). 2019 Jan 10;11(1):160–173.
- Sternberg CN. Are nomograms better than currently available stage groupings for bladder cancer? J Clin Oncol. 2006 Aug 20;24(24):3819–3820.
- Wang Y, Li J, Xia Y, et al. Prognostic nomogram for intrahepatic cholangiocarcinoma after partial hepatectomy. J Clin Oncol. 2013 Mar 20;31(9):1188–1195.
- Honda M, Oba K, Akiyoshi T, et al. Development and validation of a prognostic nomogram for colorectal cancer after radical resection based on individual patient data from three large-scale phase III trials. Oncotarget. 2017 Nov 17;8(58):99150–99160.
- Feng Y, Li Y, Cai S, et al. Immunological nomograms predicting prognosis and guiding adjuvant chemotherapy in stage II colorectal cancer. Cancer Manag Res. 2019 Aug 1;11:7279–7294. .
- Kim C, Kim WR, Kim KY, et al. Predictive nomogram for recurrence of stage I colorectal cancer after curative resection. Clin Colorectal Cancer. 2018 Sep;17(3):e513–e518. .
- Yang Y, Wang D, Jin L, et al. Prognostic value of the combination of microsatellite instability and BRAF mutation in colorectal cancer. Cancer Manag Res. 2018 Sep 26;10:3911–3929. .
- Murcia O, Juarez M, Rodriguez-Soler M, et al. Colorectal cancer molecular classification using BRAF, KRAS, microsatellite instability and CIMP status: prognostic implications and response to chemotherapy. PLoS One. 2018 Sep 6;13(9):e0203051.
- Smeby J, Sveen A, Merok MA, et al. CMS-dependent prognostic impact of KRAS and BRAFV600E mutations in primary colorectal cancer. Ann Oncol. 2018 May 1;29(5):1227–1234.
- Wang X, Wang D, Zhang H, et al. Genome-wide analysis of DNA methylation identifies two CpG sites for the early screening of colorectal cancer. Epigenomics. 2020 Jan;12(1):37–52. .
- Cheng J, Wei D, Ji Y, et al. Integrative analysis of DNA methylation and gene expression reveals hepatocellular carcinoma-specific diagnostic biomarkers. Genome Med. 2018 May 30;10(1):42.
- Linehan WM, Spellman PT, Ricketts CJ, et al. Comprehensive molecular characterization of papillary renal-cell carcinoma. N Engl J Med. 2016 Jan 14;374(2):135–145.