
ABSTRACT
One caveat in cancer research is the dependence of certain experimental systems that might not really reflect the properties of the primary tumours. The recent irruption of 3D cultured cells termed organoids could render a better representation of the original tumour sample. However, every laboratory has its own protocol and tissue-provider to establish these cancer models, preventing further dissemination and validation of the obtained data. To address this problem, the Human Cancer Models Initiative (HCMI) has selected the American Type Culture Collection (ATCC) to make available organoid models to the scientific community. In this regard, no epigenetic information is available for these samples and, overall, the DNA methylation profiles of human cancer organoids are largely unknown. Herein, we provide the DNA methylation landscape of 25 human cancer organoids available at the ATCC using a microarray that interrogates more than 850,000 CpG sites. We observed that the studied organoids retain the epigenetic setting of their original primary cancer type; that exhibit a DNA methylation landscape characteristic of transformed tissues excluding an overgrowth of normal-matched cells; and that are closer to the DNA methylation profiles of the corresponding primary tumours than to established 2D cell lines. Most importantly, the obtained DNA methylation results are freely available to everyone for further data mining. Thus, our findings support from the epigenetic standpoint that the ATCC human cancer organoids recapitulate many of the features of the disorder in the patient and are excellent tools to be shared among investigators for further tumour biology research.
Background
Cancer is still a devastating disorder with an increasing incidence worldwide. Thus, a major effort to understand the cellular and molecular pathways involved in its origin and evolution is a necessity. In this regard, advances in new targeted therapies and rescued pharmacological hits, such as immunotherapy agents, are providing more hope that the disease might eventually be controlled. However, a major problem encountered in the cancer research arena is the lack of good laboratory models that recapitulate the features of the disorder in the patient, a caveat that could explain the lack of success of several clinical trials that at the pre-clinical stage were very promising. Many of these early studies in both academic and pharma laboratories use as initial models cancer cell lines that grow in two-dimensions (2D). Since the first immortalized cell line (HeLa) was established [Citation1] there are now hundreds of human cancer cell lines that reflect all tumour types and have been characterized at the genomic and drug-sensitivity level [Citation2–4]. Many important discoveries have been produced from these cancer models, but several issues that limit their applications are also known. These include that 2D cancer cell lines do not reconstitute the architecture of the original tumour tissue, the acquisition of immortalized cell lines from primary tumours is very inefficient, and that the cancer cells could have changed to survive in a monolayer on a plastic surface [Citation5]. One complementary approach would be the use of patient-derived tumour xenografts (PDXs) that can maintain to a certain degree the heterogeneity of the primary tumour, including the cross-talk between the cancer cells and the surrounding cell microenvironment constituted by fibroblasts, endothelial and immune cells [Citation6]. However, major drawbacks for this technology are the limited implantation rate for some tumour types and the very long time required to grow these PDXs until they are useful for further experimentation.
One alternative scenario that arose in these pre-clinical models of cancer was initiated by the use of three-dimensional (3D) culture methods, originally established for neural stem cells that grew as neurospheres [Citation7]. From these systems, tumour spheroid cultures were used for cancer stem cells and the field exploded by the possibility to culture normal epithelial stem cells as organoids. Organoids can be defined as a 3D structure derived from stem cells that mimic the cell types and self-organization present in the original in vivo sample. The exceptional advancement for epithelial-derived organoids, originally discovered in intestinal cells, was possible by achieving WNT pathway activation by R-spondin1 and BMP pathway inhibition [Citation8]. This procedure has now been extended beyond colon cells to other tissues such as pancreas, liver, lung, breast, and others, and not only allowing the growth of the normal tissues but also of the corresponding tumour types [Citation9,Citation10]. The advantages of human cancer organoids are many and among these, we can cite the current efficiency of derivation from the most common epithelial tumours types, the possibility to grow the neighbouring normal tissue part, the relative conservation of intratumoral heterogeneity, the great versatility to perform genetic manipulation and drug testing and, finally, the capacity to test them for a specific patient in a timely manner [Citation9,Citation10].
The extraordinary expectations derived from the emergence of human organoids for cancer research can be limited by the required expertise and sophistication to initially obtain, grow, and characterize these cells, in addition, to the problem of exchanging data from highly diverse samples established around the world. One possible solution is the creation of organoid biobanks that can expand long term, cryopreserve, and provide these living materials to the research laboratories. To achieve this aim, the Human Cancer Models Initiative (HCMI), constituted by the National Cancer Institute (NCI), Cancer Research UK (CRUK), Hubrecht Organoid Technology (HUB), and Wellcome Sanger Institute (WSI) have committed its efforts to make organoid models available to the scientific community [Citation11,Citation12]. In this regard, many of the advances in tumour biology in the last decades have been possible by the use of 2D established cancer cell lines with high-quality standards provided to researchers around the world by the American Type Culture Collection (ATCC) and, for this reason, the ATCC has been selected as the distributor of the HCMI models that are now available to everyone (https://www.lgcstandards-atcc.org/hcmi). Importantly, DNA sequencing data are available for these human cancer organoids, but they are missing a key layer of biological information: the epigenetic setting constituted by DNA methylation [Citation13–16]. Thus, we have herein obtained and studied the DNA methylation landscapes of human cancer organoids available at the ATCC, in a similar manner that we provided the DNA methylation profiles for the 1,001 Sanger [Citation17] and NCI-60 [Citation18,Citation19] cancer cell lines panels. Most importantly, we have deposited all the available DNA methylation data in the public Gene Expression Omnibus (GEO) repository to serve the scientific community in any further studies that use these very promising human cancer models.
Results and discussion
Human cancer organoids show tumour-type specific DNA methylation profiles
The genomic DNA from 25 embedded 3D cultures (organoids) available at the American Type Culture Collection (ATCC) (https://www.lgcstandards-atcc.org/HCMI#Organoids) were interrogated for their DNA methylation landscape using the Epigenetic Infinium MethylationEPIC BeadChip (EPIC) microarray from Illumina, as previously described [Citation20]. These organoids represented five tumour types: Colorectal (n = 11), Pancreatic (n = 7), Oesophageal (n = 4), Stomach (n = 2), and Lung (n = 1) cancer. The characteristics of these organoids, including ATCC ID, model ID, primary site, acquisition site of the sample, clinical tumour diagnosis, histological type, and gender and race of the donor are described in . The complete DNA methylation data are freely available at the GEO repository under accession number GSE144213:
Table 1. General information regarding the human cancer organoids used in the DNA methylation study
https://www.ncbi.nlm.nih.gov/geo/query/acc.cgi?acc=GSE144213
We observed discrete DNA methylation profiles between different organoid tumour types, which enabled their distinction on the basis of the origin of the primary using unsupervised hierarchical clustering with multi-step bootstrap resampling ()). The final hierarchical clustering represented as a tree-based dendrogram also distributed at two arms the studied organoids: one arm corresponding to all the colorectal cancer organoids and the other arm that included the rest of organoid cancer types ()). Dimensionality reduction analysis using t-Distributed Stochastic Neighbour Embedding (t-SNE) [Citation21,Citation22] provided very similar results ()).
Figure 1. Cancer organoid DNA methylation landscapes retain the original tumour type epigenetic profile. (a and c) Heatmaps demonstrating unsupervised hierarchical clustering with bootstrap resampling of DNA methylation profiles for all organoid samples using (a) Infinium MethylationEPIC BeadChip (EPIC) (>850,000 CpGs) and (c) Infinium HumanMethylation450 BeadChip (450 K) (>450,000 CpGs). Red represents methylated CpGs, green unmethylated CpGs. (b and d) t-SNE plots further highlight organoid clustering based on their DNA methylation characteristics from EPIC (b) and 450 K (d). Each organoid sample is labelled according to its respective ATCC ID (b and d). Organoid DNA methylation profiles are displayed as brown (colorectal cancer), violet (oesophageal cancer), light blue (lung cancer), dark blue (pancreatic cancer), and yellow (stomach cancer)
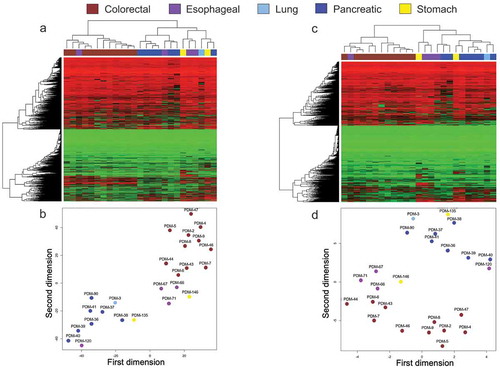
The herein used MethylationEPIC BeadChip Infinium microarray analyzes the methylation status of 853,307 CpG sites (850 K). In comparison to its previous version, the 450 K microarray [Citation23], the EPIC microarray interrogates additional regions with poor CpG content, intergenic sequences, and distant regulatory regions such as enhancers regions provided by the ENCODE [Citation24,Citation25] and FANTOM5 [Citation26] projects. However, the majority of DNA methylation information available from databases, i.e., Gene Expression Omnibus (GEO) or The Cancer Genome Atlas (TCGA) is still derived from the 450 K platform. Because around 91% of the 450 K CpGs are also included in the EPIC 850 K array [Citation20], we speculated if limiting our study to these shared methylation sites we could obtain similar results for organoid tumour type classification as described above. Using the same unsupervised hierarchical clustering with multi-step bootstrap resampling for these loci, we again found specific DNA methylation profiles that enabled the classification of the organoids according to their cancer type ()). The tree-based dendrogram also showed the two described arms; the colorectal cancer branch and the other arm that included all the other remaining tumour types ()). Dimensionality reduction analysis by t-SNE yielded again identical results with all colorectal tumours in one group whereas the other cancer types grouped away ()). These results prompted us to use the CpG sites common in both DNA methylation microarray platforms for further comparisons with other samples.
It is worth mentioning one exception to the clear classification of organoids by tumour type according to DNA methylation profiles. It was the case of the oesophageal organoid PDM-66 that for both EPIC (850 K) and 450 K sites in the hierarchical clustering (,c)) and t-SNE (,d)) studies appeared among the colorectal cancer organoids. We applied, in this case, a further DNA methylation analysis, the EPICUP test, that provides the tissue of origin in Cancer of Unknown Primary (CUP) [Citation27] and colorectal cancer was the second obtained diagnosis. Thus, the epigenetic features of this oesophageal cancer organoid closely resemble a colorectal tumour. In this regard, it is worth mentioning that oesophageal adenocarcinomas harbouring certain molecular defects, such as ARID1A mutations and microsatellite instability, exhibit clinicopathological features fairly similar to colorectal adenocarcinomas [Citation28,Citation29].
Human cancer organoids maintain cancer-specific DNA methylation characteristics
Having shown that human cancer organoids available at the ATCC exhibit distinct DNA methylation profiles according to their tissue of origin, we wondered if they also keep the epigenetic dysregulation characteristic of the transformed cells derived from each organ. This is a relevant point because tumour organoids do not grow quicker than their corresponding normal organoid counterpart [Citation9]. Importantly, in several cases, the cancer organoid grows slower than the matching normal tissue, maybe related to a higher percentage of mitotic failures and ulterior cell death in the tumour organoid [Citation30,Citation31]. Strategies to avoid the growth of the normal tissue instead of the real tumour involve initiating the culture either with pure tumour material or the use of selective culture conditions, such as the deprivation of growth factors that are essential for normal-tissue-derived organoids [Citation9]. Thus, to check if in any of the studied cancer organoids the healthy cells from residual normal tissue have outgrown the cancer cells and are the majority cell type in the available organoid, we compared the DNA methylation profiles of the cancer organoids with those of the matching normal tissues. The DNA methylation profiles for 50 normal tissues were obtained from the TCGA database (https://portal.gdc.cancer.gov/), corresponding to 10 cases of each tissue type: colon, pancreas, oesophagus, stomach, and lung.
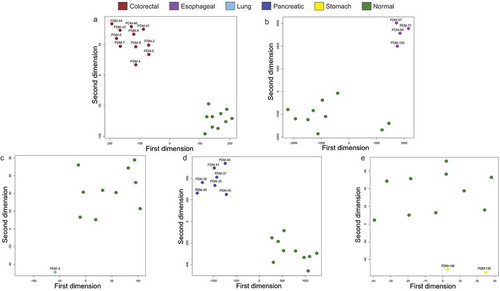
Using the unsupervised hierarchical clustering with multi-step bootstrap resampling approach, we found specific DNA methylation profiles in the cancer organoids that enabled their distinction from their corresponding normal tissues obtained from the TCGA (-e)). In this regard, the tree-based dendrogram provided two clear arms for each tissue of origin: one for the cancer organoids and another for the corresponding normal tissues. Dimensionality reduction analyses by t-SNE mirrored the hierarchical clustering data (-e)). Thus, these results strongly support that the studied organoids are really derived from tumour cells without evident normal tissue contamination.
Figure 2. Cancer organoid DNA methylation profiles are distinct to their healthy tissue counterparts according to unsupervised hierarchical clustering. (a–e) Heatmaps showing unsupervised hierarchical clustering with bootstrap resampling DNA methylation clustering of each cancer organoid against its healthy tissue equivalent. All healthy samples are represented in light grey and are pertinent to the organoid cell type. For example, the heatmap represented in Figure 2a, light grey represents normal colorectal tissue methylation, in Figure 2b, light grey represents methylation clustering in healthy oesophageal cells, etc. In all heatmaps, red represents methylated CpGs, green unmethylated CpGs, and black. Organoid DNA methylation profiles are displayed by cancer types: brown (colorectal cancer), violet (oesophageal cancer), light blue (lung cancer), dark blue (pancreatic cancer), yellow (stomach cancer), and light grey (corresponding normal tissue). All interrogated CpGs were analysed using only EPIC and 450 K shared probes
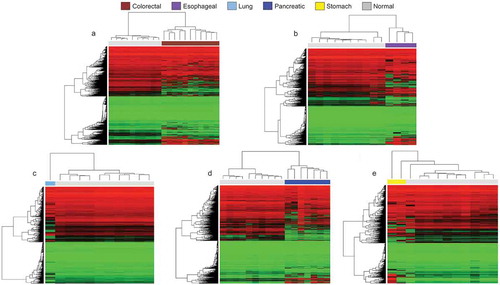
Figure 3. Cancer organoid DNA methylation profiles are distinct to their healthy tissue counterparts according to t-SNE. (a–e) t-SNE of cancer organoid DNA methylation vs its normal tissue counterpart and each organoid sample is labelled according to its respective ATCC ID. Organoid DNA methylation profiles are displayed by cancer types: brown (colorectal cancer), violet (oesophageal cancer), light blue (lung cancer), dark blue (pancreatic cancer), yellow (stomach cancer), and green (corresponding normal tissue). All interrogated CpGs were analysed using only EPIC and 450 K shared probes
Human cancer organoids exhibit DNA methylation profiles that are closer to primary tumour samples than to established cancer cell lines
As mentioned in the introduction, many studies dealing with the cellular and molecular features of tumours have been performed using human cancer cell lines that have proven to be a useful tool in many cases, but these models also show important caveats that question how they really mirror the biology of the primary sample. In this regard, organoids have been proposed to replicate better the features of the real cancer case within the patient. Thus, to validate or not this concept in the studied set of ATCC cancer organoids, we compared the DNA methylation landscapes of these tumour organoids with those of primary tumours and cancer cell lines according to each cell type. The 450 K DNA methylation profiles for the primary tumours were obtained from the TCGA database (TCGA Research Network: https://www.cancer.gov/tcga) (n = 500, 100 cases for each one of the five studied tumour types) and the cancer cell lines from the Sanger collection [Citation17] (n = 204, corresponding to 49 colon, 31 pancreas, 35 oesophagus, 28 stomach and 61 lung cancer cell lines).
Applying the unsupervised hierarchical clustering with multi-step bootstrap resampling methodology, we observed that overall the cancer organoids clustered within the primary tumours and rarely among the established cancer cell lines (,b) and -c)). In this regard, the tree-based dendrogram yielded two evident arms: one for the primary tumours that included also most of the organoids and another arm that corresponded to the established cancer cell lines. Dimensionality reduction studies by t-SNE mimicked the hierarchical clustering data with the cancer cell lines grouped apart, whereas the majority of the cancer organoids clustered with the primary tumours (-d) and -c)). Thus, derived from the unsupervised hierarchical clustering and t-SNE approaches, our data favour the idea that human cancer organoids available at the ATCC resemble more the epigenetic setting of primary tumours than long-term 2D cultured cancer cell lines and can be very useful models to recapitulate the disease in the experimental laboratory setting.
Figure 4. DNA methylation profiles from colorectal and pancreatic cancer organoids in the context of primary tumours and cancer cell lines. Heatmaps representing unsupervised hierarchical clustering with bootstrap resampling of DNA methylation in colorectal (a) and pancreatic (b) cancer organoid samples and their primary tumour [The Cancer Genome Atlas or (TCGA)] and cancer cell line [Wellcome Sanger Institute (Sanger)] counterparts. Red represents methylated CpGs, green unmethylated CpGs. (c and d) t-SNE plots show organoid, primary tumours and cancer cell lines clustering based on their DNA methylation profiles representing (c) colorectal cancer and (d), pancreatic cancer. Each organoid sample is labelled according to its respective ATCC ID. (a – d) DNA methylation profiles are displayed as cancer types and tissues; brown (organoid colorectal cancer), dark blue (organoid pancreatic cancer), primary tumour (black) and cancer cell lines (dark grey). The primary tumours and cancer cell lines are respective of the organoid tissue in each figure. All CpGs were analysed using only EPIC and 450 K shared probes
![Figure 4. DNA methylation profiles from colorectal and pancreatic cancer organoids in the context of primary tumours and cancer cell lines. Heatmaps representing unsupervised hierarchical clustering with bootstrap resampling of DNA methylation in colorectal (a) and pancreatic (b) cancer organoid samples and their primary tumour [The Cancer Genome Atlas or (TCGA)] and cancer cell line [Wellcome Sanger Institute (Sanger)] counterparts. Red represents methylated CpGs, green unmethylated CpGs. (c and d) t-SNE plots show organoid, primary tumours and cancer cell lines clustering based on their DNA methylation profiles representing (c) colorectal cancer and (d), pancreatic cancer. Each organoid sample is labelled according to its respective ATCC ID. (a – d) DNA methylation profiles are displayed as cancer types and tissues; brown (organoid colorectal cancer), dark blue (organoid pancreatic cancer), primary tumour (black) and cancer cell lines (dark grey). The primary tumours and cancer cell lines are respective of the organoid tissue in each figure. All CpGs were analysed using only EPIC and 450 K shared probes](/cms/asset/e4444a01-3a99-4a7a-8242-a9a92520ff82/kepi_a_1762398_f0004_c.jpg)
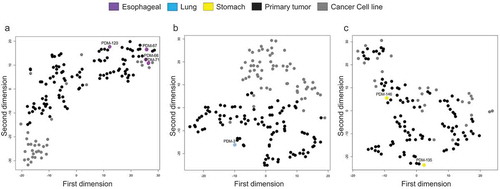
Figure 5. DNA methylation profiles of oesophageal, lung, and stomach cancer cluster predominately with primary tumours according to unsupervised hierarchical clustering. (a – c) Heatmaps demonstrating unsupervised hierarchical clustering with bootstrap resampling of oesophageal cancer organoids, oesophageal primary tumours (TCGA), and oesophageal cancer cell lines (Sanger) (a), lung (b) and stomach (c) DNA methylation. Red represents methylated CpGs, green unmethylated CpGs. Organoids are represented in violet (oesophageal cancer), light blue (lung cancer), and yellow (stomach cancer). In black, all pertinent primary tumours and dark grey, the respective cancer cell lines. All CpGs were examined using only EPIC and 450 K shared probes
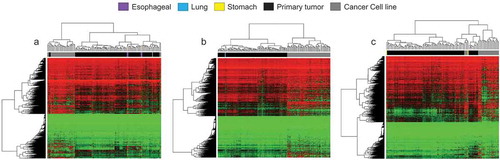
Figure 6. DNA methylation profiles of oesophageal, lung, and stomach cancer cluster predominately with primary tumours according to t-SNE. (a–c) t-SNE plots of oesophageal organoid DNA methylation visualization (a), lung (b) and stomach (c) with primary tumour (TCGA) and cancer cell line (Sanger) equivalents. Organoids are represented in violet (oesophageal cancer), light blue (lung cancer), and yellow (stomach cancer). In black, all pertinent primary tumours and dark grey, the respective cancer cell lines. All CpGs were examined using only EPIC and 450 K shared probes
Conclusions
We know very little about how well the molecular setting of human cancer organoids represents the cellular defects that occur in primary tumour samples. Our ignorance in this area is larger if we just focus in the epigenetic landscape where only in a very few cases the DNA methylation patterns have been recently explored in these tumoural experimental models [Citation32,Citation33]. Our analyses of the DNA methylation profiles in human cancer organoids available from ATCC demonstrate that these biological systems maintain their epigenetic signature characteristic of the original primary cancer type, are truly transformed cells distinct from their corresponding normal counterparts and are more proximal to primary tumours than to long-established cancer cell lines. Thus, these tumour organoids represent an excellent tool for cellular and molecular studies of human cancer. Most importantly, their availability in ATCC constitutes an advantage to develop more objective, coordinated, and shareable investigations in this area by scientists worldwide.
Methods
Sample preparation
Genomic DNA from 25 embedded 3D cultures (organoid) representing 5 cancer subtypes were purchased from the Human Cancer Models Initiative, American Type Culture Collection (ATCC). The clinical tumour diagnoses for the five organoid cancer subtypes were Colorectal (n = 11), Pancreatic (n = 7), Oesophageal (n = 4), Stomach (n = 2) and Lung (n = 1) cancer. Organoid IDs are listed in . Genomic DNA was quantified using Pico Green fluorescence kit/Qubit® 2.0 Fluorometer (life technologies). DNA integrity of all samples was checked by electrophoresis in a 1.3% agarose gel. Bisulphite conversion of genomic DNA was carried out using the EZ DNA Methylation Kit (Zymo Research) following the manufacturer’s protocol and hybridized to the Infinium MethylationEPIC BeadChip (Illumina).
DNA methylation microarrays
Six hundred ng of bisulphite converted genomic DNA from all organoids were randomly distributed in a 96 well plate and subjected to genome-wide DNA methylation examination of >850,000 CpG sites by the Infinium MethylationEPIC (EPIC) BeadChip (Illumina). DNA was hybridized to the EPIC BeadChip following Illumina Infinium HD Methylation protocol and scanned using HiScan SQ system (Illumina). The resulting raw intensity files (idat) were subsequently pre-processed in-house for quality control. idat files created by the Infinium HumanMethylation450 (450 K) BeadChip (Illumina) from primary tumours and healthy tissues were obtained from The Cancer Genome Atlas (TCGA) database using their recommended GDC client data transfer tool. TCGA is a publicly available database providing essential genomics resources to the cancer community. idat files corresponded to TCGA projects that reflected the clinical tumour diagnosis of the organoids samples; TCGA-COAD and READ (colorectal cancer), TCGA-ESCA (Oesophageal cancer), TCAG-LUAD (Lung cancer), TCGA-PAAD (Pancreatic cancer), and TCGA-STAD (Stomach cancer). A random selection of 500 primary tumours (100/tumour type) and 50 healthy samples (10/tissue type) from each project were analysed in this study.
450 K data from the Sanger panel of cancer cell lines were obtained from our previous publication [Citation17]. Where both EPIC and 450 K arrays were examined in conjunction, idat files from EPIC arrays were back-converted to 450 K arrays and combined at the first step of data processing to minimize batch effects. >90% of 450 K CpG sites are present on the EPIC array [Citation20]; therefore, only shared CpGs were retained for evaluation.
DNA methylation quality control, normalization, and filtering
Raw signal intensity values were initially QC’d and pre-processed from subsequent idat files in R statistical environment (v3.6.1) [Citation34] using the minfi Bioconductor package (v1.32.0) [Citation35,Citation36]. Quality control steps were applied to minimize errors and remove poor probe signals. Potential labelling errors were discerned by examining methylation status at sex chromosomes of each individual. Problematic probes such as failed probes (detection p value >0.01), cross-reacting probes, and probes that overlapped single nucleotide variants within ± 1 bp of CpG sites were removed. Background correction and dye-based normalization were performed using ssNoob algorithm (single-sample normal-exponential out-of-band). Lastly, all sex chromosome probes were discarded. Final DNA methylation values for each CpG represented as β-values were analysed. Downstream analyses were performed under the R statistical environment (v3.6.1) [Citation34]. The complete DNA methylation data are freely available on the GEO repository under accession number GSE144213:
https://www.ncbi.nlm.nih.gov/geo/query/acc.cgi?acc=GSE144213
Hierarchical clustering with multi-step bootstrap resampling
Comparison of intrinsic epigenetic characteristics between organoids and primary tumours, cancer cell lines and healthy tissues was conducted by examining empirical β values for >400,000 CpG sites genome wide. Robust correlations with multistep bootstrap resampling and Euclidian distance measures for unsupervised hierarchical clustering were performed using the R package pvclust [Citation37]. Ward.d2 minimum variance agglomerative method for hierarchical clustering formation was applied using the R package hclust function [Citation38]. The final hierarchical clustering was represented as a tree-based dendrogram and plotted in a heatmap generated by 5000 random β values and constructed using R package heatmap.2. Unmethylated CpGs where β values are 0 are represented in green, heterozygous methylation where β values are 0.5 are represented in black and methylated CpGs where β values are 1, are represented in red.
Dimensionality reduction analysis using t-Distributed Stochastic Neighbour Embedding (t-SNE)
To further assess clusters found by hierarchical clustering with multi-step bootstrap resampling and to improve methylation data visualization, t-Distributed Stochastic Neighbour Embedding technique was applied using R package Rtsne [Citation21,Citation22]. Fifty-thousand β values from across the genome in all tissue types were randomly selected in 5000 iterations to assemble and visualize sample features similarity.
Author’s Contributions
RJ and ME conceived and designed the approach, interpreted the results, wrote and revised the manuscript. M.C.dM. and D.P. provided bioinfoinformatic support. D.A.E. and C.A. coordinated and performed the epigenomic experiments. All authors have read and approved the final manuscript.
Disclosure statement
ME is a consultant for Ferrer International and Quimatryx. The remaining authors declare that they have no conflict of interest.
Data availability
The complete DNA methylation data are freely available on the GEO repository under accession number GSE144213:
https://www.ncbi.nlm.nih.gov/geo/query/acc.cgi?acc=GSE144213
Additional information
Funding
References
- Scherer WF, Syverton JT, Gey GO. Studies on the propagation in vitro of poliomyelitis viruses. IV. Viral multiplication in a stable strain of human malignant epithelial cells (strain HeLa) derived from an epidermoid carcinoma of the cervix. J Exp Med. 1953;97:695–710.
- Shankavaram UT, Varma S, Kane D, et al. CellMine r: a relational database and query tool for the NCI-60 cancer cell lines. BMC Genomics. 2009;10:277.
- Garnett MJ, Edelman EJ, Heidorn SJ, et al. Systematic identification of genomic markers of drug sensitivity in cancer cells. Nature. 2012;483:570–575.
- Barretina J, Caponigro G, Stransky N, et al. The Cancer Cell Line Encyclopedia enables predictive modelling of anticancer drug sensitivity. Nature. 2012;483:603–607.
- Sasaki N, Clevers H. Studying cellular heterogeneity and drug sensitivity in colorectal cancer using organoid technology. Curr Opin Genet Dev. 2018;52:117–122.
- Bleijs M, van de Wetering M, Clevers H, et al. Xenograft and organoid model systems in cancer research. Embo J. 2019;38:e101654.
- Eiraku M, Watanabe K, Matsuo-Takasaki M, et al. Self-organized formation of polarized cortical tissues from ESCs and its active manipulation by extrinsic signals. Cell Stem Cell. 2008;3:519–532.
- Sato T, Vries RG, Snippert HJ, et al. Single Lgr5 stem cells build crypt-villus structures in vitro without a mesenchymal niche. Nature. 2009;459:262–265.
- Drost J, Clevers H. Organoids in cancer research. Nat Rev Cancer. 2018;18:407–418.
- Tuveson D, Clevers H. Cancer modeling meets human organoid technology. Science. 2019;364:952–955.
- van de Wetering M, Francies HE, Francis JM, et al. Prospective derivation of a living organoid biobank of colorectal cancer patients. Cell. 2015;161:933–945.
- Palechor-Ceron N, Krawczyk E, Dakic A, et al. Conditional reprogramming for patient-derived cancer models and next-generation living biobanks. Cells. 2019;8:1327.
- Esteller M. Epigenetics in cancer. N Engl J Med. 2008;358:1148–1159.
- Baylin SB, Jones PA. A decade of exploring the cancer epigenome - biological and translational implications. Nat Rev Cancer. 2011;11:726–734.
- Feinberg AP. The key role of epigenetics in human disease prevention and mitigation. N Engl J Med. 2018;378:1323–1334.
- Berdasco M, Esteller M. Clinical epigenetics: seizing opportunities for translation. Nat Rev Genet. 2019;20:109–127.
- Iorio F, Knijnenburg TA, Vis DJ, et al. A landscape of pharmacogenomic interactions in cancer. Cell. 2016;166:740–754.
- Nogales V, Reinhold WC, Varma S, et al. Epigenetic inactivation of the putative DNA/RNA helicase SLFN11 in human cancer confers resistance to platinum drugs. Oncotarget. 2016;7:3084–3097.
- Reinhold WC, Varma S, Sunshine M, et al. The NCI-60 methylome and its integration into cellminer. Cancer Res. 2017;77:601–612.
- Moran S, Arribas C, Esteller M. Validation of a DNA methylation microarray for 850,000 CpG sites of the human genome enriched in enhancer sequences. Epigenomics. 2016;8:389–399.
- van der Maaten LJP, Hinton GE. Visualizing high-dimensional data using t-SNE. J Mach Learn Res. 2008;9:2579–2605.
- Maaten LVD. Accelerating t-SNE using tree-based algorithms. J Mach Learn Res. 2014;15:3221–3245.
- Sandoval J, Heyn H, Moran S, et al. Validation of a DNA methylation microarray for 450,000 CpG sites in the human genome. Epigenetics. 2011;6:692–702.
- ENCODE Project Consortium. An integrated encyclopedia of DNA elements in the human genome. Nature. 2012;489:57–74.
- Siggens L, Ekwall K. Epigenetics, chromatin and genome organization: recent advances from the ENCODE project. J Intern Med. 2014;276:201–214.
- Lizio M, Harshbarger J, Shimoji H, et al. Gateways to the FANTOM5 promoter level mammalian expression atlas. Genome Biol. 2015;16:22.
- Moran S, Martínez-Cardús A, Sayols S, et al. Epigenetic profiling to classify cancer of unknown primary: a multicentre, retrospective analysis. Lancet Oncol. 2016;17:1386–1395.
- Drage MG, Tippayawong M, Agoston AT, et al. Morphological features and prognostic significance of ARID1A-deficient esophageal adenocarcinomas. Arch Pathol Lab Med. 2017;141:970–977.
- Farris AB 3rd, Demicco EG, Le LP, et al. Clinicopathologic and molecular profiles of microsatellite unstable Barrett Esophagus-associated adenocarcinoma. Am J Surg Pathol. 2011;35:647–655.
- Drost J, van Jaarsveld RH, Ponsioen B, et al. Sequential cancer mutations in cultured human intestinal stem cells. Nature. 2015;521:43–47.
- Verissimo CS, Overmeer RM, Ponsioen B, et al. Targeting mutant RAS in patient-derived colorectal cancer organoids by combinatorial drug screening. Elife. 2016;15:5.
- Roerink SF, Sasaki N, Lee-Six H, et al, Intra-tumour diversification in colorectal cancer at the single-cell level. Nature. 2018;556:457–462.
- Tao Y, Kang B, Petkovich DA, et al. Aging-like spontaneous epigenetic silencing facilitates Wnt activation, stemness, and BrafV600E-induced tumorigenesis. Cancer Cell. 2019;35(315–328.e6). DOI:10.1016/j.ccell.2019.01.005.
- Core Team R. R: A language and environment for statistical computing. Vienna, Austria: R Foundation for Statistical Computing. 2006. https://www.R-project.org/
- Aryee MJ, Jaffe AE, Corrada-Bravo H, et al. Minfi: A flexible and comprehensive Bioconductor package for the analysis of Infinium DNA Methylation microarrays. Bioinformatics. 2014;30:1363–1369.
- Fortin JP, Triche TJ, Hansen KD. Preprocessing, normalization and integration of the Illumina HumanMethylationEPIC array with minfi. Bioinformatics. 2017;33:558–560.
- Suzuki R, Shimodaira H. Pvclust: an R package for assessing the uncertainty in hierarchical clustering. Bioinformatics. 2006;22:1540–1542.
- Müllner D. fastcluster: fast Hierarchical, Agglomerative Clustering Routines for R and Python. J Stat Softw. 2013;53:1–18.