
Article title: Loss of KMT2D induces prostate cancer ROS-mediated DNA damage by suppressing the enhancer activity and DNA binding of antioxidant transcription factor FOXO3
Author: Shidong Lv, Haoran Wen, Xiongwei Shan, Jianhua Li, Yaobin Wu, Xinpei Yu, Wenhua Huang and Qiang Wei
Journal: Epigenetics
Bibliometrics: Volume 14, Number 12, pages 1194-1208
DOI: 10.1080/15592294.2019.1634985.
The authors wish to make following correction to the article listed above.
In the , the flow cytometry profile of DU145 cells is incorrect due to a mistake in sample selecting. In the , the DAPI image on PC-3 shControl group was inadvertently duplicated during figure assembly. In the , the legends are mislabeled. The corrected are enclosed.
Figure 1. Knockdown of KMT2D led to DNA damage. (a) Single cell alkaline gel electrophoretic analysis of PC-3 and DU145 cells. The tail moment was quantified using CometScore software. (b) Immunofluorescence staining analysis of γH2AX (red) in PC-3 and DU145 cells. (c) γH2A.X-positive cells were evaluated by flow cytometry using anti-γH2A.X following PE conjugated secondary antibody or Alexa Fluor 647 anti-γH2A.X in PC-3 and DU145 cells, respectively. * P < 0.05, ** P < 0.01, *** P < 0.001, compared with that of control cells. (d) Representative images of immunohistochemistry staining of PCa specimens (n = 29). (e) KMT2D mRNA levels negatively correlated with γH2A.X IHC scores in PCa tissues. All values are means ± SD. Data are representative of three independent experiments
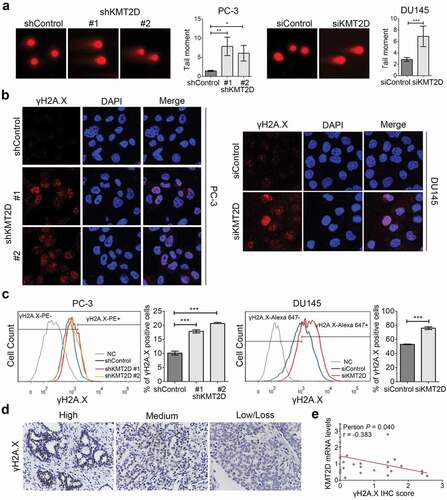
Figure 2. Increased intracellular ROS level contributed to DNA damage in the absence of KMT2D. (a) ROS levels in PC-3 and DU145 cells were detected by flow cytometry using CellROX. *** P < 0.001, compared with that of control cells. (b) The 8-OHdG concentrations of DNA were evaluated by ELISA in PC-3 and DU145 cells. * P < 0.05, *** P < 0.001, compared with that of control cells. (c) Representative images of γH2AX foci (red) of KMT2D silenced PC-3 and DU145 cells treated with NAC. (d) γH2A.X-positive cells were evaluated by flow cytometry using anti-γH2A.X following PE conjugated secondary antibody or Alexa Fluor 647 anti-γH2A.X in PC-3 and DU145 cells, respectively. All values are means ± SD. Data are representative of three independent experiments
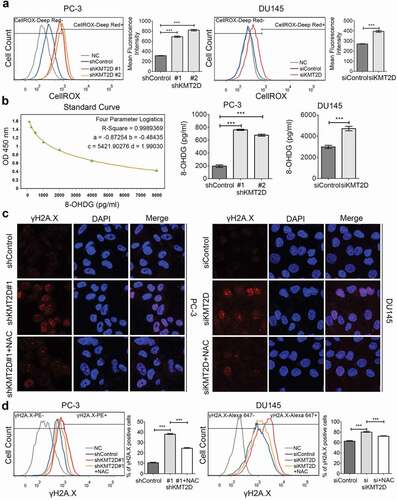
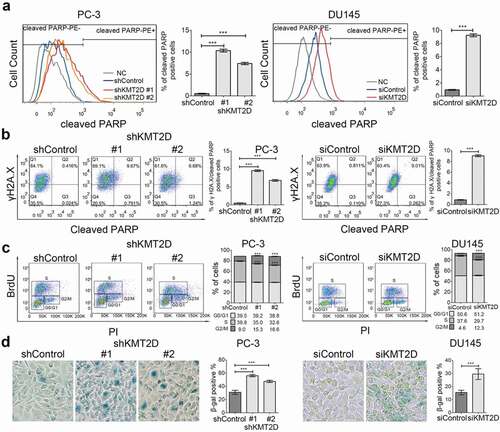
Figure 3. ROS-mediated DNA damage induced PCa cell apoptosis and senescence. (a) Cell apoptosis was evaluated with flow cytometry using PE anti-cleaved PARP in PC-3 and DU145 cells. *** P < 0.001, compared with that of control cells. (b) Representative FACS analysis of cleaved PARP and γH2A.X double positive cells in PC-3 and DU145 cells. *** P < 0.001, compared with that of control cells. (c) Cell cycle analysis of the PC-3 and DU145 cells using BrdU incorporation. Quadrangular gates represent cell cycle stages of G1/G0, S and G2/M. *** P < 0.001, compared with that of control cells. (d) Representative images of SA-β-Galactosidase staining (blue-green) of PC-3 and DU145 cells. All values are means ± SD. Data are representative of three independent experiments
On page 14, “Cell chemotherapy response assay” section, the first two sentences should be “PC-3 cells (8 × 10³) were seeded into 96-well plates. After incubation with common the genotoxic anticancer drugs doxorubicin and carboplatin or with PARP inhibitor olaparib for 72 h, cell viability was determined by quantifying the reduction of the tetrazolium dye MTT (3-(4,5-dimethylthiazol-2-yl)-2,5-diphenyltetrazolium bromide) to its insoluble formazan using standard MTT assays.”
The errors have no impact on the interpretation of the results, nor does it influence the conclusions of the work. Author apologize for any inconvenience that may have been caused.